|
|
|

|
|||||
|
|
|
Despite the recent flurry of tariff news and economic uncertainty portrayed by pundits, several key indicators are flashing bullish signals, including:
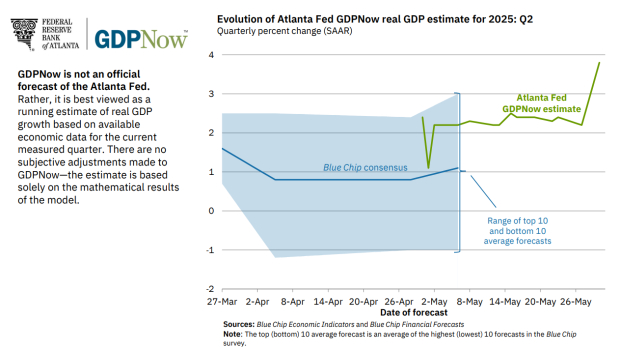
The “GDPNow Model” is a model created by the Federal Reserve Bank of Atlanta to provide a real-time estimate of the current quarter’s Gross Domestic Product (GDP) growth. Through its “Nowcasting” model, the GDPNow Model leverages a purely data-driven model that interprets current data to predict the future instead of simply predicting future economic conditions. Between the first negative GDP reading in several quarters, an escalating trade war, and negative sentiment, the GDP picture looked quite bleak. However, the current market environment illustrates why savvy investors rely on data-driven predictive models to eliminate bias and find the hard truth. In the latest reading, the GDPNow Model for real GDP growth (seasonally adjusted annual rate) in Q2 2025 is a robust 3.8%, up from 2.2% in the last reading.
The PCE Price Index (Personal Consumption Expenditures) number was released Friday. The reading came in at a 2.1% gain year-over-yea,r which was softer than Wall Street expected. The key inflation rate hit a 4-year low.

Meanwhile, “Supercore PCE,” which measures the price of “core services,” saw its first negative reading since COVID. The latest inflation reading shows that President Trump’s tariff policy has not negatively impacted prices (at least yet.) With PCE near the Fed’s 2% target, investors should expect rate cuts in 2025 – a bullish development for stocks.
Bull markets are driven by high-growth industries, and currently, the industry with the most innovation and the highest growth potential is the artificial intelligence (AI) space. Within the AI industry, Nvidia (NVDA), thesemiconductor leader, is the most important stock. In fact, without Nvidia’s GPUs, it’s impossible to be an AI leader.
The company’s earnings report in late May showed that there is plenty of room for the industry left to grow. Revenue bolted 69% year-over-year to $44 billion despite a $4.45 billion charge attributed to H20 product export restrictions to China. Despite the uncertainty in the macro trade environment, Zacks Consensus Analyst Estimates suggest that top and bottom-line growth will continue to grow at a healthy clip in the mid-double-digits.

Meanwhile, other AI industry leaders echo Nvidia’s significant growth. For instance, fellow AI leader and recent IPO CoreWeave (CRWV) reported Q1 revenue of $982 million, a fourfold year-over-year increase. Meanwhile, the Amazon (AMZN) AWS Chief reported Friday that AI cloud sales have reached multiple billions.
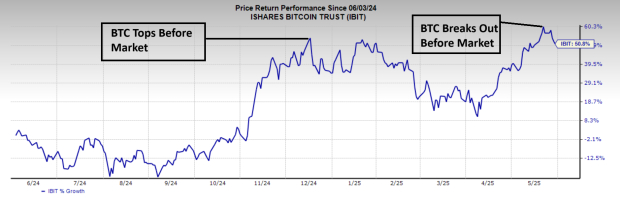
Bitcoin and bitcoin proxies like iShares Bitcoin ETF (IBIT) have been valuable tools for investors to leverage as a leading indicator. For instance, IBIT topped on December 17th, 2024, well before the S&P 500 Index topped in February 2025. Now, IBIT is breaking out to new highs well before the major US equity indices. Could they follow next?
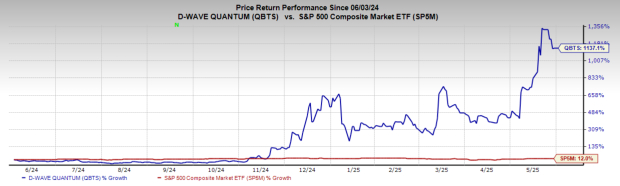
Meanwhile, other risk-on areas of the market are showing that the “animal spirits” are alive and well. For example, quantum computing leader D-Wave Quantum (QBTS) is up nearly 70% year-to-date.
The general market exhibits a massive change of character over just the past month or two. For instance, Friday, President Trump said on social media that “China’s has totally violated its agreement with the US.” Earlier in the year, stocks would have plunged on this news. However, this time, the market opened lower by around 1%, only to quickly find buyers and finish the session green. Brushing off bad news is a hallmark of a bull market and is a subtle clue for savvy investors that the market is resilient.
Now, the S&P 500 is setting up a picture-perfect daily bull flag pattern.

Bottom Line
The confluence of strong economic indicators, the AI revolution, and the market’s resilient behavior point to a market where bulls are in control.
Want the latest recommendations from Zacks Investment Research? Today, you can download 7 Best Stocks for the Next 30 Days. Click to get this free report
This article originally published on Zacks Investment Research (zacks.com).
| 59 min | |
| 1 hour | |
| 1 hour | |
| 1 hour | |
| 1 hour | |
| 2 hours | |
| 3 hours | |
| 3 hours | |
| 3 hours | |
| 3 hours | |
| 3 hours |
Berkshire Hathaway Takes Stake In New York Times, Cuts Apple, Amazon Holdings
AMZN
Investor's Business Daily
|
| 3 hours | |
| 3 hours | |
| 3 hours | |
| 3 hours |
Join thousands of traders who make more informed decisions with our premium features. Real-time quotes, advanced visualizations, backtesting, and much more.
Learn more about FINVIZ*Elite