 |
| Market Cap | 357.74M | EPS (ttm) | 0.79 |
| P/E | 16.56 | EPS this Y | - |
| Forward P/E | - | EPS next Y | - |
| PEG | - | EPS past 5Y | - |
| P/S | 101.84 | EPS next 5Y | - |
| P/B | 0.81 | EPS Q/Q | - |
| Dividend | 7.72% | Sales Q/Q | 34.40% |
| Insider Own | - | Inst Own | 36.04% |
| Insider Trans | - | Inst Trans | - |
| Short Float | 0.07% | Earnings | - |
| Analyst Recom | - | Target Price | - |
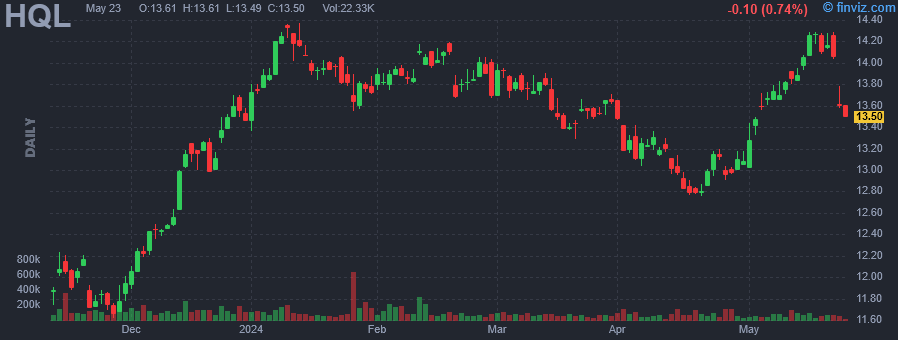
| Avg Volume | 103.69K | 52W Range | 11.34 - 14.37 |
|
|
|
|
Tekla Life Sciences Investors is a closed-ended equity mutual fund launched and managed by Tekla Capital Management LLC. The fund invests in public equity markets across the globe. It seeks to invest in stocks of companies operating in the life sciences sector, including the biotechnology, pharmaceutical, diagnostics, managed healthcare, medical equipment, hospitals, healthcare information technology and services, devices and supplies industries, and in agriculture and environmental management industries. The fund primarily invests in growth stocks of small cap companies. It employs fundamental analysis with a focus on factors such as market position for services or products, experience of business management, technological expertise, and the ability either to generate funds internally to finance growth or to secure outside sources of capital to create its portfolio. The fund benchmarks the performance of its portfolio against the NASDAQ Biotech Index and the S&P 500 Index. It was formerly known as H&Q Life Sciences Investors fund. Tekla Life Sciences Investors was formed on February 20, 1992 and is domiciled in the United States. |
| Insider Trading |
Relationship |
Date |
Transaction |
Cost |
#Shares |
Value ($) |
#Shares Total |
SEC Form 4 |
| Saba Capital Management, L.P. | 10% Owner | Apr 26 '24 | Buy | 13.00 | 120,304 | 1,563,952 | 3,025,602 | Apr 29 04:54 PM | | Saba Capital Management, L.P. | 10% Owner | Apr 25 '24 | Buy | 12.99 | 97,574 | 1,267,486 | 2,905,298 | Apr 26 11:40 AM | | Saba Capital Management, L.P. | 10% Owner | Apr 24 '24 | Buy | 13.12 | 20,529 | 269,340 | 2,807,724 | Apr 26 11:40 AM | | Saba Capital Management, L.P. | 10% Owner | Apr 23 '24 | Buy | 13.15 | 48,203 | 633,869 | 2,787,195 | Apr 23 08:00 PM | | Saba Capital Management, L.P. | 10% Owner | Apr 22 '24 | Buy | 12.88 | 2,022 | 26,043 | 2,738,992 | Apr 23 08:00 PM |
|
|
 |
 |
| Market Cap | 442.33M | EPS (ttm) | -1.08 |
| P/E | - | EPS this Y | 57.84% |
| Forward P/E | - | EPS next Y | 67.38% |
| PEG | - | EPS past 5Y | - |
| P/S | 0.72 | EPS next 5Y | -5.87% |
| P/B | 11.76 | EPS Q/Q | -317.77% |
| Dividend | 0.58% | Sales Q/Q | -1.60% |
| Insider Own | 26.54% | Inst Own | 74.31% |
| Insider Trans | -21.74% | Inst Trans | 1.19% |
| Short Float | 7.87% | Earnings | Apr 26/b |
| Analyst Recom | 3.00 | Target Price | 1.80 |
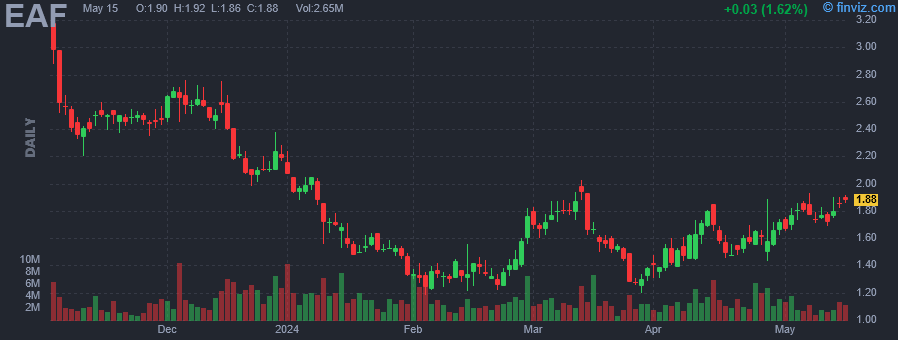
| Avg Volume | 3.33M | 52W Range | 1.18 - 5.32 |
|
|
|
|
GrafTech International Ltd. engages in the manufacture of graphite electrode products essential to the production of electric arc furnace steel and other ferrous and non-ferrous metals. The firm also produces a needle coke product which is a raw material in producing graphite electrodes. Its customers include steel producers and other ferrous and non-ferrous metal producers in Europe, the Middle East and Africa, the Americas and Asia-Pacific, which sell its products into the automotive, construction, appliance, machinery, equipment, and transportation industries. The company was founded in 1886 and is headquartered in Brooklyn Heights, OH. |
| Insider Trading |
Relationship |
Date |
Transaction |
Cost |
#Shares |
Value ($) |
#Shares Total |
SEC Form 4 |
| Colonial House Capital Ltd | 10% Owner | Apr 26 '24 | Buy | 1.48 | 179,279 | 266,211 | 29,714,854 | Apr 29 04:41 PM | | Colonial House Capital Ltd | 10% Owner | Apr 16 '24 | Buy | 1.78 | 2,303,599 | 4,100,867 | 29,535,575 | Apr 18 04:08 PM | | BCP GP Ltd | Former 10% Owner | Jan 02 '24 | Sale | 2.20 | 3,922,786 | 8,630,129 | 23,352,826 | Jan 04 08:32 PM | | BCP GP Ltd | Former 10% Owner | Jan 02 '24 | Sale | 2.20 | 3,922,786 | 8,630,129 | 23,352,826 | Jan 04 08:27 PM | | BCP GP Ltd | Former 10% Owner | Jan 02 '24 | Sale | 2.20 | 3,922,786 | 8,630,129 | 23,352,826 | Jan 04 08:23 PM |
|
|
|
 |
| Market Cap | 136.38M | EPS (ttm) | -0.51 |
| P/E | - | EPS this Y | 2941.09% |
| Forward P/E | 7.92 | EPS next Y | 11.06% |
| PEG | - | EPS past 5Y | - |
| P/S | 0.91 | EPS next 5Y | - |
| P/B | 1.35 | EPS Q/Q | -115.14% |
| Dividend | - | Sales Q/Q | -19.00% |
| Insider Own | 48.23% | Inst Own | 39.26% |
| Insider Trans | 0.30% | Inst Trans | -1.53% |
| Short Float | 4.97% | Earnings | May 09/a |
| Analyst Recom | 2.67 | Target Price | 2.75 |
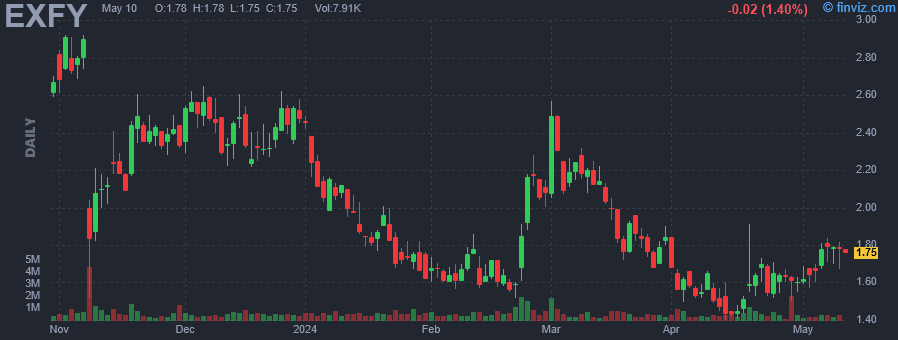
| Avg Volume | 664.85K | 52W Range | 1.40 - 8.25 |
|
|
|
|
Expensify, Inc. engages in the provision of a cloud-based expense management software platform that helps the smallest to the largest businesses simplify the way they manage money. It operates under the United States and All Other Locations geographical segments. The company was founded by David Barrett and Witold Stankiewicz on May 1, 2008 and is headquartered in Portland, OR. |
| Insider Trading |
Relationship |
Date |
Transaction |
Cost |
#Shares |
Value ($) |
#Shares Total |
SEC Form 4 |
| Barrett David Michael | Chief Executive Officer | Apr 30 '24 | Sale | 1.59 | 1,500 | 2,385 | 1,024,411 | Apr 30 04:47 PM | | Barrett David Michael | Chief Executive Officer | Apr 29 '24 | Sale | 1.61 | 1,500 | 2,415 | 1,025,911 | Apr 30 04:47 PM | | McLaughlin Steven J. | 10% Owner | Apr 26 '24 | Buy | 1.60 | 200 | 320 | 9,015,836 | Apr 29 04:38 PM | | Barrett David Michael | Chief Executive Officer | Apr 26 '24 | Sale | 1.63 | 12,437 | 20,272 | 1,027,411 | Apr 30 04:47 PM | | McLaughlin Steven J. | 10% Owner | Apr 25 '24 | Buy | 1.59 | 17,511 | 27,842 | 9,015,636 | Apr 29 04:38 PM |
|
|
| |
 |
| Market Cap | 32.03M | EPS (ttm) | -0.24 |
| P/E | - | EPS this Y | - |
| Forward P/E | - | EPS next Y | - |
| PEG | - | EPS past 5Y | -31.04% |
| P/S | 0.73 | EPS next 5Y | - |
| P/B | 0.32 | EPS Q/Q | 96.97% |
| Dividend | - | Sales Q/Q | 12.70% |
| Insider Own | 55.92% | Inst Own | 7.56% |
| Insider Trans | 1.68% | Inst Trans | -11.31% |
| Short Float | 0.63% | Earnings | - |
| Analyst Recom | - | Target Price | - |
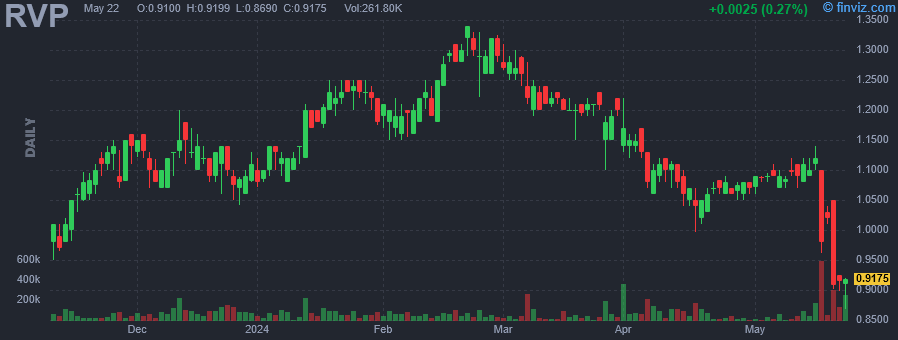
| Avg Volume | 75.26K | 52W Range | 0.95 - 1.73 |
|
|
|
|
Retractable Technologies, Inc. engages in the manufacture and market of safety needle devices for the healthcare industry. It offers injection devices, blood collection devices, and infusion devices. The company was founded by Thomas J. Shaw on May 9, 1994 and is headquartered in Little Elm, TX. |
| Insider Trading |
Relationship |
Date |
Transaction |
Cost |
#Shares |
Value ($) |
#Shares Total |
SEC Form 4 |
| SHAW THOMAS J | PRESIDENT AND CEO | Apr 26 '24 | Buy | 1.07 | 850 | 908 | 14,353,703 | Apr 29 03:16 PM | | SHAW THOMAS J | PRESIDENT AND CEO | Apr 25 '24 | Buy | 1.05 | 22 | 23 | 14,352,853 | Apr 29 03:16 PM | | SHAW THOMAS J | PRESIDENT AND CEO | Apr 17 '24 | Buy | 1.03 | 15,363 | 15,801 | 14,352,831 | Apr 18 01:48 PM | | SHAW THOMAS J | PRESIDENT AND CEO | Apr 15 '24 | Buy | 1.06 | 3,587 | 3,802 | 14,337,468 | Apr 16 12:51 PM | | SHAW THOMAS J | PRESIDENT AND CEO | Apr 05 '24 | Buy | 1.09 | 30,491 | 33,302 | 14,333,881 | Apr 08 11:17 AM |
|
|
|
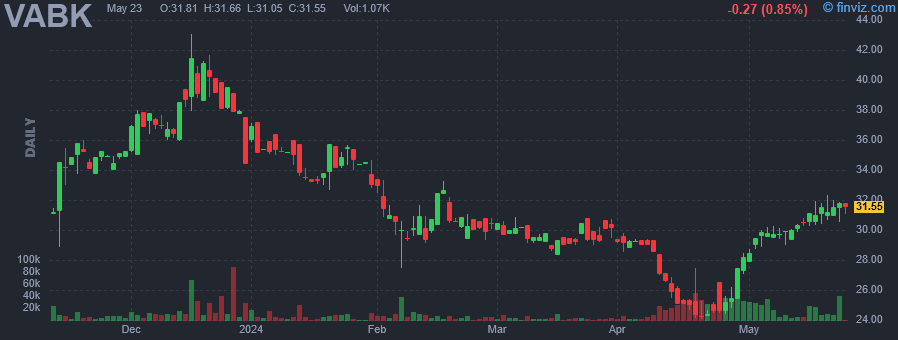 |
| Market Cap | 152.05M | EPS (ttm) | 3.18 |
| P/E | 8.87 | EPS this Y | - |
| Forward P/E | - | EPS next Y | - |
| PEG | - | EPS past 5Y | 2.60% |
| P/S | 1.88 | EPS next 5Y | - |
| P/B | 1.00 | EPS Q/Q | -37.09% |
| Dividend | 4.68% | Sales Q/Q | 9.19% |
| Insider Own | 12.51% | Inst Own | 37.78% |
| Insider Trans | 0.52% | Inst Trans | -3.23% |
| Short Float | 1.19% | Earnings | Oct 20/b |
| Analyst Recom | - | Target Price | - |
| Avg Volume | 12.39K | 52W Range | 24.06 - 43.08 |
|
|
|
|
Virginia National Bankshares Corp. is a bank holding company engaged in the provision of banking and related financial services. It operates through the following segments: Bank, VNB Trust and Estate Services, Sturman Wealth Advisors, and Masonry Capital. The Bank segment includes making loans, taking deposits, and offering related services to individuals, businesses, and charitable organizations. The VNB Trust and Estate Services segment consists of corporate trustee services, trust and estate administration, IRA administration and custody services, and in-house investment management services. The Sturman Wealth Advisors segment offers wealth and investment advisory services. The Masonry Capital segment refers to the investment management services for separately managed accounts and a private investment fund. The company was founded in 1998 and is headquartered in Charlottesville, VA. |
| Insider Trading |
Relationship |
Date |
Transaction |
Cost |
#Shares |
Value ($) |
#Shares Total |
SEC Form 4 |
| HOUSTON LINDA M | Director | Apr 25 '24 | Buy | 24.99 | 1,000 | 24,987 | 11,779 | Apr 29 12:02 PM | | CARTER KEVIN T | Director | Apr 25 '24 | Buy | 24.75 | 400 | 9,900 | 11,761 | Apr 29 01:09 PM | | Keyser Jay B | Director | Feb 08 '24 | Buy | 29.25 | 500 | 14,625 | 3,033 | Feb 09 03:19 PM | | Wells Gregory L | Director | Feb 07 '24 | Buy | 29.66 | 910 | 26,991 | 14,125 | Feb 09 03:01 PM | | Rust Glenn W | President and CEO | Feb 07 '24 | Buy | 29.02 | 685 | 19,878 | 49,538 | Feb 09 03:09 PM |
|
|
| |
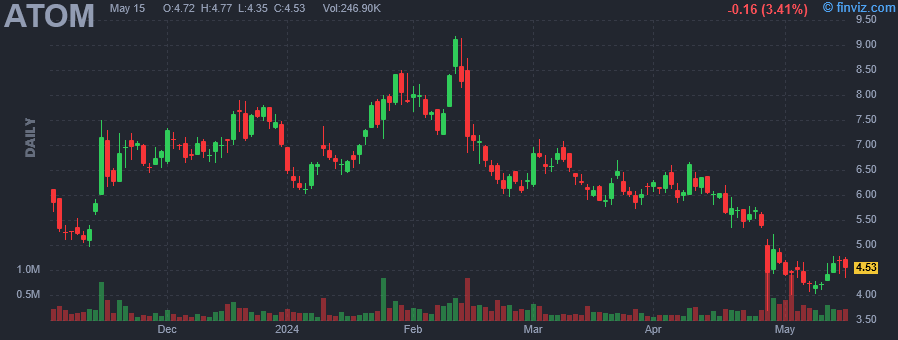 |
| Market Cap | 124.82M | EPS (ttm) | -0.77 |
| P/E | - | EPS this Y | 25.00% |
| Forward P/E | - | EPS next Y | 41.67% |
| PEG | - | EPS past 5Y | 4.74% |
| P/S | 218.98 | EPS next 5Y | 20.00% |
| P/B | 6.78 | EPS Q/Q | 12.68% |
| Dividend | - | Sales Q/Q | - |
| Insider Own | 4.83% | Inst Own | 31.84% |
| Insider Trans | -1.99% | Inst Trans | 1.12% |
| Short Float | 18.78% | Earnings | Apr 25/a |
| Analyst Recom | 1.00 | Target Price | 13.00 |
| Avg Volume | 236.91K | 52W Range | 3.68 - 10.72 |
|
|
|
|
Atomera, Inc. engages in the development, commercialization, and licensing of proprietary processes and technologies for the semiconductor industry. It developed Mears Silicon Technology, which increases performance and power efficiency in semiconductor transistors. The company was founded by Robert Mears on November 26, 2001 and is headquartered in Los Gatos, CA. |
| Insider Trading |
Relationship |
Date |
Transaction |
Cost |
#Shares |
Value ($) |
#Shares Total |
SEC Form 4 |
| LE DUY LOAN T | Director | Apr 29 '24 | Buy | 4.60 | 5,000 | 22,989 | 83,958 | Apr 29 11:05 AM | | SHEVICK STEVEN K | Director | Apr 29 '24 | Buy | 4.66 | 2,200 | 10,252 | 2,200 | Apr 29 11:43 AM | | Ramnath Suja | Director | Apr 29 '24 | Buy | 4.58 | 2,230 | 10,213 | 36,238 | Apr 29 10:45 AM | | Gerber John | Director | Apr 29 '24 | Buy | 4.92 | 2,031 | 10,002 | 278,617 | Apr 29 12:54 PM | | Mears Robert J | Chief Technology Officer | Mar 04 '24 | Sale | 6.83 | 3,294 | 22,498 | 138,730 | Mar 05 04:02 PM |
|
|
|
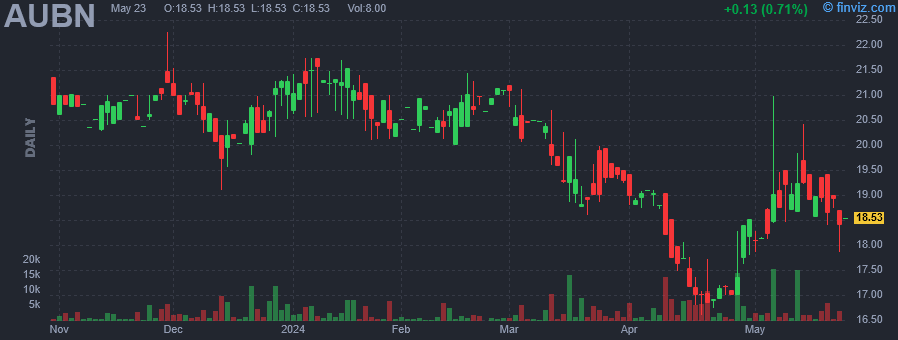 |
| Market Cap | 64.60M | EPS (ttm) | 0.23 |
| P/E | 81.11 | EPS this Y | - |
| Forward P/E | - | EPS next Y | - |
| PEG | - | EPS past 5Y | -30.30% |
| P/S | 2.16 | EPS next 5Y | - |
| P/B | 0.87 | EPS Q/Q | -30.03% |
| Dividend | 5.83% | Sales Q/Q | -16.43% |
| Insider Own | 55.90% | Inst Own | 8.65% |
| Insider Trans | 0.55% | Inst Trans | 4.63% |
| Short Float | 0.22% | Earnings | - |
| Analyst Recom | - | Target Price | - |
| Avg Volume | 3.33K | 52W Range | 16.61 - 23.20 |
|
|
|
|
Auburn National Bancorporation, Inc. is a bank holding company. It engages in the provision of banking services to commercial and retail customers. The firm operates through the following segments: Commercial and Industrial, Construction and Land Development, Commercial Real Estate, Residential Real Estate, and Consumer Installment. The Commercial and Industrial segment includes loans to finance business operations, equipment purchases, or other needs for small and medium-sized commercial customers. The Construction and Land Development segment is comprised of both loans and credit lines for the purpose of purchasing, carrying and developing land into commercial developments or residential subdivisions. The Commercial and Industrial segment provides loans disaggregated into three classes: owner occupied, multi-family and other. The Residential Real Estate segment is involved in consumer mortgage and investment property. The Consumer Installment segment encompasses loans to individuals both secured by personal property and unsecured. The company was founded in 1990 and is headquartered in Auburn, AL. |
| Insider Trading |
Relationship |
Date |
Transaction |
Cost |
#Shares |
Value ($) |
#Shares Total |
SEC Form 4 |
| Hedges David A | President\CEO | Apr 26 '24 | Buy | 17.60 | 10,000 | 176,000 | 11,663 | Apr 29 12:00 PM | | Barrett J Tutt | Director | Apr 09 '24 | Buy | 19.25 | 93 | 1,791 | 8,553 | Apr 10 10:43 AM | | HAM WILLIAM F JR | Director | Apr 09 '24 | Buy | 19.21 | 72 | 1,383 | 4,841 | Apr 10 10:59 AM | | HOUSEL DAVID E | Director | Apr 09 '24 | Buy | 19.25 | 64 | 1,232 | 7,345 | Apr 10 10:27 AM | | O'DONNELL SHANNON | Senior Vice President | Apr 09 '24 | Buy | 19.28 | 34 | 656 | 1,356 | Apr 10 10:06 AM |
|
|
| |
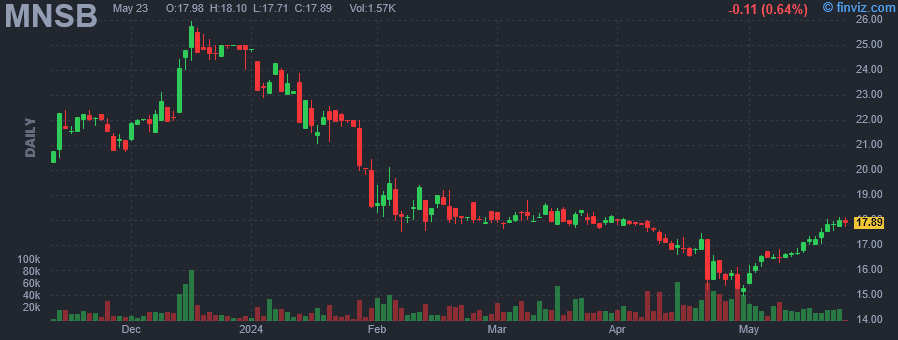 |
| Market Cap | 116.20M | EPS (ttm) | 2.60 |
| P/E | 5.88 | EPS this Y | -59.54% |
| Forward P/E | 10.53 | EPS next Y | 10.27% |
| PEG | - | EPS past 5Y | 18.59% |
| P/S | 0.88 | EPS next 5Y | - |
| P/B | 0.59 | EPS Q/Q | -64.11% |
| Dividend | 2.62% | Sales Q/Q | 12.20% |
| Insider Own | 9.79% | Inst Own | 55.24% |
| Insider Trans | 0.62% | Inst Trans | -2.06% |
| Short Float | 2.14% | Earnings | Apr 22/b |
| Analyst Recom | 2.00 | Target Price | 20.75 |
| Avg Volume | 24.87K | 52W Range | 15.20 - 25.97 |
|
|
|
|
MainStreet Bancshares, Inc. is a holding company, which engages in the provision of banking solutions through MainStreet Bank. It offers products and services such as checking, deposits, loans, credit cards, mortgages, and savings. The company was founded on March 28, 2003 and is headquartered in Fairfax, VA. |
| Insider Trading |
Relationship |
Date |
Transaction |
Cost |
#Shares |
Value ($) |
#Shares Total |
SEC Form 4 |
| DICK JEFF W | Chairman, President and CEO | Apr 29 '24 | Buy | 16.12 | 1,056 | 17,018 | 191,133 | Apr 29 11:28 AM | | ECHLOV RUSSELL | Director | Apr 26 '24 | Buy | 15.62 | 200 | 3,124 | 3,803 | Apr 26 08:44 AM | | Brockett Charles C. | Director | Apr 24 '24 | Buy | 16.40 | 710 | 11,644 | 92,318 | Apr 25 07:35 AM | | Brockett Charles C. | Director | Apr 24 '24 | Buy | 16.40 | 450 | 7,380 | 852 | Apr 25 07:35 AM | | Vari Richard Alexander | Chief Accounting Officer | Apr 24 '24 | Buy | 16.05 | 310 | 4,976 | 15,739 | Apr 24 11:07 AM |
|
|
|
 |
| Market Cap | 64.78M | EPS (ttm) | 0.71 |
| P/E | 16.35 | EPS this Y | - |
| Forward P/E | - | EPS next Y | - |
| PEG | - | EPS past 5Y | 4.60% |
| P/S | 1.74 | EPS next 5Y | - |
| P/B | 0.76 | EPS Q/Q | -40.62% |
| Dividend | - | Sales Q/Q | 8.95% |
| Insider Own | 68.95% | Inst Own | 8.94% |
| Insider Trans | 0.37% | Inst Trans | -0.54% |
| Short Float | 0.17% | Earnings | - |
| Analyst Recom | - | Target Price | - |
| Avg Volume | 2.23K | 52W Range | 9.51 - 12.24 |
|
|
|
|
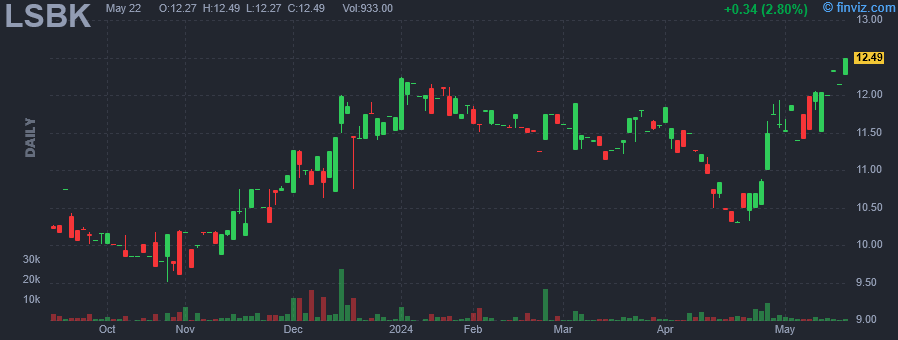
Lake Shore Bancorp, Inc. operates as a savings and loan holding company for Lake Shore Servings Bank. It offers personal services such as checking, savings, lending, banking, debit card, e-services, and online banking, and business services including deposit products, commercial loans, and business e-statements. The company was founded in 2006 and is headquartered in Dunkirk, NY. |
| Insider Trading |
Relationship |
Date |
Transaction |
Cost |
#Shares |
Value ($) |
#Shares Total |
SEC Form 4 |
| Sanvidge Kevin M. | Chairman of the Board | Apr 25 '24 | Buy | 10.81 | 3,000 | 32,442 | 18,536 | Apr 29 10:59 AM | | Passafaro Ronald J | Director | Mar 05 '24 | Buy | 11.41 | 1,500 | 17,118 | 5,678 | Mar 07 02:27 PM | | LIDDELL KIM C | Dir., Pres. and CEO of Bank | Nov 01 '23 | Buy | 10.17 | 7,000 | 71,190 | 30,749 | Nov 03 04:36 PM | | Passafaro Ronald J | Director | Oct 31 '23 | Buy | 10.17 | 1,800 | 18,315 | 1,800 | Nov 02 04:50 PM | | Sanvidge Kevin M. | Chairman of the Board | Oct 31 '23 | Buy | 10.16 | 1,000 | 10,165 | 14,346 | Nov 02 05:22 PM |
|
|
|
 |
| Market Cap | 113.27M | EPS (ttm) | -2.59 |
| P/E | - | EPS this Y | 15.55% |
| Forward P/E | - | EPS next Y | 11.23% |
| PEG | - | EPS past 5Y | 38.92% |
| P/S | 32.36 | EPS next 5Y | - |
| P/B | 7.41 | EPS Q/Q | -920.75% |
| Dividend | - | Sales Q/Q | -100.00% |
| Insider Own | 5.27% | Inst Own | 52.12% |
| Insider Trans | 3.20% | Inst Trans | 22.75% |
| Short Float | 7.96% | Earnings | Mar 18/b |
| Analyst Recom | 1.00 | Target Price | 19.50 |
| Avg Volume | 552.13K | 52W Range | 2.83 - 9.01 |
|
|
|
|
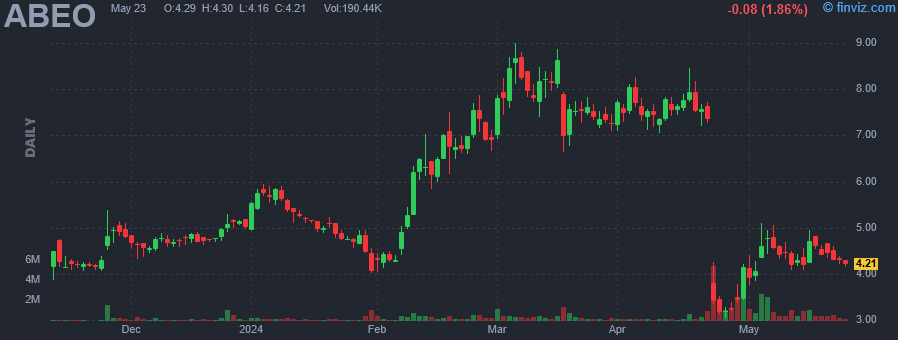
Abeona Therapeutics, Inc. is a clinical stage biopharmaceutical company, which engages in the development of gene therapy for severe and life-threatening rare diseases. It programs include EB-101 (gene-corrected skin grafts) for recessive dystrophic epidermolysis bullosa (RDEB), ABO-102 (AAV-SGSH), an adeno-associated virus (AAV) based gene therapy for Sanfilippo syndrome type A (MPS IIIA), and ABO-101 (AAV NAGLU), an AAV based gene therapy for Sanfilippo syndrome type B (MPS IIIB). The company was founded in 1974 and is headquartered in Cleveland, OH. |
| Insider Trading |
Relationship |
Date |
Transaction |
Cost |
#Shares |
Value ($) |
#Shares Total |
SEC Form 4 |
| Charles Faith L. | Director | Apr 26 '24 | Buy | 3.28 | 7,550 | 24,764 | 78,323 | Apr 29 08:30 AM | | Seshadri Vishwas | Chief Executive Officer | Apr 25 '24 | Buy | 3.20 | 10,000 | 32,000 | 538,260 | Apr 29 08:30 AM | | O'Malley Brendan M. | SVP, General Counsel | Apr 25 '24 | Buy | 3.24 | 8,600 | 27,864 | 188,718 | Apr 26 08:30 AM | | Vazzano Joseph Walter | Chief Financial Officer | Apr 25 '24 | Buy | 3.14 | 5,608 | 17,609 | 233,868 | Apr 26 08:30 AM | | Seshadri Vishwas | Chief Executive Officer | Feb 06 '24 | Buy | 4.39 | 20,000 | 87,800 | 528,260 | Feb 07 08:30 AM |
|
|
|
