 |
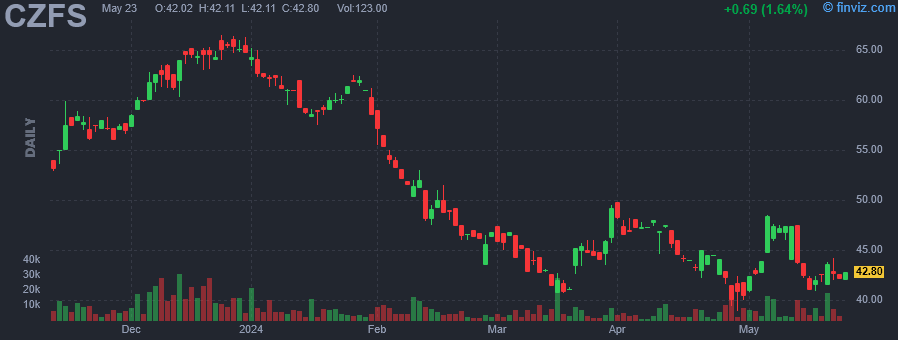
| Market Cap | 190.28M | EPS (ttm) | 3.70 |
| P/E | 10.93 | EPS this Y | 39.41% |
| Forward P/E | 6.22 | EPS next Y | 14.84% |
| PEG | - | EPS past 5Y | -3.64% |
| P/S | 1.23 | EPS next 5Y | -1.50% |
| P/B | 0.67 | EPS Q/Q | -12.86% |
| Dividend | 4.85% | Sales Q/Q | 57.46% |
| Insider Own | 7.40% | Inst Own | 22.92% |
| Insider Trans | 0.45% | Inst Trans | 9.12% |
| Short Float | 0.51% | Earnings | Apr 25/a |
| Analyst Recom | 1.00 | Target Price | 53.00 |
| Avg Volume | 6.03K | 52W Range | 38.91 - 92.00 |
|
|
| Today | Upgrade |
Janney |
Neutral → Buy |
$53 |
|
|
Apr-25-24 09:54PM
|
CZFS Stock Earnings: Citizens Financial Servs Misses EPS, Beats Revenue for Q1 2024
(InvestorPlace) |
|
04:15PM
|
CITIZENS FINANCIAL SERVICES, INC. REPORTS UNAUDITED FIRST QUARTER 2024 FINANCIAL RESULTS
(PR Newswire) |
|
Jan-30-24 06:38PM
|
/C O R R E C T I O N -- CITIZENS FINANCIAL SERVICES, INC./
(PR Newswire) |
|
04:15PM
|
CITIZENS FINANCIAL SERVICES, INC. REPORTS UNAUDITED FULL YEAR AND FOURTH QUARTER 2023 FINANCIAL RESULTS
(PR Newswire) |
|
Oct-23-23 10:07AM
|
Citizens Financial Services Q3 EPS Declines
(RTT News) |
|
09:32AM
|
CITIZENS FINANCIAL SERVICES, INC. REPORTS UNAUDITED THIRD QUARTER 2023 FINANCIAL RESULTS
(PR Newswire) |
|
Oct-06-23 12:00PM
|
Citizens Financial Services (CZFS) Upgraded to Strong Buy: Here's Why
(Zacks) |
|
Jul-31-23 04:10PM
|
CITIZENS FINANCIAL SERVICES, INC. REPORTS UNAUDITED SECOND QUARTER 2023 FINANCIAL RESULTS
(PR Newswire) |
|
Jun-16-23 04:32PM
|
Citizens Financial Services, Inc. Announces Completion of Merger with HV Bancorp, Inc.
(PR Newswire) |
|
Jun-13-23 09:22AM
|
Citizens Financial Services, Inc. Announces Preliminary Results of Merger Consideration Elections Regarding Pending HV Bancorp, Inc. Merger
(PR Newswire) -6.76% |
|
Citizens Financial Services, Inc. is a holding company, which operates as a community bank. The company was founded in 1984 and is headquartered in Mansfield, PA. |
| Insider Trading |
Relationship |
Date |
Transaction |
Cost |
#Shares |
Value ($) |
#Shares Total |
SEC Form 4 |
| Guillaume Stephen J | EXECUTIVE VICE PRESIDENT | Apr 30 '24 | Buy | 40.00 | 300 | 12,000 | 3,586 | Apr 30 11:36 AM | | BLACK RANDALL E | CEO & PRESIDENT | Feb 21 '24 | Buy | 48.00 | 100 | 4,800 | 42,233 | Feb 22 11:27 AM | | BLACK RANDALL E | CEO & PRESIDENT | Feb 20 '24 | Buy | 48.00 | 400 | 19,200 | 42,133 | Feb 22 11:27 AM | | LANDY R JOSEPH | Director | Oct 27 '23 | Buy | 47.49 | 768 | 36,472 | 24,385 | Oct 31 08:33 AM | | Guillaume Stephen J | SENIOR VICE PRESIDENT | Oct 25 '23 | Buy | 44.25 | 500 | 22,125 | 3,068 | Oct 25 01:03 PM |
|
|
 |
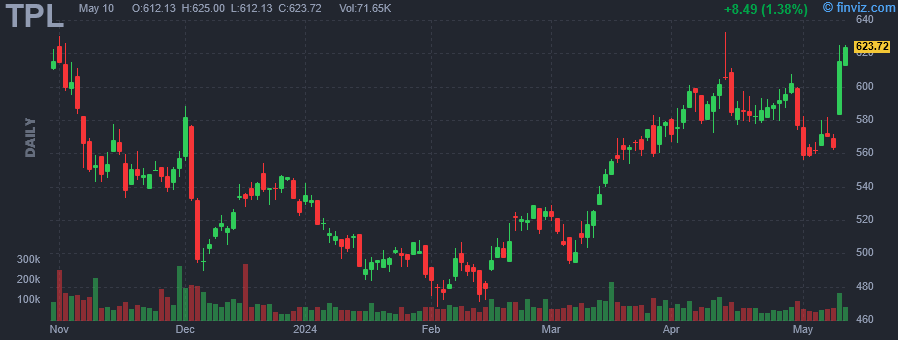 |
| Market Cap | 13.26B | EPS (ttm) | 17.59 |
| P/E | 32.76 | EPS this Y | -8.60% |
| Forward P/E | 7.88 | EPS next Y | 248.01% |
| PEG | 1.64 | EPS past 5Y | 14.40% |
| P/S | 20.99 | EPS next 5Y | 20.03% |
| P/B | 12.71 | EPS Q/Q | 13.90% |
| Dividend | 0.77% | Sales Q/Q | 9.20% |
| Insider Own | 0.82% | Inst Own | 59.40% |
| Insider Trans | 1.11% | Inst Trans | 0.69% |
| Short Float | 3.62% | Earnings | May 08/a |
| Analyst Recom | 2.70 | Target Price | 660.71 |
| Avg Volume | 75.53K | 52W Range | 422.07 - 666.67 |
|
|
|
|
Texas Pacific Land Corporation engages in the land and resource management, and water services and operations businesses. The company owns a 1/128th nonparticipating perpetual oil and gas royalty interest (NPRI) under approximately 85,000 acres of land; a 1/16th NPRI under approximately 371,000 acres of land; and approximately 4,000 additional net royalty acres, total of approximately 195,000 NRA located in the western part of Texas. The Land and Resource Management segment manages surface acres of land, and oil and gas royalty interest in West Texas. This segment also engages in easements, such as transporting oil, gas and related hydrocarbons, power line and utility, and subsurface wellbore easements. In addition, this segment leases its land for processing, storage, and compression facilities and roads; and is involved in sale of materials, such as caliche, sand, and other material, as well as sells land. The Water Services and Operations segment provides full-service water offerings, including water sourcing, produced-water treatment, infrastructure development, and disposal solutions to operators in the Permian Basin. This segment also holds produced water royalties. Texas Pacific Land Corporation was founded in 1888 and is headquartered in Dallas, Texas. |
| Insider Trading |
Relationship |
Date |
Transaction |
Cost |
#Shares |
Value ($) |
#Shares Total |
SEC Form 4 |
| HORIZON KINETICS ASSET MANAGEM | 10% Owner | Apr 29 '24 | Buy | 602.40 | 3 | 1,807 | 1,084,962 | Apr 30 10:53 AM | | HORIZON KINETICS ASSET MANAGEM | 10% Owner | Apr 26 '24 | Buy | 595.67 | 3 | 1,787 | 1,084,959 | Apr 29 11:48 AM | | HORIZON KINETICS ASSET MANAGEM | 10% Owner | Apr 25 '24 | Buy | 592.02 | 3 | 1,776 | 1,084,956 | Apr 26 11:51 AM | | HORIZON KINETICS ASSET MANAGEM | 10% Owner | Apr 24 '24 | Buy | 589.01 | 3 | 1,767 | 1,084,953 | Apr 25 10:12 AM | | HORIZON KINETICS ASSET MANAGEM | 10% Owner | Apr 23 '24 | Buy | 587.81 | 3 | 1,763 | 1,084,950 | Apr 24 10:38 AM |
|
|
|
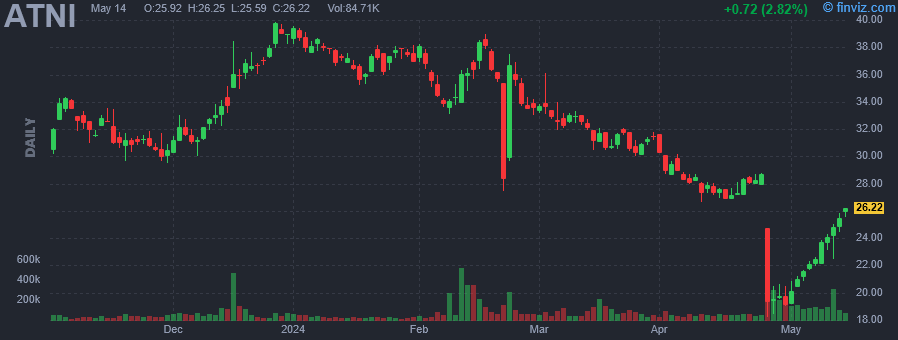 |
| Market Cap | 295.36M | EPS (ttm) | -1.22 |
| P/E | - | EPS this Y | 45.97% |
| Forward P/E | 35.46 | EPS next Y | 179.66% |
| PEG | - | EPS past 5Y | - |
| P/S | 0.39 | EPS next 5Y | 20.00% |
| P/B | 0.54 | EPS Q/Q | 6.92% |
| Dividend | 5.03% | Sales Q/Q | 0.55% |
| Insider Own | 33.44% | Inst Own | 65.62% |
| Insider Trans | 0.19% | Inst Trans | -0.51% |
| Short Float | 2.42% | Earnings | Apr 24/a |
| Analyst Recom | 1.50 | Target Price | 35.67 |
| Avg Volume | 112.51K | 52W Range | 18.20 - 41.03 |
|
|
|
|
ATN International, Inc. engages in investment in communications, energy, and technology businesses. It operates through the U.S. Telecom and International Telecom segments. The U.S. Telecom segment offers carrier services, including wholesale roaming services, site maintenance, and the leasing of critical network infrastructure. The International Telecom segment caters to other telecom providers such as international long-distance, roaming from other carriers, and transport and access services, as well as fixed internet and voice, and retail mobility services. The company was founded by Cornelius B. Prior Jr. in June 1987 and is headquartered in Beverly, MA. |
| Insider Trading |
Relationship |
Date |
Transaction |
Cost |
#Shares |
Value ($) |
#Shares Total |
SEC Form 4 |
| PRIOR MICHAEL T | EXECUTIVE CHAIRMAN | Apr 29 '24 | Buy | 19.88 | 10,000 | 198,800 | 523,026 | Apr 30 10:32 AM | | Leon Justin M | SVP, CORPORATE DEVELOPMENT | Mar 08 '24 | Option Exercise | 0.00 | 2,795 | 0 | 25,223 | Mar 27 02:51 PM | | PRIOR MICHAEL T | EXECUTIVE CHAIRMAN | Mar 08 '24 | Option Exercise | 0.00 | 16,641 | 0 | 503,968 | Mar 12 06:02 PM | | BENINCASA JUSTIN D | CFO | Mar 08 '24 | Option Exercise | 0.00 | 6,966 | 0 | 74,184 | Mar 12 05:59 PM | | Martin Brad W | CHIEF OPERATING OFFICER | Mar 08 '24 | Option Exercise | 0.00 | 6,450 | 0 | 44,542 | Mar 12 12:18 PM |
|
|
| |
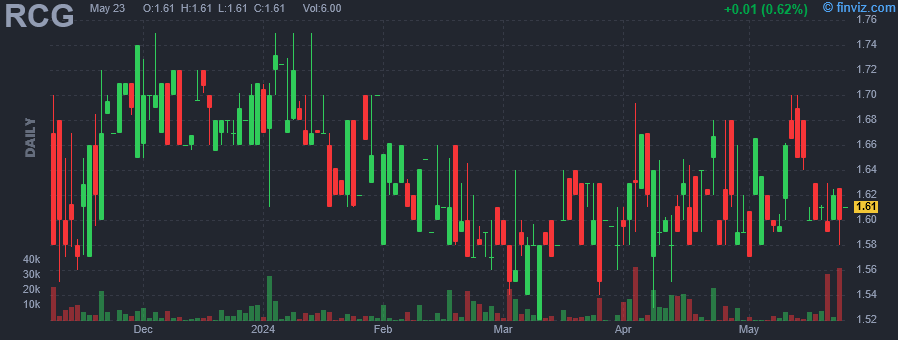 |
| Market Cap | 11.16M | EPS (ttm) | -0.12 |
| P/E | - | EPS this Y | - |
| Forward P/E | - | EPS next Y | - |
| PEG | - | EPS past 5Y | - |
| P/S | 39.03 | EPS next 5Y | - |
| P/B | 0.81 | EPS Q/Q | - |
| Dividend | 0.95% | Sales Q/Q | 26.30% |
| Insider Own | 14.93% | Inst Own | 16.58% |
| Insider Trans | 1.50% | Inst Trans | - |
| Short Float | 0.01% | Earnings | - |
| Analyst Recom | - | Target Price | - |
| Avg Volume | 7.64K | 52W Range | 1.52 - 1.90 |
|
|
|
|
RENN Fund, Inc. is a closed ended equity mutual fund launched by RENN Capital Group, Inc. The fund is co-managed by Horizon Kinetics Asset Management LLC. It invests in the public equity markets of the United States. The fund seeks to invest in stocks of companies operating across diversified sectors. It seeks to invest in stocks of small-cap and mid-cap companies. The fund employs a fundamental analysis with a bottom-up stock picking approach to create its portfolio. It was formerly known as RENN Global Entrepreneurs Fund, Inc. RENN Fund, Inc. was formed on January 20, 1994 and is domiciled in the United States. |
| Insider Trading |
Relationship |
Date |
Transaction |
Cost |
#Shares |
Value ($) |
#Shares Total |
SEC Form 4 |
| STAHL MURRAY | President and CEO | Apr 29 '24 | Buy | 1.66 | 55 | 91 | 247,570 | Apr 30 10:31 AM | | STAHL MURRAY | President and CEO | Apr 29 '24 | Buy | 1.66 | 4 | 7 | 5,025 | Apr 30 10:31 AM | | STAHL MURRAY | President and CEO | Apr 26 '24 | Buy | 1.60 | 55 | 88 | 247,546 | Apr 29 11:40 AM | | STAHL MURRAY | President and CEO | Apr 26 '24 | Buy | 1.60 | 2 | 3 | 5,021 | Apr 29 11:40 AM | | STAHL MURRAY | President and CEO | Apr 25 '24 | Buy | 1.64 | 55 | 90 | 247,522 | Apr 26 11:04 AM |
|
|
|
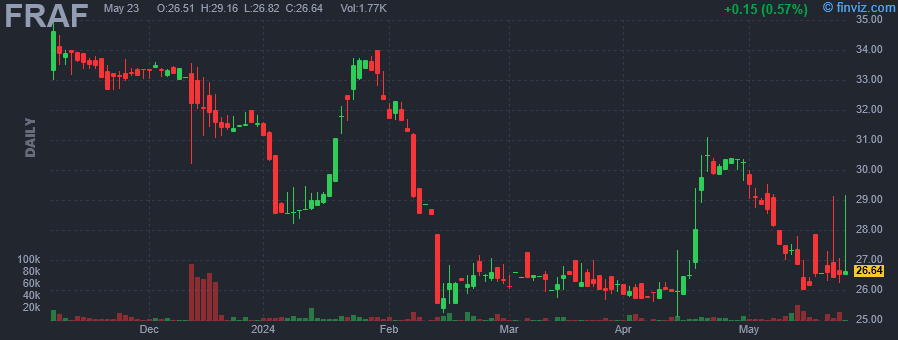 |
| Market Cap | 132.89M | EPS (ttm) | 3.13 |
| P/E | 9.68 | EPS this Y | - |
| Forward P/E | - | EPS next Y | - |
| PEG | - | EPS past 5Y | 17.42% |
| P/S | 1.33 | EPS next 5Y | - |
| P/B | 0.99 | EPS Q/Q | 3.31% |
| Dividend | 4.23% | Sales Q/Q | 41.16% |
| Insider Own | 6.16% | Inst Own | 24.39% |
| Insider Trans | 0.02% | Inst Trans | - |
| Short Float | 0.19% | Earnings | Jan 30/a |
| Analyst Recom | - | Target Price | - |
| Avg Volume | 4.37K | 52W Range | 23.96 - 35.00 |
|
|
|
|
Franklin Financial Services Corp. is a bank holding company, which engages in financial services and offers traditional banking. It offers commercial and retail financial services, including the taking of time, savings and demand deposits, the making of commercial, consumer and mortgage loans, and the providing of safe deposit services. The company was founded on June 1, 1983 and is headquartered in Chambersburg, PA. |
| Insider Trading |
Relationship |
Date |
Transaction |
Cost |
#Shares |
Value ($) |
#Shares Total |
SEC Form 4 |
| Carroll Charles Benner Jr | COO | Apr 29 '24 | Buy | 30.36 | 50 | 1,518 | 2,550 | Apr 30 09:32 AM | | Hollar Mark R | CFO | Dec 19 '23 | Option Exercise | 26.35 | 150 | 3,952 | 9,985 | Dec 20 02:45 PM | | Carmack Karen K | SVP | Sep 20 '23 | Buy | 28.48 | 1 | 28 | 2,528 | Sep 21 11:22 AM | | Carroll Charles Benner Jr | COO | Sep 01 '23 | Buy | 29.00 | 300 | 8,700 | 1,200 | Sep 01 03:21 PM | | Duffey Gregory A | Director | Aug 30 '23 | Buy | 28.66 | 35 | 1,003 | 14,772 | Sep 01 10:04 AM |
|
|
| |
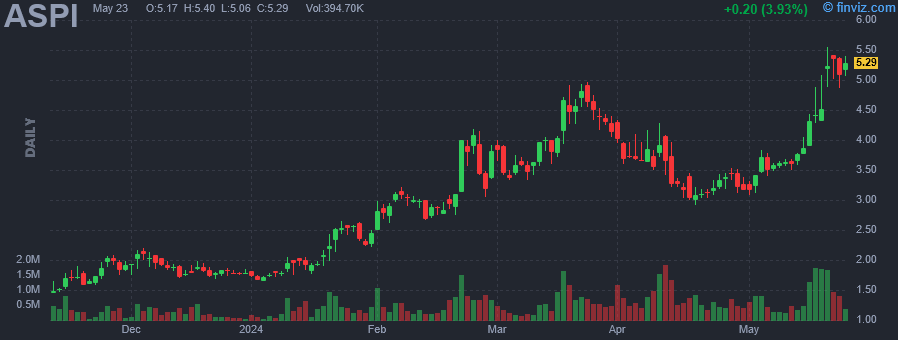 |
| Market Cap | 155.08M | EPS (ttm) | -0.49 |
| P/E | - | EPS this Y | 77.55% |
| Forward P/E | - | EPS next Y | 36.36% |
| PEG | - | EPS past 5Y | - |
| P/S | 360.64 | EPS next 5Y | - |
| P/B | 9.52 | EPS Q/Q | -141.87% |
| Dividend | - | Sales Q/Q | - |
| Insider Own | 53.59% | Inst Own | 3.33% |
| Insider Trans | 1.30% | Inst Trans | - |
| Short Float | 3.18% | Earnings | - |
| Analyst Recom | 1.00 | Target Price | 5.50 |
| Avg Volume | 647.11K | 52W Range | 0.28 - 4.97 |
|
|
|
|
ASP Isotopes, Inc. is a pre-commercial stage advanced materials company, which engages in the development of technology and processes that will allow for the enrichment of natural isotopes into higher concentration products. Its products include medical, green energy, and Industrial isotopes. The company was founded by Paul E. Mann and Robert Ainscow on September 13, 2021 and is headquartered in Washington, DC. |
| Insider Trading |
Relationship |
Date |
Transaction |
Cost |
#Shares |
Value ($) |
#Shares Total |
SEC Form 4 |
| Ryan Robert John Andrew | Director | Apr 26 '24 | Buy | 3.48 | 5,000 | 17,400 | 551,555 | Apr 30 07:49 AM | | Ryan Robert John Andrew | Director | Apr 25 '24 | Buy | 3.42 | 9,500 | 32,450 | 546,555 | Apr 29 09:04 PM | | Ryan Robert John Andrew | Director | Jan 29 '24 | Buy | 2.35 | 15,596 | 36,651 | 537,055 | Feb 26 07:27 AM | | Ryan Robert John Andrew | Director | Jan 25 '24 | Buy | 2.54 | 100 | 254 | 521,459 | Feb 26 07:27 AM | | Ryan Robert John Andrew | Director | Jan 17 '24 | Buy | 1.91 | 100 | 191 | 521,359 | Feb 26 07:27 AM |
|
|
|
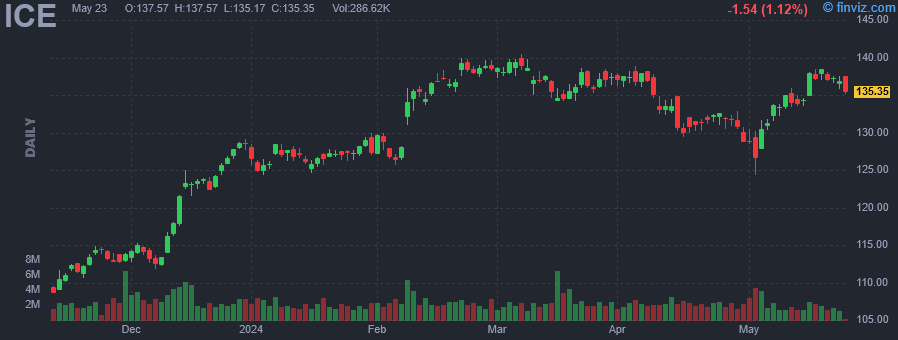 |
| Market Cap | 73.73B | EPS (ttm) | 4.20 |
| P/E | 30.66 | EPS this Y | 6.03% |
| Forward P/E | 19.34 | EPS next Y | 11.74% |
| PEG | 3.15 | EPS past 5Y | 4.09% |
| P/S | 7.67 | EPS next 5Y | 9.72% |
| P/B | 2.87 | EPS Q/Q | -14.38% |
| Dividend | 1.40% | Sales Q/Q | 17.83% |
| Insider Own | 0.85% | Inst Own | 91.58% |
| Insider Trans | -9.18% | Inst Trans | -1.04% |
| Short Float | 0.85% | Earnings | May 02/b |
| Analyst Recom | 1.60 | Target Price | 154.31 |
| Avg Volume | 2.45M | 52W Range | 103.81 - 140.43 |
|
|
|
|
Intercontinental Exchange, Inc. engages in the provision of market infrastructure, data services and technology solutions. It operates through the following segments: Exchanges, Fixed Income and Data Services, and Mortgage Technology. The Exchanges segment includes trading and listing revenue from the global futures network, the New York Stock Exchange and other registered securities exchanges. The Fixed Income and Data Services segment is composed of fixed income data and analytics offerings, fixed income execution, credit default swap clearing and other multi-asset class data and network services. The Mortgage Technology segment provides an end-to-end network aimed at identifying and solving the inefficiencies that exist in the U.S. residential mortgage market. The company was founded by Jeffrey C. Sprecher in 2000 and is headquartered in Atlanta, GA. |
| Insider Trading |
Relationship |
Date |
Transaction |
Cost |
#Shares |
Value ($) |
#Shares Total |
SEC Form 4 |
| Surdykowski Andrew J | General Counsel | Apr 26 '24 | Sale | 131.74 | 341 | 44,923 | 48,713 | Apr 30 04:30 PM | | Intercontinental Exchange, Inc | 10% Owner | Apr 25 '24 | Buy | 0.87 | 350,880 | 304,213 | 649,934 | Apr 29 09:11 PM | | Sprecher Jeffrey C | Chief Executive Officer | Apr 03 '24 | Option Exercise | 50.01 | 58,388 | 2,919,984 | 1,238,283 | Apr 05 04:30 PM | | Sprecher Jeffrey C | Chief Executive Officer | Apr 03 '24 | Sale | 137.21 | 110,000 | 15,093,323 | 2,661,705 | Apr 05 04:30 PM | | Sprecher Jeffrey C | Chief Executive Officer | Apr 03 '24 | Sale | 137.21 | 58,388 | 8,011,519 | 1,179,895 | Apr 05 04:30 PM |
|
|
| |
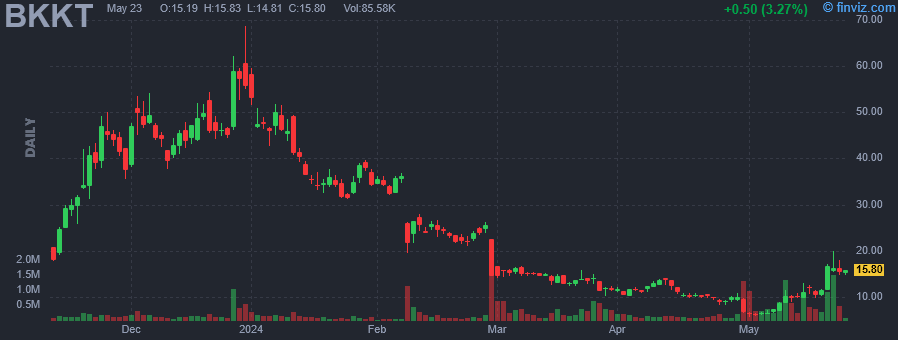 |
| Market Cap | 39.05M | EPS (ttm) | -16.48 |
| P/E | - | EPS this Y | 66.67% |
| Forward P/E | - | EPS next Y | 30.95% |
| PEG | - | EPS past 5Y | - |
| P/S | 0.05 | EPS next 5Y | - |
| P/B | 0.53 | EPS Q/Q | 76.12% |
| Dividend | - | Sales Q/Q | 1275.09% |
| Insider Own | - | Inst Own | - |
| Insider Trans | 0.10% | Inst Trans | 1.70% |
| Short Float | - | Earnings | Mar 25/a |
| Analyst Recom | 2.00 | Target Price | 31.25 |
| Avg Volume | 247.08K | 52W Range | 8.27 - 68.75 |
|
|
|
|
Bakkt Holdings, Inc. engages in the intersection of cryptoassets, loyalty and rewards, and payments. It also provides a platform to expand payment offerings, create new revenue streams, and increase customer loyalty. The company was founded in 2018 and is headquartered in Alpharetta, GA. |
| Insider Trading |
Relationship |
Date |
Transaction |
Cost |
#Shares |
Value ($) |
#Shares Total |
SEC Form 4 |
| Intercontinental Exchange, Inc | 10% Owner | Apr 25 '24 | Buy | 0.87 | 350,880 | 304,213 | 649,934 | Apr 29 09:11 PM | | Intercontinental Exchange, Inc | 10% Owner | Mar 04 '24 | Buy | 0.87 | 2,762,009 | 2,394,662 | 7,476,345 | Mar 04 05:34 PM | | D'Annunzio Marc | General Counsel & Secretary | Feb 23 '24 | Sale | 0.88 | 50,247 | 44,047 | 566,630 | Feb 26 09:28 PM | | D'Annunzio Marc | General Counsel & Secretary | Feb 08 '24 | Sale | 0.98 | 19,329 | 18,927 | 638,157 | Feb 09 09:13 PM | | D'Annunzio Marc | General Counsel & Secretary | Jan 25 '24 | Sale | 1.27 | 42,807 | 54,249 | 667,320 | Jan 29 07:19 PM |
|
|
|
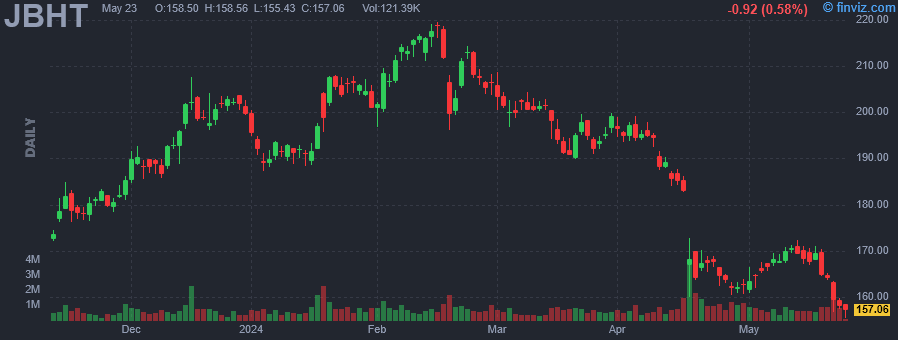 |
| Market Cap | 16.78B | EPS (ttm) | 6.31 |
| P/E | 25.77 | EPS this Y | -7.58% |
| Forward P/E | 19.27 | EPS next Y | 30.96% |
| PEG | 2.39 | EPS past 5Y | 9.50% |
| P/S | 1.34 | EPS next 5Y | 10.80% |
| P/B | 4.03 | EPS Q/Q | -35.15% |
| Dividend | 0.94% | Sales Q/Q | -8.84% |
| Insider Own | 19.95% | Inst Own | 75.87% |
| Insider Trans | -0.11% | Inst Trans | -3.43% |
| Short Float | 2.75% | Earnings | Apr 16/a |
| Analyst Recom | 1.96 | Target Price | 192.67 |
| Avg Volume | 846.95K | 52W Range | 160.07 - 219.51 |
|
|
|
|
J.B. Hunt Transport Services, Inc. engages in the provision of logistics solutions. It operates through the following segments: Intermodal (JBI), Dedicated Contract Services (DCS), Integrated Capacity Solutions (ICS), Final Mile Services (FMS) and Truckload (JBT). The JBI segment offers intermodal freight operations for rail carriers. The DCS segment includes private fleet conversion and final-mile delivery services. The ICS segment provides single-source logistics management for clients who intend to outsource their transportation activities. It offers flatbed, refrigerated, expedited, less-than-truckload, dry-van, and intermodal freight services. The FMS segment provides final-mile delivery services to customers through a nationwide network of cross-dock and other delivery system network locations. The JBT segment is responsible for full-load, dry-van freight that is transported via roads and highways. The company was founded by Johnnie Bryan Hunt, Sr. and Johnelle D. Hunt on August 10, 1961, and is headquartered in Lowell, AR. |
| Insider Trading |
Relationship |
Date |
Transaction |
Cost |
#Shares |
Value ($) |
#Shares Total |
SEC Form 4 |
| ROBERTS JOHN N | CEO | Apr 26 '24 | Buy | 161.06 | 6,200 | 998,550 | 313,955 | Apr 29 08:51 PM | | Simpson Shelley | President | Mar 31 '24 | Option Exercise | 0.00 | 4,558 | 0 | 90,286 | Apr 02 03:24 PM | | Scott Stuart Lockard | EVP/CIO | Mar 31 '24 | Option Exercise | 0.00 | 3,472 | 0 | 37,371 | Apr 02 03:24 PM | | ROBERTS JOHN N | CEO | Mar 31 '24 | Option Exercise | 0.00 | 13,479 | 0 | 313,733 | Apr 02 03:23 PM | | McGee Eric | EVP Highway Services | Mar 31 '24 | Option Exercise | 0.00 | 868 | 0 | 1,332 | Apr 02 03:23 PM |
|
|
|
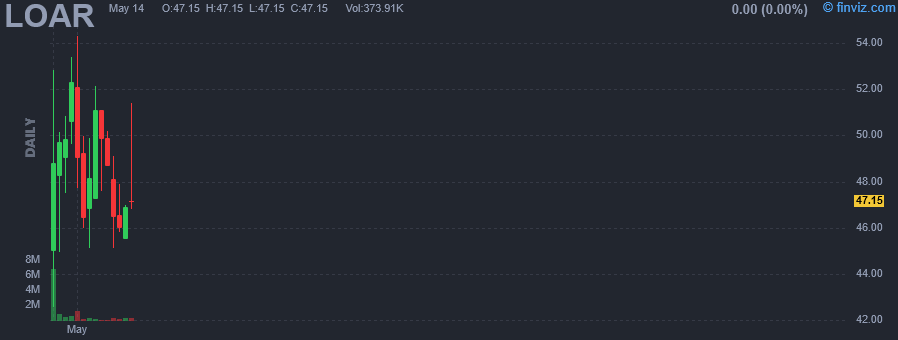 |
| Market Cap | 4.60B | EPS (ttm) | -0.05 |
| P/E | - | EPS this Y | - |
| Forward P/E | - | EPS next Y | - |
| PEG | - | EPS past 5Y | - |
| P/S | 14.50 | EPS next 5Y | - |
| P/B | 11.01 | EPS Q/Q | 81.10% |
| Dividend | - | Sales Q/Q | 24.79% |
| Insider Own | 17.02% | Inst Own | 43.68% |
| Insider Trans | 1.45% | Inst Trans | - |
| Short Float | - | Earnings | - |
| Analyst Recom | - | Target Price | - |
| Avg Volume | 2.77M | 52W Range | 42.57 - 52.85 |
|
|
|
|
Loar Holdings, Inc. engages in the designs, manufactures, and sale of niche aerospace and defense components for aircraft, aerospace and defense systems. The Company was founded on August 21, 2017 and is headquartered in White Plains, NY. |
| Insider Trading |
Relationship |
Date |
Transaction |
Cost |
#Shares |
Value ($) |
#Shares Total |
SEC Form 4 |
| McGetrick Margaret A | Director | Apr 29 '24 | Buy | 28.00 | 71,429 | 2,000,012 | 89,286 | Apr 29 04:54 PM | | CROW M CHAD | Director | Apr 29 '24 | Buy | 28.00 | 71,429 | 2,000,012 | 89,286 | Apr 29 04:55 PM | | Danmola Taiwo K. | Director | Apr 29 '24 | Buy | 28.00 | 71,429 | 2,000,012 | 89,286 | Apr 29 04:54 PM |
|
|
|
