 |
| Market Cap | 1.27B | EPS (ttm) | 5.92 |
| P/E | 8.02 | EPS this Y | -13.42% |
| Forward P/E | 9.75 | EPS next Y | -7.24% |
| PEG | 2.67 | EPS past 5Y | 17.76% |
| P/S | 3.88 | EPS next 5Y | 3.00% |
| P/B | 1.60 | EPS Q/Q | -9.33% |
| Dividend | 3.72% | Sales Q/Q | -1.66% |
| Insider Own | 4.66% | Inst Own | 76.76% |
| Insider Trans | -7.51% | Inst Trans | -1.69% |
| Short Float | 1.28% | Earnings | Apr 18/b |
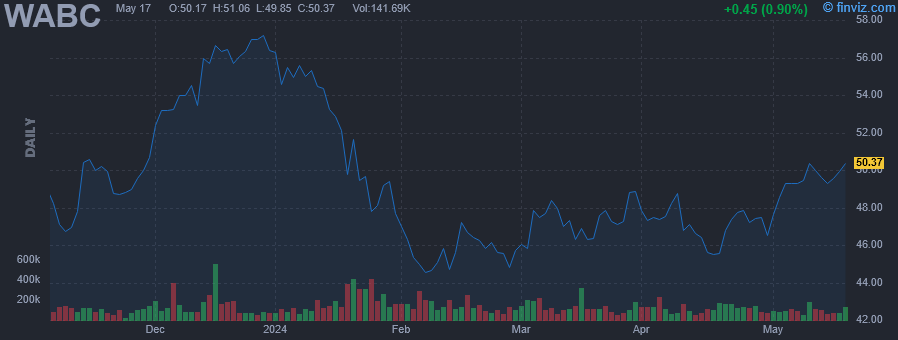
| Analyst Recom | 2.33 | Target Price | 56.00 |
| Avg Volume | 145.45K | 52W Range | 35.52 - 57.96 |
|
|
|
|
Westamerica Bancorporation operates as a bank holding company. It provides range of banking services to individual and corporate customers in Northern and Central California. It offers loans and lines of credit, online services, mobile banking, checking, savings, credit cards, cash management, overdraft services, merchant services, professional banking, bank owned property, preventing business loans, payroll services, and trust services. The company was founded in 1972 and is headquartered in San Rafael, CA. |
| Insider Trading |
Relationship |
Date |
Transaction |
Cost |
#Shares |
Value ($) |
#Shares Total |
SEC Form 4 |
| Belew Alisa Jane | Director | Apr 23 '24 | Buy | 47.80 | 208 | 9,943 | 208 | Apr 24 03:04 PM | | THORSON JOHN A | SVP/CFO | Apr 22 '24 | Sale | 47.24 | 1,100 | 51,964 | 0 | Apr 24 03:24 PM | | PAYNE DAVID L | Chairman, President & CEO | Feb 01 '24 | Sale | 46.79 | 11,272 | 527,413 | 242,417 | Feb 01 08:25 PM | | PAYNE DAVID L | Chairman, President & CEO | Jan 31 '24 | Sale | 49.00 | 15,000 | 735,000 | 253,689 | Feb 01 08:25 PM | | PAYNE DAVID L | Chairman, President & CEO | Jan 30 '24 | Sale | 49.51 | 10,000 | 495,133 | 268,689 | Jan 30 07:32 PM |
|
|
 |
 |
| Market Cap | 768.37M | EPS (ttm) | 4.32 |
| P/E | 9.88 | EPS this Y | -3.90% |
| Forward P/E | 9.84 | EPS next Y | 3.42% |
| PEG | 1.98 | EPS past 5Y | 5.43% |
| P/S | 2.25 | EPS next 5Y | 5.00% |
| P/B | 1.09 | EPS Q/Q | -3.69% |
| Dividend | 4.35% | Sales Q/Q | 22.12% |
| Insider Own | 3.41% | Inst Own | 59.75% |
| Insider Trans | 1.72% | Inst Trans | -1.00% |
| Short Float | 0.71% | Earnings | Apr 17/b |
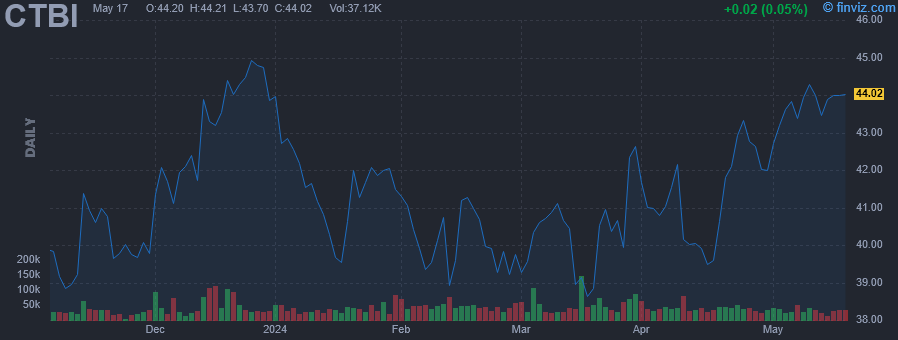
| Analyst Recom | 1.67 | Target Price | 48.00 |
| Avg Volume | 50.36K | 52W Range | 32.68 - 45.74 |
|
|
|
|
Community Trust Bancorp, Inc. is a bank holding company, which engages in the provision of community banking services through its subsidiary Community Trust Bank, Inc. It offers commercial & personal banking and trust and wealth management activities, which include accepting time and demand deposits, making secured and unsecured loans to corporations, individuals and others, providing cash management services to corporate and individual customers, issuing letters of credit, renting safe deposit boxes, and providing funds transfer services. The company was founded on August 12, 1980 and is headquartered in Pikeville, KY. |
| Insider Trading |
Relationship |
Date |
Transaction |
Cost |
#Shares |
Value ($) |
#Shares Total |
SEC Form 4 |
| NEWSOM RICHARD W | President | Apr 01 '24 | Buy | 42.10 | 92 | 3,869 | 6,128 | Apr 24 02:11 PM | | MINNIFIELD FRANKY | Board of Director | Mar 15 '24 | Buy | 39.28 | 2,000 | 78,560 | 14,401 | Mar 15 03:39 PM | | Sandlin Jefferson F | Director | Feb 13 '24 | Buy | 39.07 | 510 | 19,924 | 510 | Feb 14 10:17 AM | | GOOCH MARK A | President & CEO | Jan 26 '24 | Buy | 41.86 | 339 | 14,191 | 28,072 | Jan 29 10:06 AM | | STUMBO KEVIN J | EVP, CFO, & Treasurer | Jan 26 '24 | Buy | 41.86 | 186 | 7,786 | 3,101 | Jan 29 11:41 AM |
|
|
|
 |
| Market Cap | 4.94M | EPS (ttm) | -1.87 |
| P/E | - | EPS this Y | 35.56% |
| Forward P/E | - | EPS next Y | 0.34% |
| PEG | - | EPS past 5Y | -69.45% |
| P/S | - | EPS next 5Y | - |
| P/B | - | EPS Q/Q | 54.40% |
| Dividend | - | Sales Q/Q | - |
| Insider Own | 29.68% | Inst Own | 5.45% |
| Insider Trans | 0.45% | Inst Trans | - |
| Short Float | 0.30% | Earnings | - |
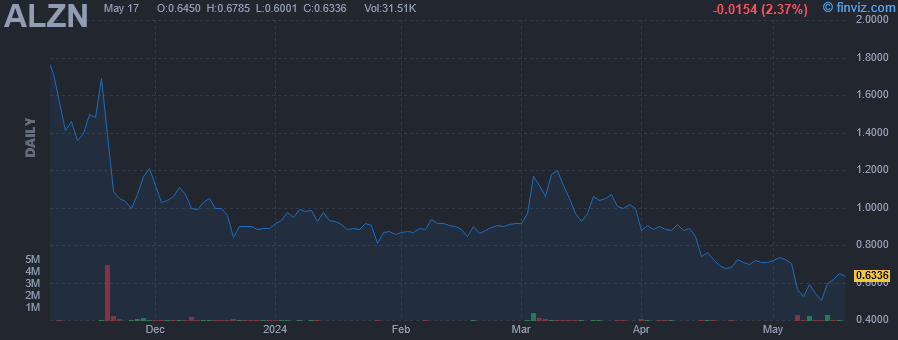
| Analyst Recom | 2.00 | Target Price | 21.00 |
| Avg Volume | 56.49K | 52W Range | 0.65 - 11.91 |
|
|
|
|
Alzamend Neuro, Inc. is an early clinical-stage biopharmaceutical company, which focuses on developing various products for the treatment of neurodegenerative and psychiatric disorders. The company's pipeline includes AL001, which is in Phase II clinical trial, and delivers a therapeutic combination of lithium, proline, and salicylate for the treatment of Alzheimer's, bipolar disorder, post-traumatic stress disorder, major depressive disorder, other neurodegenerative diseases, and psychiatric disorders, and AL002, which completed preclinical stage, and uses a method using a mutant-peptide sensitized cell as a cell-based therapeutic vaccine to restore the ability of a patient's immunological system to combat Alzheimer's disease. The company was founded on February 26, 2016 by Milton C. Ault, III and is headquartered in Atlanta, GA. |
| Insider Trading |
Relationship |
Date |
Transaction |
Cost |
#Shares |
Value ($) |
#Shares Total |
SEC Form 4 |
| AULT MILTON C III | Director | Apr 19 '24 | Buy | 0.69 | 1,000 | 688 | 771,699 | Apr 23 08:00 PM | | AULT MILTON C III | Director | Apr 01 '24 | Buy | 0.91 | 334 | 304 | 770,699 | Apr 03 05:00 PM | | AULT MILTON C III | Director | Jan 05 '24 | Buy | 1.02 | 5,000 | 5,092 | 768,365 | Jan 09 04:30 PM | | AULT MILTON C III | Director | Jan 05 '24 | Buy | 1.06 | 2,000 | 2,127 | 770,365 | Apr 01 04:30 PM | | AULT MILTON C III | 10% Owner | Dec 26 '23 | Buy | 0.90 | 500 | 450 | 26,032 | Dec 27 04:30 PM |
|
|
| |
 |
| Market Cap | 338.30M | EPS (ttm) | 1.41 |
| P/E | 15.52 | EPS this Y | -10.34% |
| Forward P/E | 11.21 | EPS next Y | 49.85% |
| PEG | 0.52 | EPS past 5Y | - |
| P/S | 0.48 | EPS next 5Y | 30.00% |
| P/B | 1.56 | EPS Q/Q | 7.62% |
| Dividend | - | Sales Q/Q | 4.88% |
| Insider Own | 13.12% | Inst Own | 91.45% |
| Insider Trans | 8.70% | Inst Trans | -5.63% |
| Short Float | 26.89% | Earnings | Apr 11/b |
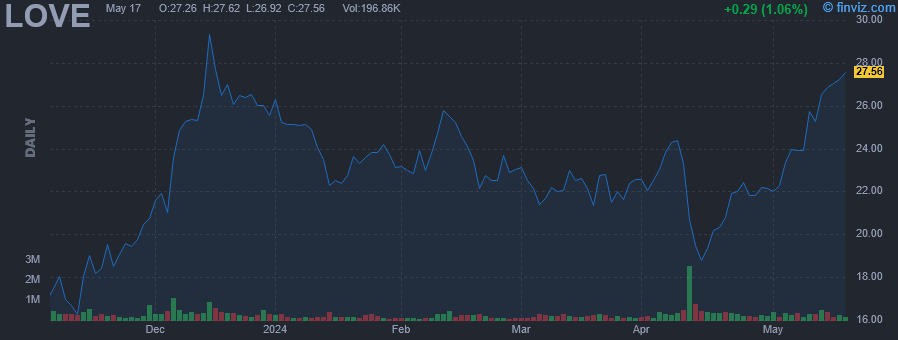
| Analyst Recom | 1.00 | Target Price | 31.20 |
| Avg Volume | 311.02K | 52W Range | 14.18 - 29.81 |
|
|
|
|
The Lovesac Co. is a technology driven, omni-channel company. It designs, manufactures, and sells furniture comprised of modular couches called sactionals and foam beanbag chairs called sacs. Its products include sactionals, sacs, and accessories. The company was founded by Shawn David Nelson in 1995 and is headquartered in Stamford, CT. |
| Insider Trading |
Relationship |
Date |
Transaction |
Cost |
#Shares |
Value ($) |
#Shares Total |
SEC Form 4 |
| Siegner Keith R. | EVP and CFO | Apr 19 '24 | Buy | 20.80 | 4,800 | 99,864 | 4,800 | Apr 23 06:13 PM | | HEYER ANDREW R | Director | Apr 17 '24 | Buy | 20.23 | 8,144 | 164,755 | 37,282 | Apr 18 08:51 PM | | HEYER ANDREW R | Director | Apr 17 '24 | Buy | 20.23 | 6,226 | 125,952 | 241,518 | Apr 18 08:51 PM | | HEYER ANDREW R | Director | Apr 16 '24 | Buy | 18.76 | 3,856 | 72,330 | 3,856 | Apr 18 08:51 PM | | HEYER ANDREW R | Director | Apr 16 '24 | Buy | 18.74 | 3,774 | 70,709 | 235,292 | Apr 18 08:51 PM |
|
|
|
 |
| Market Cap | 140.63M | EPS (ttm) | 0.18 |
| P/E | 56.34 | EPS this Y | -93.53% |
| Forward P/E | 19.99 | EPS next Y | 455.56% |
| PEG | 2.82 | EPS past 5Y | 34.54% |
| P/S | 0.68 | EPS next 5Y | 20.00% |
| P/B | 0.89 | EPS Q/Q | -87.98% |
| Dividend | 2.40% | Sales Q/Q | -25.57% |
| Insider Own | 15.73% | Inst Own | 57.84% |
| Insider Trans | 0.91% | Inst Trans | 23.10% |
| Short Float | 6.06% | Earnings | Apr 10/a |
| Analyst Recom | 5.00 | Target Price | 20.00 |
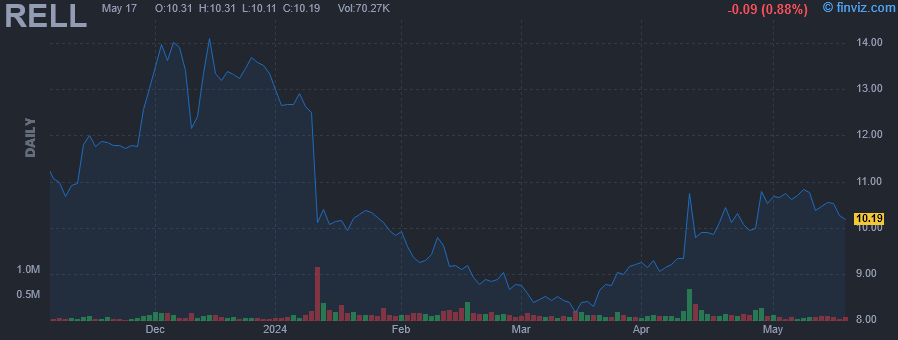
| Avg Volume | 144.05K | 52W Range | 8.08 - 19.58 |
|
|
|
|
Richardson Electronics Ltd. engages in the provision of engineered solutions. It operates through the following segments: Power and Microwave Technologies Group (PMT), Green Energy Solutions GES), Canvys, and Healthcare. The PMT segment provides engineering solutions capabilities, power grid, and microwave tube business. The GES segment focuses on products for numerous green energy applications. The Canvys segment offers customized display solutions serving the corporate enterprise, financial, healthcare, industrial, and medical original equipment manufacturers markets. The Healthcare segment manufactures, refurbishes, and distributes replacement parts for the healthcare market including hospitals, medical centers, asset management companies, independent service organizations, and multi-vendor service providers. The company was founded on May 31, 1947 and is headquartered in LaFox, IL. |
| Insider Trading |
Relationship |
Date |
Transaction |
Cost |
#Shares |
Value ($) |
#Shares Total |
SEC Form 4 |
| Halverson Kenneth | Director | Apr 22 '24 | Buy | 10.05 | 2,500 | 25,122 | 5,000 | Apr 23 03:50 PM | | PLANTE PAUL J | Director | Apr 17 '24 | Buy | 9.96 | 5,000 | 49,800 | 5,000 | Apr 18 09:07 AM | | Benham James | Director | Apr 16 '24 | Buy | 10.01 | 2,500 | 25,031 | 5,000 | Apr 18 09:03 AM | | Benham James | Director | Jan 30 '24 | Buy | 9.99 | 2,500 | 24,975 | 2,500 | Feb 01 09:21 AM | | Halverson Kenneth | Director | Jan 29 '24 | Buy | 10.06 | 2,500 | 25,162 | 2,500 | Jan 31 09:06 AM |
|
|
| |
 |
| Market Cap | 4.93B | EPS (ttm) | 1.24 |
| P/E | 11.12 | EPS this Y | -10.05% |
| Forward P/E | 8.89 | EPS next Y | 9.44% |
| PEG | 1.11 | EPS past 5Y | 3.24% |
| P/S | 2.10 | EPS next 5Y | 10.00% |
| P/B | 0.82 | EPS Q/Q | -19.46% |
| Dividend | 3.49% | Sales Q/Q | 20.72% |
| Insider Own | 1.32% | Inst Own | 79.67% |
| Insider Trans | 0.14% | Inst Trans | 1.26% |
| Short Float | 2.80% | Earnings | Apr 17/a |
| Analyst Recom | 1.56 | Target Price | 15.67 |
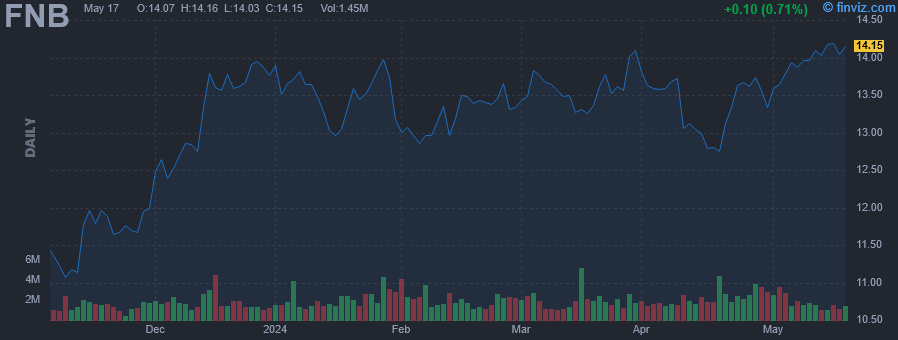
| Avg Volume | 2.18M | 52W Range | 10.09 - 14.19 |
|
|
|
|
F.N.B. Corp. is a financial holding company, which engages in the provision of financial services to consumers, corporations, governments, and small to medium-sized businesses. It operates through the following segments: Community Banking, Wealth Management, Insurance, and Other. The Community Banking segment includes commercial and consumer banking services. The Wealth Management segment delivers wealth management services to individuals, corporations and retirement funds, as well as existing customers of community banking. The Insurance segment is a full-service insurance brokerage agency offering lines of commercial and personal insurance through major carriers. The Other segment offers mezzanine financing options for small to medium-sized businesses that need financial assistance beyond the parameters of typical commercial bank lending products. The company was founded in 1974 and is headquartered in Pittsburgh, PA. |
| Insider Trading |
Relationship |
Date |
Transaction |
Cost |
#Shares |
Value ($) |
#Shares Total |
SEC Form 4 |
| CAMPBELL WILLIAM B | Director | Apr 23 '24 | Buy | 13.48 | 2,500 | 33,712 | 149,458 | Apr 23 01:24 PM | | CAMPBELL WILLIAM B | Director | Feb 28 '24 | Buy | 13.52 | 1,500 | 20,274 | 146,888 | Feb 28 04:28 PM | | CAMPBELL WILLIAM B | Director | Feb 26 '24 | Buy | 13.41 | 2,500 | 33,522 | 145,388 | Feb 26 02:05 PM |
|
|
|
 |
| Market Cap | 85.44M | EPS (ttm) | -0.79 |
| P/E | - | EPS this Y | 36.08% |
| Forward P/E | - | EPS next Y | - |
| PEG | - | EPS past 5Y | 1.93% |
| P/S | 7.04 | EPS next 5Y | 20.00% |
| P/B | 1.06 | EPS Q/Q | -80.81% |
| Dividend | - | Sales Q/Q | -63.19% |
| Insider Own | 7.36% | Inst Own | 37.70% |
| Insider Trans | 1.05% | Inst Trans | -1.34% |
| Short Float | 17.93% | Earnings | Apr 15/a |
| Analyst Recom | 2.00 | Target Price | 3.00 |
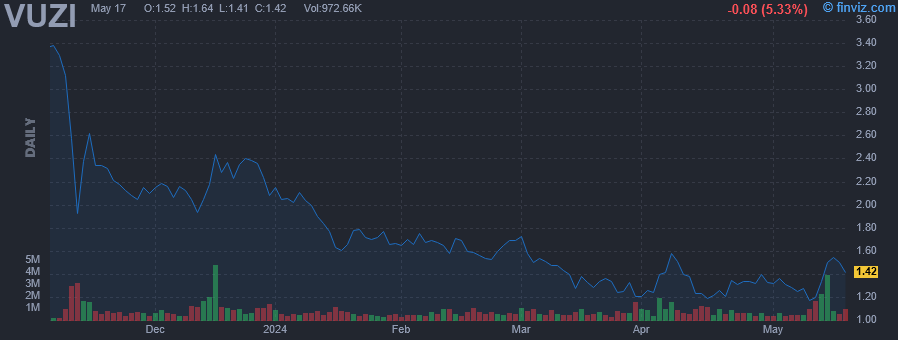
| Avg Volume | 738.84K | 52W Range | 1.10 - 6.06 |
|
|
|
|
Vuzix Corp. is a supplier of Smart-Glasses and Augmented Reality technologies and products for the consumer and enterprise markets. Its products include personal display and wearable computing devices that offer users a portable viewing experience, provide solutions for mobility, wearable displays and augmented reality. The firm also holds 246 patents and patents pending and numerous IP licenses in the Video Eyewear field. It has offices in Rochester, NY, Oxford, UK, and Tokyo, Japan. The company was founded by Paul J. Travers in 1997 and is headquartered in West Henrietta, NY. |
| Insider Trading |
Relationship |
Date |
Transaction |
Cost |
#Shares |
Value ($) |
#Shares Total |
SEC Form 4 |
| Harned Timothy Heydenreich | Director | Apr 22 '24 | Buy | 1.31 | 20,000 | 26,188 | 186,016 | Apr 23 11:54 AM | | Travers Paul J | President and CEO | Apr 22 '24 | Buy | 1.25 | 14,500 | 18,163 | 2,859,670 | Apr 22 12:40 PM | | Travers Paul J | President and CEO | Apr 18 '24 | Buy | 1.34 | 7,500 | 10,062 | 2,845,170 | Apr 18 01:50 PM | | Travers Paul J | President and CEO | Nov 15 '23 | Buy | 2.57 | 7,500 | 19,274 | 2,837,670 | Nov 17 09:35 AM | | Kay Edward William Jr. | Director | Aug 16 '23 | Buy | 4.23 | 10,000 | 42,300 | 206,843 | Aug 17 12:10 PM |
|
|
| |
 |
| Market Cap | 269.14M | EPS (ttm) | 2.08 |
| P/E | 8.76 | EPS this Y | - |
| Forward P/E | - | EPS next Y | - |
| PEG | - | EPS past 5Y | - |
| P/S | 23.18 | EPS next 5Y | - |
| P/B | 0.86 | EPS Q/Q | 635.10% |
| Dividend | 4.02% | Sales Q/Q | 5.30% |
| Insider Own | 2.78% | Inst Own | 54.70% |
| Insider Trans | 0.98% | Inst Trans | - |
| Short Float | 0.04% | Earnings | - |
| Analyst Recom | - | Target Price | - |
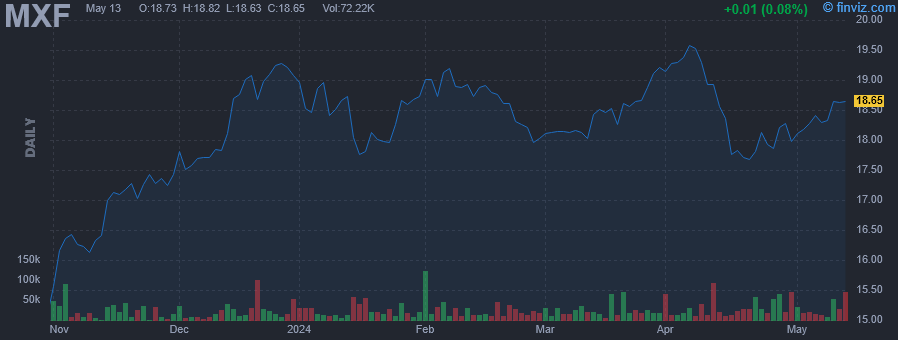
| Avg Volume | 29.01K | 52W Range | 14.77 - 19.69 |
|
|
|
Apr-25-24 09:00AM
|
THE MEXICO FUND, INC. PAYS DISTRIBUTION
(PR Newswire) |
|
Mar-08-24 09:00AM
|
THE MEXICO FUND, INC. DECLARES DISTRIBUTION
(PR Newswire) |
|
09:00AM
|
THE MEXICO FUND, INC. ANNOUNCES RESULTS OF ITS ANNUAL MEETING OF STOCKHOLDERS
(PR Newswire) |
|
Jan-25-24 09:00AM
|
THE MEXICO FUND, INC. PAYS DISTRIBUTION
(PR Newswire) |
|
Dec-28-23 09:00AM
|
THE MEXICO FUND, INC. ISSUES ITS 2023 ANNUAL REPORT
(PR Newswire) |
|
Dec-14-23 09:00AM
|
THE MEXICO FUND, INC. ANNOUNCES AN INCREASE IN ITS QUARTERLY DISTRIBUTION AND DECLARES DISTRIBUTION
(PR Newswire) |
|
Oct-26-23 09:00AM
|
THE MEXICO FUND, INC. PAYS DISTRIBUTION
(PR Newswire) |
|
Sep-14-23 09:00AM
|
THE MEXICO FUND, INC. DECLARES DISTRIBUTION
(PR Newswire) |
|
Jul-27-23 09:00AM
|
THE MEXICO FUND, INC. PAYS DISTRIBUTION
(PR Newswire) |
|
Jun-27-23 01:00PM
|
THE MEXICO FUND, INC. ISSUES ITS 2023 SEMI-ANNUAL REPORT
(PR Newswire) |
|
The Mexico Fund, Inc. is a closed-ended equity mutual fund launched and managed by Impulsora del Fondo Mexico, S.C. It primarily invests in public equity markets of Mexico. The fund seeks to invest its portfolio across diversified sectors. The Mexico Fund, Inc. was formed in June 01, 1981 and is domiciled in Maryland, United States. |
| Insider Trading |
Relationship |
Date |
Transaction |
Cost |
#Shares |
Value ($) |
#Shares Total |
SEC Form 4 |
| Vaughan Richard B. | Director | Apr 22 '24 | Buy | 17.69 | 4,000 | 70,760 | 5,000 | Apr 23 10:45 AM |
|
|
|
 |
| Market Cap | 349.97M | EPS (ttm) | 3.26 |
| P/E | 6.30 | EPS this Y | -70.07% |
| Forward P/E | 8.83 | EPS next Y | 45.32% |
| PEG | 0.63 | EPS past 5Y | 19.42% |
| P/S | 0.65 | EPS next 5Y | 10.00% |
| P/B | 1.81 | EPS Q/Q | -68.90% |
| Dividend | - | Sales Q/Q | -37.51% |
| Insider Own | 3.58% | Inst Own | 97.61% |
| Insider Trans | 134.27% | Inst Trans | 1.60% |
| Short Float | 4.17% | Earnings | May 08/b |
| Analyst Recom | 2.43 | Target Price | 23.50 |
| Avg Volume | 130.50K | 52W Range | 19.22 - 31.70 |
|
|
|
Apr-23-24 04:05PM
|
Crest Marine Expands Portfolio with the Launch of Balise Pontoon Boats
(GlobeNewswire) |
|
Apr-19-24 10:04AM
|
MasterCraft Boat Holdings, Inc. to Webcast Fiscal Third Quarter 2024 Earnings Conference Call Wednesday, May 8, 2024
(GlobeNewswire) |
|
Apr-17-24 03:45AM
|
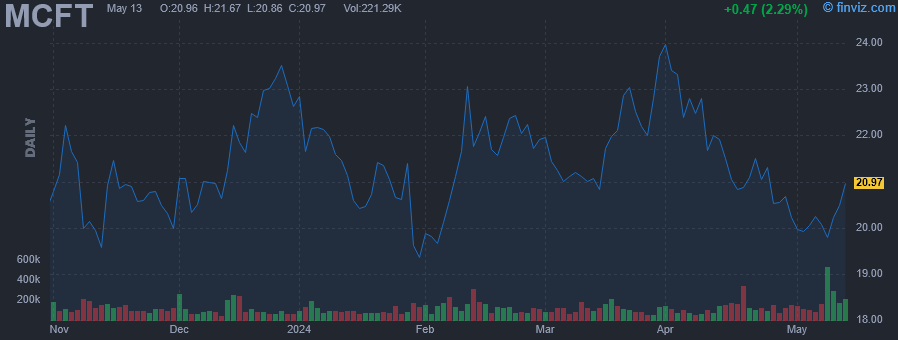
Unpacking Q4 Earnings: MasterCraft (NASDAQ:MCFT) In The Context Of Other Leisure Products Stocks
(StockStory) |
|
Apr-15-24 01:17PM
|
Hedge Fund and Insider Trading News: Jeffrey Talpins, Dan Loeb, Ken Griffin, Soroban Capital Partners, Millennium Management, MasterCraft Boat Holdings, Inc. (MCFT), and More
(Insider Monkey) |
|
Mar-04-24 08:30AM
|
MasterCraft Boat Holdings, Inc. Initiates Leadership Succession Plan
(GlobeNewswire) |
|
Feb-29-24 09:51AM
|
MasterCraft to Participate in Raymond James 45th Annual Institutional Investors Conference
(GlobeNewswire) |
|
Feb-07-24 09:30AM
|
Compared to Estimates, MasterCraft Boat Holdings, Inc. (MCFT) Q2 Earnings: A Look at Key Metrics
(Zacks) |
|
08:40AM
|
MasterCraft Boat Holdings, Inc. (MCFT) Beats Q2 Earnings and Revenue Estimates
(Zacks) |
|
07:30AM
|
MasterCraft Boat Holdings, Inc. Reports Results for Fiscal 2024 Second Quarter
(GlobeNewswire) |
|
Jan-22-24 05:47PM
|
MasterCraft Boat Holdings, Inc. to Webcast Fiscal Second Quarter 2024 Earnings Conference Call Wednesday, February 7, 2024
(GlobeNewswire) |
|
Mastercraft Boat Holdings, Inc. engages in the designing, manufacturing, and selling of boats. It operates through the following segments: MasterCraft, Crest, NauticStar, and Aviara. The MasterCraft segment offers recreational performance boats used for water skiing, wakeboarding, and wake surfing activities and general recreational boating under product brands, such as MasterCraft. The Crest segment produces pontoon boats at its Owosso, Michigan facility, which are used for general recreational boating. The NauticStar segment produces boats at its Amory, Mississippi facility, which are used for saltwater fishing and general recreational boating. The Aviara segment consists of the Aviara brand which manufactures luxury day boats. The company was founded in 1968 and is headquartered in Vonore, TN. |
| Insider Trading |
Relationship |
Date |
Transaction |
Cost |
#Shares |
Value ($) |
#Shares Total |
SEC Form 4 |
| Coliseum Capital Management, L | 10% Owner | Apr 22 '24 | Buy | 21.34 | 26,039 | 555,672 | 2,357,406 | Apr 22 07:59 PM | | Coliseum Capital Management, L | 10% Owner | Apr 18 '24 | Buy | 20.81 | 107,083 | 2,228,397 | 2,331,367 | Apr 22 07:59 PM | | Coliseum Capital Management, L | 10% Owner | Apr 12 '24 | Buy | 21.84 | 60,000 | 1,310,400 | 2,224,284 | Apr 12 08:52 PM | | Coliseum Capital Management, L | 10% Owner | Apr 11 '24 | Buy | 21.89 | 1,300 | 28,457 | 2,164,284 | Apr 12 08:52 PM | | Coliseum Capital Management, L | 10% Owner | Apr 10 '24 | Buy | 21.63 | 11,308 | 244,592 | 2,162,984 | Apr 12 08:52 PM |
|
|
|
 |
| Market Cap | 389.50M | EPS (ttm) | -0.94 |
| P/E | - | EPS this Y | 53.19% |
| Forward P/E | - | EPS next Y | 73.30% |
| PEG | - | EPS past 5Y | - |
| P/S | 0.68 | EPS next 5Y | 25.00% |
| P/B | - | EPS Q/Q | 14.61% |
| Dividend | - | Sales Q/Q | 6.27% |
| Insider Own | 31.85% | Inst Own | 63.11% |
| Insider Trans | 0.30% | Inst Trans | -1.11% |
| Short Float | 7.60% | Earnings | Apr 30/b |
| Analyst Recom | 1.50 | Target Price | 13.75 |
| Avg Volume | 259.90K | 52W Range | 5.47 - 12.13 |
|
|
|
|
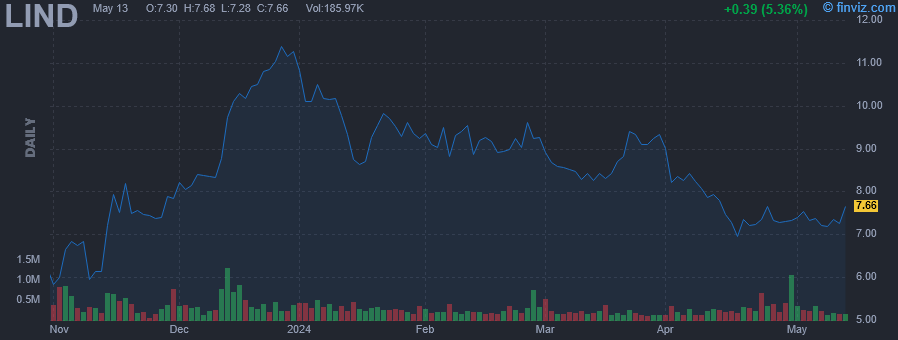
Lindblad Expeditions Holdings, Inc. engages in the provision of expedition cruising and travel services. It operates through the Lindblad and Natural Habitat segments. The Lindblad segment primarily includes sea-based expeditions. The Natural Habitat segment offers land-based, eco-conscious expeditions. The company was founded by Sven-Olof Lindblad on August 9, 2010 and is headquartered in New York, NY. |
| Insider Trading |
Relationship |
Date |
Transaction |
Cost |
#Shares |
Value ($) |
#Shares Total |
SEC Form 4 |
| SCHULTZ ALEX P | Director | Apr 19 '24 | Buy | 7.47 | 33,016 | 246,663 | 126,400 | Apr 22 04:57 PM | | SCHULTZ ALEX P | Director | Dec 13 '23 | Buy | 9.36 | 11,819 | 110,659 | 93,384 | Dec 14 05:20 PM | | SCHULTZ ALEX P | Director | Dec 12 '23 | Buy | 8.43 | 27,474 | 231,600 | 81,565 | Dec 14 05:20 PM | | Smith, Jr. Thomas S. | Director | Nov 22 '23 | Sale | 7.51 | 23,796 | 178,739 | 77,942 | Nov 27 04:42 PM | | FAHEY JOHN M JR | Director | Nov 20 '23 | Buy | 7.79 | 3,000 | 23,355 | 116,107 | Nov 21 04:40 PM |
|
|
|
