 |
| Market Cap | 433.81M | EPS (ttm) | -0.66 |
| P/E | - | EPS this Y | - |
| Forward P/E | - | EPS next Y | - |
| PEG | - | EPS past 5Y | - |
| P/S | - | EPS next 5Y | - |
| P/B | - | EPS Q/Q | - |
| Dividend | 9.12% | Sales Q/Q | - |
| Insider Own | - | Inst Own | 40.44% |
| Insider Trans | - | Inst Trans | - |
| Short Float | 0.18% | Earnings | - |
| Analyst Recom | - | Target Price | - |
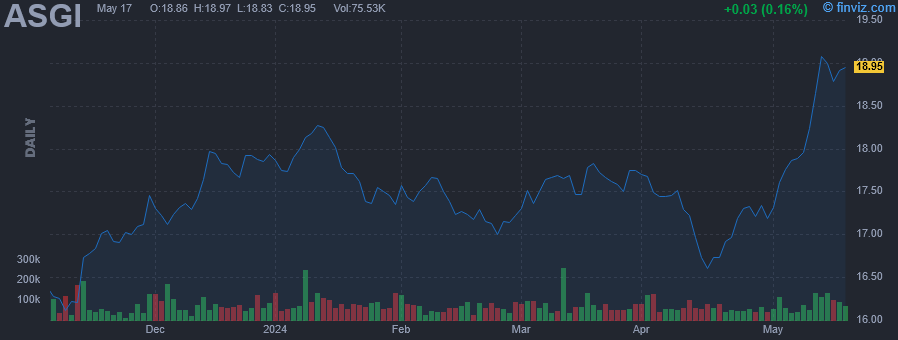
| Avg Volume | 74.99K | 52W Range | 14.96 - 18.55 |
|
|
|
|
Abrdn Global Infrastructure Income Fund seeks investment results that correspond generally to the price and yield performance, before fees and expenses, of the Northern Trust Real Assets Allocation IndexSM.Under normal circumstances, the fund will invest at least 80% of its total assets (exclusive of collateral held from securities lending) in the securities of the underlying index. The underlying index measures the performance of an optimized allocation to the underlying funds that is intended to provide exposures to certain real assets and minimize overall volatility of investment in the underlying funds. |
| Insider Trading |
Relationship |
Date |
Transaction |
Cost |
#Shares |
Value ($) |
#Shares Total |
SEC Form 4 |
| Saba Capital Management, L.P. | 10% Owner | Apr 25 '24 | Buy | 17.27 | 34,547 | 596,627 | 2,797,302 | Apr 26 11:36 AM | | Saba Capital Management, L.P. | 10% Owner | Apr 23 '24 | Buy | 17.11 | 13,691 | 234,253 | 2,762,755 | Apr 23 07:56 PM | | Saba Capital Management, L.P. | 10% Owner | Apr 22 '24 | Buy | 16.89 | 6,129 | 103,519 | 2,749,064 | Apr 23 07:56 PM | | Goodson Alan R | Director of Adviser | Apr 18 '24 | Buy | 16.83 | 3,881 | 65,317 | 3,881 | Apr 19 07:41 AM | | Saba Capital Management, L.P. | 10% Owner | Apr 15 '24 | Buy | 17.01 | 2,281 | 38,800 | 2,742,927 | Apr 15 05:11 PM |
|
|
 |
 |
| Market Cap | 196.86M | EPS (ttm) | 1.94 |
| P/E | 8.49 | EPS this Y | - |
| Forward P/E | - | EPS next Y | - |
| PEG | 0.32 | EPS past 5Y | 4.52% |
| P/S | 1.63 | EPS next 5Y | 26.30% |
| P/B | 0.69 | EPS Q/Q | -44.27% |
| Dividend | 4.37% | Sales Q/Q | 9.24% |
| Insider Own | 13.80% | Inst Own | 45.04% |
| Insider Trans | -1.56% | Inst Trans | -0.97% |
| Short Float | 0.69% | Earnings | Jan 24/b |
| Analyst Recom | 2.00 | Target Price | 10.74 |
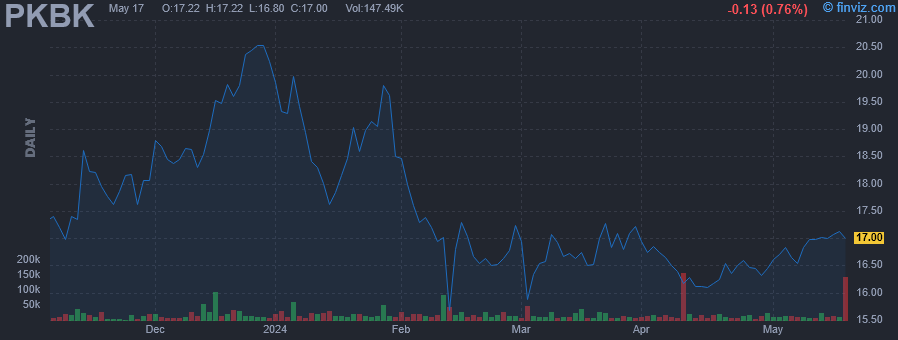
| Avg Volume | 22.35K | 52W Range | 14.86 - 20.87 |
|
|
|
|
Parke Bancorp, Inc. is a holding company, which engages in the provision of community banking. The company was founded in January 2005 and is headquartered in Sewell, NJ. |
| Insider Trading |
Relationship |
Date |
Transaction |
Cost |
#Shares |
Value ($) |
#Shares Total |
SEC Form 4 |
| PANTILIONE VITO S | President & CEO | Apr 25 '24 | Buy | 16.56 | 1,000 | 16,560 | 216,760 | Apr 26 11:16 AM | | PANTILIONE VITO S | President & CEO | Apr 25 '24 | Buy | 16.56 | 600 | 9,936 | 13,742 | Apr 26 11:16 AM | | Gallo Ralph Martin | Executive VP/COO | Mar 15 '24 | Option Exercise | 12.29 | 4,500 | 55,305 | 4,904 | Mar 18 11:53 AM | | Gallo Ralph Martin | Executive VP/COO | Mar 15 '24 | Sale | 16.73 | 4,500 | 75,285 | 404 | Mar 18 11:53 AM | | KRIPITZ JEFFREY H | Director | Feb 27 '24 | Sale | 16.50 | 2,372 | 39,138 | 93,013 | Feb 28 10:54 AM |
|
|
|
 |
| Market Cap | 11.37M | EPS (ttm) | -0.12 |
| P/E | - | EPS this Y | - |
| Forward P/E | - | EPS next Y | - |
| PEG | - | EPS past 5Y | - |
| P/S | 39.76 | EPS next 5Y | - |
| P/B | 0.82 | EPS Q/Q | - |
| Dividend | 0.94% | Sales Q/Q | 26.30% |
| Insider Own | 14.93% | Inst Own | 16.58% |
| Insider Trans | 1.49% | Inst Trans | - |
| Short Float | 0.01% | Earnings | - |
| Analyst Recom | - | Target Price | - |
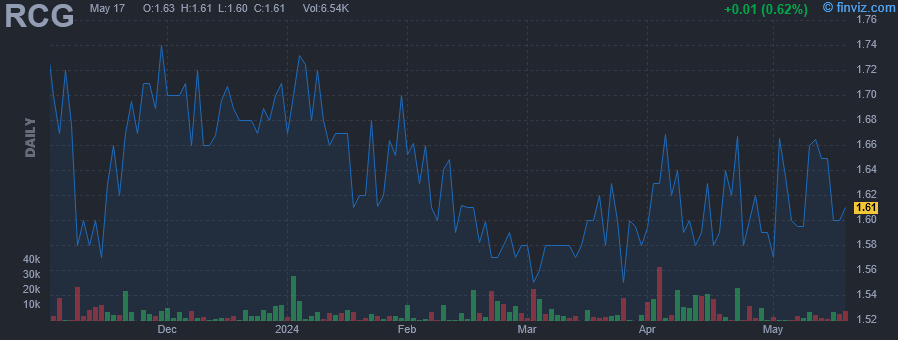
| Avg Volume | 7.55K | 52W Range | 1.52 - 1.90 |
|
|
|
|
RENN Fund, Inc. is a closed ended equity mutual fund launched by RENN Capital Group, Inc. The fund is co-managed by Horizon Kinetics Asset Management LLC. It invests in the public equity markets of the United States. The fund seeks to invest in stocks of companies operating across diversified sectors. It seeks to invest in stocks of small-cap and mid-cap companies. The fund employs a fundamental analysis with a bottom-up stock picking approach to create its portfolio. It was formerly known as RENN Global Entrepreneurs Fund, Inc. RENN Fund, Inc. was formed on January 20, 1994 and is domiciled in the United States. |
| Insider Trading |
Relationship |
Date |
Transaction |
Cost |
#Shares |
Value ($) |
#Shares Total |
SEC Form 4 |
| STAHL MURRAY | President and CEO | Apr 25 '24 | Buy | 1.64 | 55 | 90 | 247,522 | Apr 26 11:04 AM | | STAHL MURRAY | President and CEO | Apr 25 '24 | Buy | 1.64 | 4 | 7 | 5,019 | Apr 26 11:04 AM | | STAHL MURRAY | President and CEO | Apr 24 '24 | Buy | 1.70 | 55 | 94 | 247,498 | Apr 25 10:40 AM | | STAHL MURRAY | President and CEO | Apr 24 '24 | Buy | 1.70 | 4 | 7 | 5,015 | Apr 25 10:40 AM | | STAHL MURRAY | President and CEO | Apr 23 '24 | Buy | 1.65 | 55 | 91 | 247,474 | Apr 24 11:17 AM |
|
|
| |
 |
| Market Cap | 118.93M | EPS (ttm) | 1.94 |
| P/E | 8.48 | EPS this Y | - |
| Forward P/E | - | EPS next Y | - |
| PEG | - | EPS past 5Y | 1.51% |
| P/S | 0.89 | EPS next 5Y | - |
| P/B | 0.64 | EPS Q/Q | 27.17% |
| Dividend | 2.43% | Sales Q/Q | 34.28% |
| Insider Own | 40.11% | Inst Own | 15.00% |
| Insider Trans | 0.22% | Inst Trans | 4.04% |
| Short Float | 0.12% | Earnings | Apr 17/b |
| Analyst Recom | 1.00 | Target Price | 18.50 |
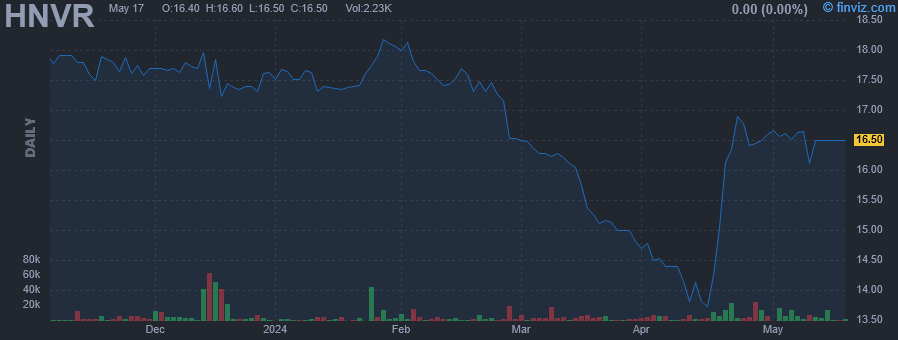
| Avg Volume | 5.46K | 52W Range | 13.62 - 18.91 |
|
|
|
|
Hanover Bancorp, Inc. is a bank holding company, which engages in the provision of financial services and commercial banking products and services. It also offers multi-family and commercial mortgages, residential loans, business loans, and lines of credit. The company was founded on November 4, 2008 and is headquartered in New York, NY. |
| Insider Trading |
Relationship |
Date |
Transaction |
Cost |
#Shares |
Value ($) |
#Shares Total |
SEC Form 4 |
| Vivona John P | FSVP & Chief Risk Officer | Apr 24 '24 | Buy | 16.79 | 200 | 3,357 | 3,200 | Apr 25 12:25 PM | | PUORRO MICHAEL P | Chairman & CEO | Apr 24 '24 | Buy | 16.78 | 200 | 3,356 | 277,888 | Apr 25 12:23 PM | | Burke Lance P | EVP & Chief Financial Officer | Apr 24 '24 | Buy | 16.78 | 200 | 3,356 | 21,171 | Apr 26 09:34 AM | | PUORRO MICHAEL P | Chairman & CEO | Apr 23 '24 | Buy | 16.90 | 200 | 3,380 | 277,688 | Apr 25 12:23 PM | | Sisti Elena | Director | Apr 22 '24 | Buy | 16.95 | 2,000 | 33,900 | 101,878 | Apr 23 01:59 PM |
|
|
|
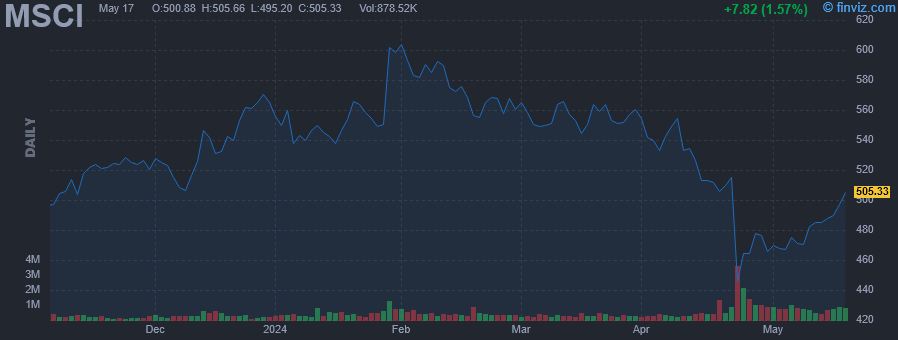 |
| Market Cap | 37.85B | EPS (ttm) | 14.65 |
| P/E | 32.62 | EPS this Y | 8.82% |
| Forward P/E | 28.63 | EPS next Y | 13.44% |
| PEG | 2.63 | EPS past 5Y | 20.50% |
| P/S | 14.46 | EPS next 5Y | 12.42% |
| P/B | - | EPS Q/Q | 8.53% |
| Dividend | 1.31% | Sales Q/Q | 14.82% |
| Insider Own | 3.22% | Inst Own | 91.81% |
| Insider Trans | 0.81% | Inst Trans | -2.77% |
| Short Float | 1.42% | Earnings | Apr 23/b |
| Analyst Recom | 2.40 | Target Price | 552.51 |
| Avg Volume | 568.43K | 52W Range | 439.95 - 617.39 |
|
|
|
|
MSCI, Inc. engages in the provision of investment decision support tools including indices, portfolio risk and performance analytics and corporate governance products and services. It operates through the following segments: Index, Analytics, ESG and Climate, and All Other-Private Assets. The Index segment focuses on the investment process, including developing indexed financial products. The Analytics segment offers risk management, performance attribution and portfolio management content, applications, and services. The ESG and Climate segment includes providing data, ratings, research, and tools to help investors navigate increasing regulation, meet new client demands and better integrate ESG and climate elements into their investment processes. The All Other-Private Assets segment refers to the business intelligence products to real estate owners, managers, developers, and brokers. The company was founded by Andrew Thomas Rudd in 1998 and is headquartered in New York, NY. |
| Insider Trading |
Relationship |
Date |
Transaction |
Cost |
#Shares |
Value ($) |
#Shares Total |
SEC Form 4 |
| Fernandez Henry A | Chairman and CEO | Apr 25 '24 | Buy | 465.92 | 13,000 | 6,056,955 | 327,479 | Apr 26 09:19 AM | | Pettit CD Baer | President & COO | Apr 25 '24 | Buy | 459.41 | 7,500 | 3,445,575 | 291,038 | Apr 26 09:19 AM | | Gutowski Robert J. | General Counsel | Aug 18 '23 | Sale | 520.00 | 1,478 | 768,560 | 15,179 | Aug 18 04:01 PM | | Crum Scott A | Chief Human Resources Officer | Jul 27 '23 | Sale | 555.89 | 1,800 | 1,000,602 | 18,274 | Jul 28 04:01 PM | | Crum Scott A | Chief Human Resources Officer | May 30 '23 | Sale | 479.61 | 2,000 | 959,213 | 20,074 | May 31 04:01 PM |
|
|
| |
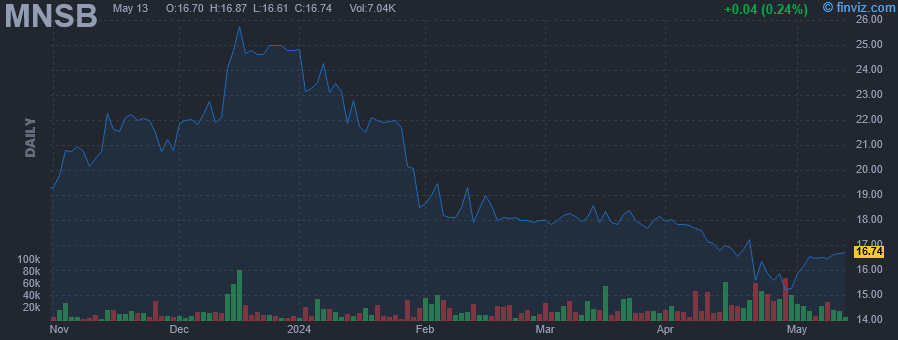 |
| Market Cap | 121.00M | EPS (ttm) | 2.60 |
| P/E | 6.12 | EPS this Y | -59.54% |
| Forward P/E | 10.97 | EPS next Y | 10.27% |
| PEG | - | EPS past 5Y | 18.59% |
| P/S | 0.92 | EPS next 5Y | - |
| P/B | 0.62 | EPS Q/Q | -64.11% |
| Dividend | 2.52% | Sales Q/Q | 12.20% |
| Insider Own | 9.75% | Inst Own | 55.24% |
| Insider Trans | 0.48% | Inst Trans | -2.06% |
| Short Float | 2.14% | Earnings | Apr 22/b |
| Analyst Recom | 2.00 | Target Price | 20.75 |
| Avg Volume | 23.76K | 52W Range | 15.20 - 25.97 |
|
|
|
|
MainStreet Bancshares, Inc. is a holding company, which engages in the provision of banking solutions through MainStreet Bank. It offers products and services such as checking, deposits, loans, credit cards, mortgages, and savings. The company was founded on March 28, 2003 and is headquartered in Fairfax, VA. |
| Insider Trading |
Relationship |
Date |
Transaction |
Cost |
#Shares |
Value ($) |
#Shares Total |
SEC Form 4 |
| ECHLOV RUSSELL | Director | Apr 26 '24 | Buy | 15.62 | 200 | 3,124 | 3,803 | Apr 26 08:44 AM | | Brockett Charles C. | Director | Apr 24 '24 | Buy | 16.40 | 710 | 11,644 | 92,318 | Apr 25 07:35 AM | | Brockett Charles C. | Director | Apr 24 '24 | Buy | 16.40 | 450 | 7,380 | 852 | Apr 25 07:35 AM | | Vari Richard Alexander | Chief Accounting Officer | Apr 24 '24 | Buy | 16.05 | 310 | 4,976 | 15,739 | Apr 24 11:07 AM | | Brockett Charles C. | Director | Mar 01 '24 | Buy | 18.36 | 19 | 349 | 402 | Mar 01 03:55 PM |
|
|
|
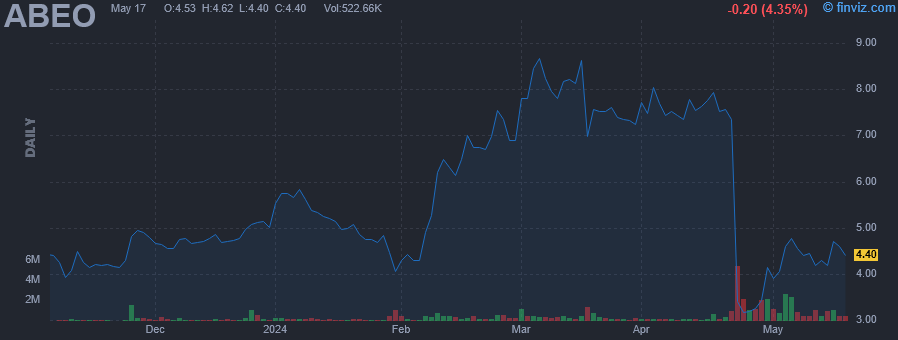 |
| Market Cap | 89.19M | EPS (ttm) | -2.59 |
| P/E | - | EPS this Y | 15.55% |
| Forward P/E | - | EPS next Y | 11.23% |
| PEG | - | EPS past 5Y | 38.92% |
| P/S | 25.48 | EPS next 5Y | - |
| P/B | 5.83 | EPS Q/Q | -920.75% |
| Dividend | - | Sales Q/Q | -100.00% |
| Insider Own | 5.27% | Inst Own | 52.12% |
| Insider Trans | 1.92% | Inst Trans | 22.75% |
| Short Float | 7.96% | Earnings | Mar 18/b |
| Analyst Recom | 1.00 | Target Price | 19.50 |
| Avg Volume | 502.41K | 52W Range | 2.83 - 9.01 |
|
|
|
|
Abeona Therapeutics, Inc. is a clinical stage biopharmaceutical company, which engages in the development of gene therapy for severe and life-threatening rare diseases. It programs include EB-101 (gene-corrected skin grafts) for recessive dystrophic epidermolysis bullosa (RDEB), ABO-102 (AAV-SGSH), an adeno-associated virus (AAV) based gene therapy for Sanfilippo syndrome type A (MPS IIIA), and ABO-101 (AAV NAGLU), an AAV based gene therapy for Sanfilippo syndrome type B (MPS IIIB). The company was founded in 1974 and is headquartered in Cleveland, OH. |
| Insider Trading |
Relationship |
Date |
Transaction |
Cost |
#Shares |
Value ($) |
#Shares Total |
SEC Form 4 |
| O'Malley Brendan M. | SVP, General Counsel | Apr 25 '24 | Buy | 3.24 | 8,600 | 27,864 | 188,718 | Apr 26 08:30 AM | | Vazzano Joseph Walter | Chief Financial Officer | Apr 25 '24 | Buy | 3.14 | 5,608 | 17,609 | 233,868 | Apr 26 08:30 AM | | Seshadri Vishwas | Chief Executive Officer | Feb 06 '24 | Buy | 4.39 | 20,000 | 87,800 | 528,260 | Feb 07 08:30 AM | | Alvino Mark | Director | Jan 17 '24 | Sale | 5.11 | 7,084 | 36,199 | 62,816 | Jan 22 04:30 PM | | Seshadri Vishwas | Chief Executive Officer | Sep 27 '23 | Buy | 4.07 | 20,000 | 81,400 | 521,731 | Sep 29 07:30 AM |
|
|
| |
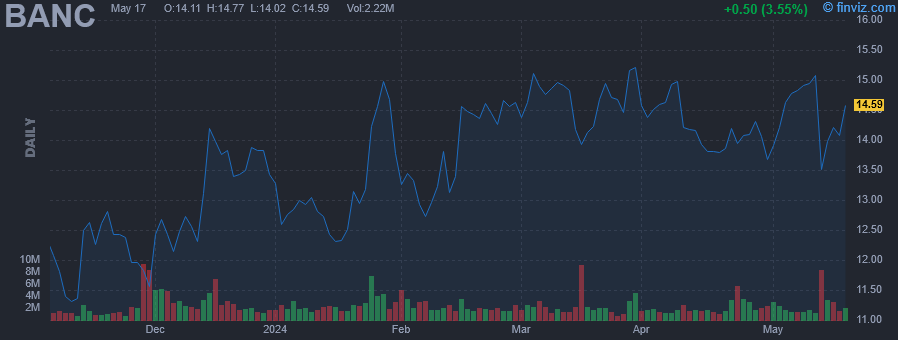 |
| Market Cap | 2.41B | EPS (ttm) | -3.34 |
| P/E | - | EPS this Y | 105.32% |
| Forward P/E | 7.17 | EPS next Y | 65.33% |
| PEG | - | EPS past 5Y | - |
| P/S | 2.89 | EPS next 5Y | 10.00% |
| P/B | 0.83 | EPS Q/Q | -51.30% |
| Dividend | 2.79% | Sales Q/Q | 355.03% |
| Insider Own | 8.65% | Inst Own | 72.09% |
| Insider Trans | -0.96% | Inst Trans | -0.74% |
| Short Float | 6.84% | Earnings | Apr 23/b |
| Analyst Recom | 2.20 | Target Price | 17.33 |
| Avg Volume | 2.46M | 52W Range | 9.72 - 16.08 |
|
|
|
|
Banc of California, Inc. is a holding company engaged in the provision of commercial banking services. It offers personal banking, business and commercial banking, real estate banking, and private banking. The company was founded in 1941 and is headquartered in Santa Ana, CA. |
| Insider Trading |
Relationship |
Date |
Transaction |
Cost |
#Shares |
Value ($) |
#Shares Total |
SEC Form 4 |
| WOLFF JARED M | PRESIDENT AND CEO | Apr 25 '24 | Buy | 13.98 | 7,130 | 99,677 | 268,695 | Apr 26 08:29 AM | | LASHLEY RICHARD J | Director | Mar 14 '24 | Buy | 14.47 | 7,500 | 108,562 | 2,485,643 | Mar 15 04:44 PM | | LASHLEY RICHARD J | Director | Mar 01 '24 | Buy | 14.44 | 15,000 | 216,669 | 2,478,143 | Mar 01 05:55 PM | | LASHLEY RICHARD J | Director | Feb 29 '24 | Buy | 21.40 | 10,000 | 213,993 | 10,000 | Mar 01 05:55 PM | | Barker James Andrew | Director | Feb 14 '24 | Buy | 13.16 | 10,000 | 131,590 | 159,680 | Feb 14 07:25 PM |
|
|
|
 |
| Market Cap | 78.25M | EPS (ttm) | -0.00 |
| P/E | - | EPS this Y | - |
| Forward P/E | - | EPS next Y | - |
| PEG | - | EPS past 5Y | - |
| P/S | - | EPS next 5Y | - |
| P/B | 8.58 | EPS Q/Q | -216.22% |
| Dividend | - | Sales Q/Q | - |
| Insider Own | 95.17% | Inst Own | 31.17% |
| Insider Trans | 2.37% | Inst Trans | - |
| Short Float | 4.26% | Earnings | - |
| Analyst Recom | - | Target Price | - |
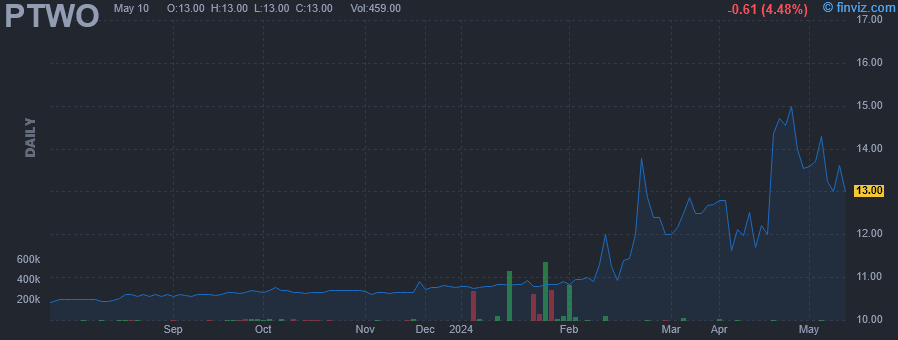
| Avg Volume | 37.65K | 52W Range | 10.15 - 15.00 |
|
|
|
|
Pono Capital Two, Inc. operates as a blank check company, which was formed for the purpose of effecting a merger, capital stock exchange, asset acquisition, stock purchase, reorganization, or similar business combination with one or more businesses. The company was founded on March 11, 2022 and is headquartered in Honolulu, HI. |
| Insider Trading |
Relationship |
Date |
Transaction |
Cost |
#Shares |
Value ($) |
#Shares Total |
SEC Form 4 |
| ZUU Co. Ltd. | 10% Owner | Apr 23 '24 | Buy | 12.97 | 2,615 | 33,911 | 1,457,675 | Apr 25 09:00 PM | | ZUU Co. Ltd. | 10% Owner | Apr 11 '24 | Buy | 12.80 | 4 | 51 | 1,455,060 | Apr 11 09:00 PM | | ZUU Co. Ltd. | 10% Owner | Apr 09 '24 | Buy | 12.80 | 1 | 13 | 1,455,056 | Apr 11 09:00 PM | | ZUU Co. Ltd. | 10% Owner | Apr 05 '24 | Buy | 12.80 | 2 | 26 | 1,455,055 | Apr 08 09:48 PM | | ZUU Co. Ltd. | 10% Owner | Apr 04 '24 | Buy | 12.80 | 2 | 26 | 1,455,053 | Apr 08 09:48 PM |
|
|
|
 |
| Market Cap | 2.60M | EPS (ttm) | -0.07 |
| P/E | - | EPS this Y | -142.86% |
| Forward P/E | - | EPS next Y | 70.37% |
| PEG | - | EPS past 5Y | 8.51% |
| P/S | 0.34 | EPS next 5Y | - |
| P/B | 0.06 | EPS Q/Q | -159.17% |
| Dividend | - | Sales Q/Q | -53.87% |
| Insider Own | 16.59% | Inst Own | 11.61% |
| Insider Trans | 7.77% | Inst Trans | 30.06% |
| Short Float | 1.96% | Earnings | Mar 18/a |
| Analyst Recom | 1.00 | Target Price | 0.20 |
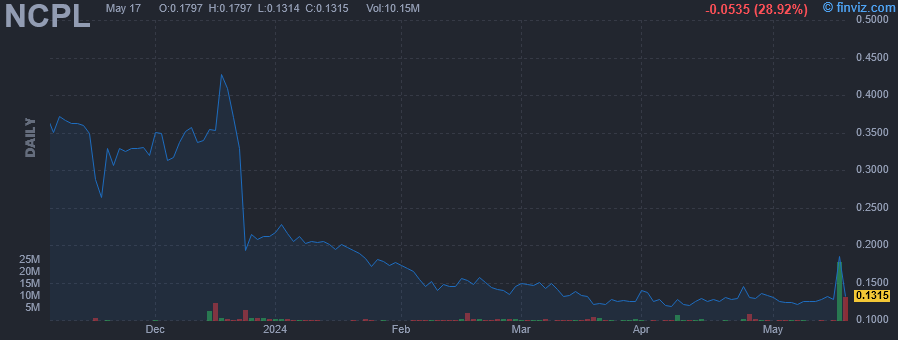
| Avg Volume | 565.74K | 52W Range | 0.11 - 2.73 |
|
|
|
|
Netcapital, Inc. is a fintech company, which engages in the provision of financial solutions. The firm's platform allows private companies to raise capital online and provides private equity investment opportunities to investors. The company was founded by Sean F. Lee on April 25, 1984 and is headquartered in Boston, MA. |
| Insider Trading |
Relationship |
Date |
Transaction |
Cost |
#Shares |
Value ($) |
#Shares Total |
SEC Form 4 |
| Geary Steven F | Director | Apr 24 '24 | Buy | 0.13 | 239,274 | 31,680 | 249,574 | Apr 25 08:44 PM |
|
|
|
