 |
| Market Cap | 6.48B | EPS (ttm) | 1.09 |
| P/E | 139.13 | EPS this Y | 81.80% |
| Forward P/E | 10.58 | EPS next Y | 29.10% |
| PEG | 5.02 | EPS past 5Y | -23.54% |
| P/S | 1.72 | EPS next 5Y | 27.70% |
| P/B | 2.32 | EPS Q/Q | 126.76% |
| Dividend | - | Sales Q/Q | 76.74% |
| Insider Own | 0.55% | Inst Own | 116.93% |
| Insider Trans | 1.03% | Inst Trans | 1.20% |
| Short Float | 13.90% | Earnings | May 03/b |
| Analyst Recom | 1.61 | Target Price | 200.14 |
| Avg Volume | 575.73K | 52W Range | 106.66 - 184.65 |
|
|
|
|
Chart Industries, Inc. engages in the manufacturing of engineered equipment for the industrial gas, energy, and biomedical industries. It operates through the following business segments: Cryo Tank Solutions, Heat Transfer Systems, Specialty Products and Repair, Service & Leasing, and Corporate. The Cryo Tank Solutions segment supplies bulk, microbulk, and mobile equipment used in the storage, distribution, vaporization, and application of industrial gases. The Heat Transfer Systems segment supplies mission engineered equipment and systems used in the separation, liquefaction, and purification of hydrocarbon and industrial gases. The Specialty Products segment supplies products used in specialty market applications including hydrogen, HLNG vehicle tanks, food and beverage, space exploration, lasers, cannabis, and water treatment. The Repair, Service, and leasing segment includes repair and service centers globally, which provides installation, service, repair, maintenance, and refurbishment of cryogenic products, as well as global equipment leasing solutions. The Corporate segment includes operating expenses for executive management, accounting, tax, treasury, corporate development, human resources, information technology, investor relations, legal, internal audit, and risk management. The company was founded in 1992 and is headquartered in Ball Ground, GA. |
| Insider Trading |
Relationship |
Date |
Transaction |
Cost |
#Shares |
Value ($) |
#Shares Total |
SEC Form 4 |
| Evanko Jillian C. | President and CEO | May 10 '24 | Buy | 153.44 | 490 | 75,186 | 125,008 | May 10 04:02 PM | | Harty Linda S | Director | Dec 15 '23 | Buy | 130.14 | 1,000 | 130,140 | 8,310 | Dec 15 03:47 PM | | Harty Linda S | Director | Dec 14 '23 | Buy | 134.44 | 500 | 67,222 | 7,310 | Dec 14 10:42 AM | | CICHOCKI ANDREW R | Director | Dec 11 '23 | Buy | 126.88 | 400 | 50,753 | 1,177 | Dec 11 03:02 PM |
|
|
 |
 |
| Market Cap | 138.36M | EPS (ttm) | 0.30 |
| P/E | 64.67 | EPS this Y | - |
| Forward P/E | - | EPS next Y | - |
| PEG | - | EPS past 5Y | -37.81% |
| P/S | 1.32 | EPS next 5Y | - |
| P/B | 0.32 | EPS Q/Q | 36.37% |
| Dividend | 3.45% | Sales Q/Q | 15.49% |
| Insider Own | 10.02% | Inst Own | 29.16% |
| Insider Trans | 9.68% | Inst Trans | -0.31% |
| Short Float | 2.82% | Earnings | Apr 24/a |
| Analyst Recom | - | Target Price | - |
| Avg Volume | 16.24K | 52W Range | 15.02 - 26.00 |
|
|
|
|
Hawthorn Bancshares, Inc. operates as a bank holding company, which provides banking services to individual and corporate customers through its subsidiary, Hawthorn Bank. It offers checking and savings accounts, internet banking, debit cards, certificates of deposit, brokerage services, personal loans, installment loans, trust services, credit related insurance, and safe deposit boxes. The company was founded in 1865 and is headquartered in Jefferson City, MO. |
| Insider Trading |
Relationship |
Date |
Transaction |
Cost |
#Shares |
Value ($) |
#Shares Total |
SEC Form 4 |
| Hettinger Shawna M. | Director | May 08 '24 | Buy | 19.64 | 1,000 | 19,645 | 4,103 | May 10 01:51 PM | | Eden Douglas Todd | Director | May 03 '24 | Buy | 19.63 | 15,000 | 294,390 | 76,826 | May 06 11:59 AM | | Holtaway Jonathan | Director | Apr 30 '24 | Buy | 18.76 | 5,500 | 103,180 | 26,500 | May 01 11:26 AM | | GILES BRENT M | CHIEF EXECUTIVE OFFICER | Apr 30 '24 | Buy | 18.18 | 400 | 7,274 | 7,968 | May 01 03:28 PM | | Holtaway Jonathan | Director | Apr 29 '24 | Buy | 19.19 | 5,500 | 105,545 | 21,000 | May 01 11:26 AM |
|
|
|
 |
| Market Cap | 3.30B | EPS (ttm) | -0.78 |
| P/E | - | EPS this Y | 78.77% |
| Forward P/E | - | EPS next Y | 63.42% |
| PEG | - | EPS past 5Y | - |
| P/S | 3.75 | EPS next 5Y | 0.21% |
| P/B | 1.44 | EPS Q/Q | -44.27% |
| Dividend | 4.53% | Sales Q/Q | -0.99% |
| Insider Own | 0.75% | Inst Own | 87.61% |
| Insider Trans | -4.97% | Inst Trans | -3.20% |
| Short Float | 5.60% | Earnings | Apr 30/b |
| Analyst Recom | 3.47 | Target Price | 15.54 |
| Avg Volume | 2.10M | 52W Range | 8.90 - 17.69 |
|
|
|
May-11-24 12:25PM
|
5 Dividend Stocks Insiders are Buying in May
(Insider Monkey) |
|
May-09-24 04:16PM
|
Insider Buying Alert: CEOs Are Buying These 10 Stocks
(Insider Monkey) |
|
09:33AM
|
Affirm stock sinking, Good Buy or Goodbye: Market Domination
(Yahoo Finance Video) |
|
May-08-24 05:21PM
|
Real estate, REIT opportunities in this high rate environment
(Yahoo Finance Video) |
|
May-07-24 07:44PM
|
Analyst Report: The Macerich Company
(Morningstar Research) |
|
01:58PM
|
Hedge Fund and Insider Trading News: Stanley Druckenmiller, Ken Griffin, David Einhorn, Dan Loeb, Harris Kupperman, Shah Capital Management, Macerich Co (MAC), Sensata Technologies Holding PLC (ST), and More
(Insider Monkey) |
|
May-06-24 07:01PM
|
Insider Buying: President and CEO Jackson Hsieh Acquires 140,000 Shares of Macerich Co (MAC)
(GuruFocus.com) |
|
03:26PM
|
Macerich Insider Bought Shares Worth $1,996,820, According to a Recent SEC Filing
(MT Newswires) |
|
May-01-24 08:02PM
|
Analyst Report: The Macerich Company
(Morningstar Research) |
|
12:13PM
|
Macerich (MAC) Stock Declines on Q1 FFO Miss, Revenues Fall Y/Y
(Zacks) |
|
Macerich Co. operates as a real estate investment trust, which engages in the acquisition, ownership, development, redevelopment, management, and leasing of regional and community shopping centers located throughout the United States. The company was founded by Mace Siegel Dana K. Anderson, Arthur M. Coppola and Edward C. Coppola in 1964 and is headquartered in Santa Monica, CA. |
| Insider Trading |
Relationship |
Date |
Transaction |
Cost |
#Shares |
Value ($) |
#Shares Total |
SEC Form 4 |
| Volk Kenneth | EVP, Business Development | May 10 '24 | Buy | 15.40 | 5,000 | 77,025 | 51,924 | May 10 01:40 PM | | Kingsmore Scott W | Chief Financial Officer | May 09 '24 | Buy | 16.06 | 6,000 | 96,360 | 42,310 | May 09 07:02 PM | | Menard Ann C | Chief Legal Officer/Secretary | May 08 '24 | Buy | 15.40 | 4,865 | 74,945 | 20,633 | May 08 05:11 PM | | Healey Doug J | Senior EVP, Head of Leasing | May 07 '24 | Buy | 15.20 | 7,500 | 114,000 | 78,487 | May 08 02:13 PM | | Hsieh Jackson | President and CEO | May 06 '24 | Buy | 14.26 | 140,000 | 1,996,820 | 170,500 | May 06 03:20 PM |
|
|
| |
 |
| Market Cap | 1.03B | EPS (ttm) | 1.20 |
| P/E | 8.10 | EPS this Y | 0.80% |
| Forward P/E | 8.38 | EPS next Y | -3.30% |
| PEG | 1.62 | EPS past 5Y | 17.84% |
| P/S | 3.56 | EPS next 5Y | 5.00% |
| P/B | 0.86 | EPS Q/Q | - |
| Dividend | 10.60% | Sales Q/Q | 19.50% |
| Insider Own | 0.49% | Inst Own | 45.49% |
| Insider Trans | 5.75% | Inst Trans | - |
| Short Float | 0.55% | Earnings | May 07/a |
| Analyst Recom | 2.00 | Target Price | 10.25 |
| Avg Volume | 529.53K | 52W Range | 7.17 - 9.89 |
|
|
|
|
Barings BDC, Inc. is a publicly traded, externally managed investment company that has elected to be treated as a business development company under the Investment Company Act of 1940. It seeks to invest primarily in senior secured loans, first lien debt, unitranche, second lien debt, subordinated debt, equity co-investments and senior secured private debt investments in private middle-market companies that operate across a wide range of industries. It specializes in mezzanine, leveraged buyouts, management buyouts, ESOPs, change of control transactions, acquisition financings, growth financing, and recapitalizations in lower middle market, mature, and later stage companies. It invests in manufacturing and distribution; business services and technology; transportation and logistics; consumer product and services. It invests in United States. It invests in companies with EBITDA of $10 million to $75 million, typically in private equity sponsor backed. |
| Insider Trading |
Relationship |
Date |
Transaction |
Cost |
#Shares |
Value ($) |
#Shares Total |
SEC Form 4 |
| Freno Michael | Officer of Adviser | May 09 '24 | Buy | 9.73 | 27,500 | 267,492 | 71,145 | May 10 01:20 PM | | BYERS STEPHEN R | Director | Feb 28 '24 | Buy | 9.70 | 570 | 5,529 | 21,647 | Mar 05 12:48 PM | | BYERS STEPHEN R | Director | Jul 18 '23 | Buy | 8.03 | 400 | 3,210 | 21,077 | Jul 19 10:15 AM | | O'Connor Michael James | Adviser Board Member | May 16 '23 | Buy | 7.43 | 25,000 | 185,732 | 25,000 | May 16 09:06 AM |
|
|
|
 |
| Market Cap | 35.75M | EPS (ttm) | 0.07 |
| P/E | 3.80 | EPS this Y | -279.60% |
| Forward P/E | - | EPS next Y | - |
| PEG | - | EPS past 5Y | - |
| P/S | 21.41 | EPS next 5Y | - |
| P/B | 0.43 | EPS Q/Q | 1.51% |
| Dividend | - | Sales Q/Q | 1285.21% |
| Insider Own | 9.06% | Inst Own | 6.74% |
| Insider Trans | 0.32% | Inst Trans | -7.01% |
| Short Float | 0.81% | Earnings | Apr 30/b |
| Analyst Recom | 3.00 | Target Price | 4.00 |
| Avg Volume | 769.61K | 52W Range | 0.24 - 0.99 |
|
|
|
|
Comstock, Inc. engages in the innovation, commercialization, and development of technologies that enable systemic decarbonization by converting under-utilized natural resources into renewable energy products. It operates through the following segments: Fuels, Metals, Mining, Strategic Investments, and Corporate and Other. The Fuels segment develops and commercializes technologies that extract and convert wasted and unused lignocellulosic biomass into intermediates for refining into advanced renewable fuels. The Metals segment is involved in recycling metals from other electronic devices, such as end-of-life batteries and fuel cells at later stages of development and production. The Mining segment focuses on leases, licenses, and related fees. It is administered by Comstock Mining LLC, and various other subsidiaries that collectively own or control twelve square miles of properties of patented mining claims, unpatented mining claims, and surface parcels in Northern Nevada. The Strategic Investments segment represents investments and projects that are strategic to plans and the ability to produce and maximize throughput in fuels, metals, and mining segments. The Corporate and Other segment includes corporate functions and services, including research and development activities that are ongoing outside of the business activities related to fuels, metals, mining, and strategic investments segments. The company was founded in 1999 and is headquartered in Virginia City, NV. |
| Insider Trading |
Relationship |
Date |
Transaction |
Cost |
#Shares |
Value ($) |
#Shares Total |
SEC Form 4 |
| MCCARTHY WILLIAM JOSEPH | Chief Operating Officer | May 09 '24 | Buy | 0.26 | 15,000 | 3,854 | 1,542,000 | May 10 12:41 PM | | BOBBILI RAHUL | Chief Engineering Officer | May 08 '24 | Buy | 0.25 | 15,000 | 3,768 | 1,025,000 | May 08 04:08 PM | | BOBBILI RAHUL | Chief Engineering Officer | May 07 '24 | Buy | 0.25 | 10,000 | 2,500 | 1,010,000 | May 08 04:08 PM | | Drozdoff Leo M | Director | Nov 09 '23 | Buy | 0.47 | 40,000 | 18,600 | 400,000 | Nov 09 06:33 PM | | MCCARTHY WILLIAM JOSEPH | Chief Operating Officer | Oct 27 '23 | Buy | 0.41 | 24,000 | 9,744 | 1,524,000 | Oct 30 05:50 PM |
|
|
| |
 |
| Market Cap | 275.15M | EPS (ttm) | 1.52 |
| P/E | 11.81 | EPS this Y | 1.27% |
| Forward P/E | 10.14 | EPS next Y | 11.01% |
| PEG | - | EPS past 5Y | -2.53% |
| P/S | 1.75 | EPS next 5Y | - |
| P/B | 1.05 | EPS Q/Q | -14.07% |
| Dividend | 6.26% | Sales Q/Q | 16.58% |
| Insider Own | 4.60% | Inst Own | 30.78% |
| Insider Trans | 0.50% | Inst Trans | -0.68% |
| Short Float | 0.59% | Earnings | Apr 25/b |
| Analyst Recom | 3.00 | Target Price | 19.00 |
| Avg Volume | 24.55K | 52W Range | 16.71 - 23.50 |
|
|
|
|
Citizens & Northern Corp. is a holding company, which engages in community banking. It provides a full range of banking and mortgage services to individual and corporate customers in North Central Pennsylvania and Southern New York State. The firm's lending products include mortgage loans, commercial loans, and consumer loans. Its deposit products include various types of checking accounts, passbook and statement savings, money market accounts, interest checking accounts, individual retirement accounts, and certificates of deposit. The company was founded in 1864 and is headquartered in Wellsboro, PA. |
| Insider Trading |
Relationship |
Date |
Transaction |
Cost |
#Shares |
Value ($) |
#Shares Total |
SEC Form 4 |
| Pellegrino Frank G | Director | May 08 '24 | Buy | 17.68 | 113 | 1,997 | 37,513 | May 10 12:20 PM | | Shattuck Katherine W | Director | May 08 '24 | Buy | 17.68 | 94 | 1,662 | 6,758 | May 10 12:21 PM | | Loughery Robert G | Director | May 08 '24 | Buy | 17.68 | 94 | 1,662 | 8,730 | May 10 12:22 PM | | Pellegrino Frank G | Director | May 03 '24 | Buy | 17.88 | 282 | 5,042 | 37,400 | May 06 04:16 PM | | Shattuck Katherine W | Director | May 03 '24 | Buy | 17.88 | 159 | 2,843 | 6,664 | May 06 04:17 PM |
|
|
|
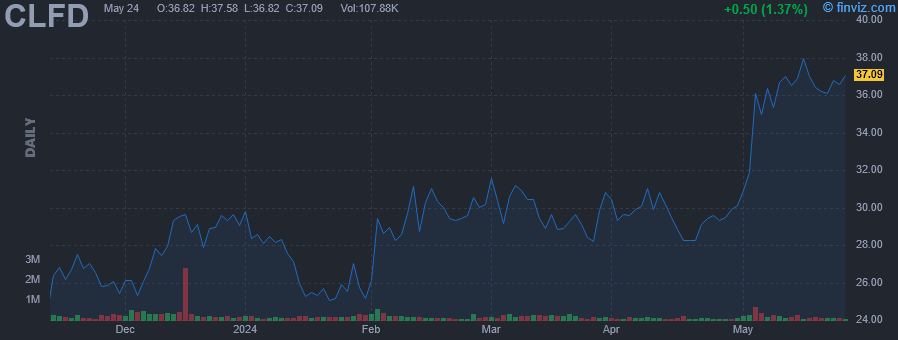 |
| Market Cap | 526.94M | EPS (ttm) | -0.23 |
| P/E | - | EPS this Y | -161.64% |
| Forward P/E | - | EPS next Y | 88.04% |
| PEG | - | EPS past 5Y | 46.82% |
| P/S | 2.89 | EPS next 5Y | - |
| P/B | 1.91 | EPS Q/Q | -159.49% |
| Dividend | - | Sales Q/Q | -48.60% |
| Insider Own | 16.14% | Inst Own | 63.41% |
| Insider Trans | 0.43% | Inst Trans | 28.19% |
| Short Float | 17.59% | Earnings | May 02/a |
| Analyst Recom | 1.50 | Target Price | 40.00 |
| Avg Volume | 198.77K | 52W Range | 22.91 - 50.82 |
|
|
|
|
Clearfield, Inc. engages in the design, manufacture, and distribution of fiber protection. It operates through the Clearfield and Nestor Cable segment. The Clearfield segment involves the design, manufacture, and selling of fiber management, protection, and delivery solutions. The Nestor Cables segment includes designs, manufacture, and selling fiber management, protection, and delivery solutions. The company was founded in 1979 and is headquartered in Brooklyn Park, MN. |
| Insider Trading |
Relationship |
Date |
Transaction |
Cost |
#Shares |
Value ($) |
#Shares Total |
SEC Form 4 |
| Wirsbinski Carol Ann | Director | May 10 '24 | Buy | 36.95 | 541 | 19,990 | 4,619 | May 10 11:52 AM | | Harding Roger G | Director | Mar 05 '24 | Buy | 29.47 | 6,500 | 191,555 | 30,021 | Mar 06 12:09 PM | | Jones Walter Louis JR | Director | Mar 04 '24 | Buy | 30.41 | 818 | 24,875 | 4,737 | Mar 05 09:49 AM | | ROTH RONALD G | Chairman of the Board | Feb 23 '24 | Buy | 29.62 | 2,000 | 59,240 | 1,259,796 | Feb 27 11:21 AM | | Wirsbinski Carol Ann | Director | Aug 08 '23 | Buy | 38.93 | 512 | 19,932 | 2,039 | Aug 09 04:54 PM |
|
|
| |
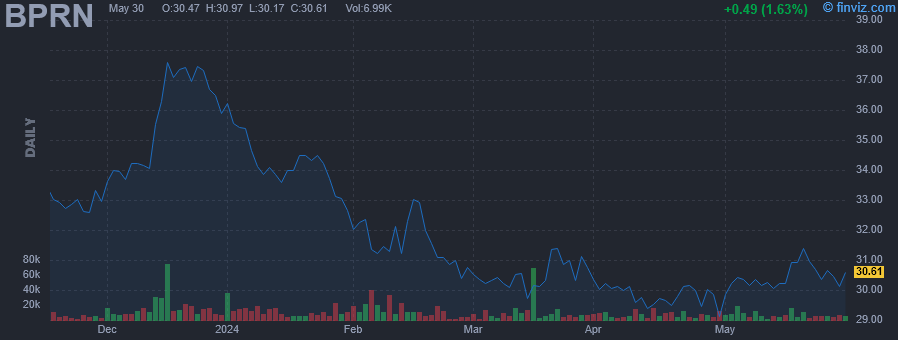 |
| Market Cap | 191.98M | EPS (ttm) | 3.76 |
| P/E | 8.06 | EPS this Y | -28.04% |
| Forward P/E | 9.04 | EPS next Y | 15.52% |
| PEG | - | EPS past 5Y | 13.51% |
| P/S | 1.56 | EPS next 5Y | - |
| P/B | 0.79 | EPS Q/Q | -28.77% |
| Dividend | 3.96% | Sales Q/Q | 36.68% |
| Insider Own | 25.88% | Inst Own | 43.58% |
| Insider Trans | 3.52% | Inst Trans | -0.39% |
| Short Float | 1.73% | Earnings | Apr 25/a |
| Analyst Recom | 3.00 | Target Price | 33.00 |
| Avg Volume | 10.25K | 52W Range | 23.49 - 38.19 |
|
|
|
|
Princeton Bancorp, Inc. operates as a bank holding company. It is a full-service financial institution that provides business and personal banking. It offers traditional retail banking services, one-to-four-family residential mortgage loans, multi-family and commercial mortgage loans, construction loans, commercial business loans, and consumer loans, including home equity loans and lines of credit. The company was founded in 2017 and is headquartered in Princeton, NJ. |
| Insider Trading |
Relationship |
Date |
Transaction |
Cost |
#Shares |
Value ($) |
#Shares Total |
SEC Form 4 |
| TUCHMAN MARTIN | Director | May 08 '24 | Buy | 29.95 | 1,000 | 29,950 | 91,924 | May 10 10:36 AM | | TUCHMAN MARTIN | Director | May 01 '24 | Buy | 29.35 | 105 | 3,081 | 90,924 | May 02 04:35 PM | | TUCHMAN MARTIN | Director | Apr 30 '24 | Buy | 29.43 | 2,000 | 58,850 | 90,819 | May 02 04:35 PM | | TUCHMAN MARTIN | Director | Mar 15 '24 | Buy | 29.75 | 10,000 | 297,500 | 600,141 | Mar 18 09:08 AM | | TUCHMAN MARTIN | Director | Mar 15 '24 | Buy | 29.74 | 5,000 | 148,720 | 88,819 | Mar 18 09:08 AM |
|
|
|
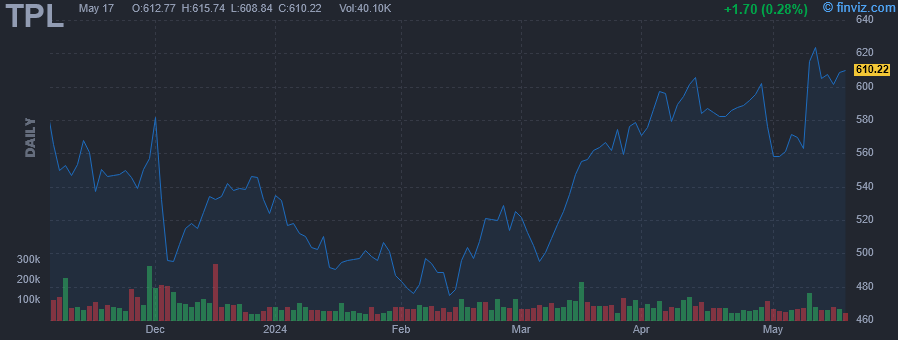 |
| Market Cap | 14.35B | EPS (ttm) | 18.82 |
| P/E | 33.15 | EPS this Y | -8.60% |
| Forward P/E | 8.53 | EPS next Y | 244.95% |
| PEG | 1.65 | EPS past 5Y | 14.40% |
| P/S | 21.76 | EPS next 5Y | 20.03% |
| P/B | 12.78 | EPS Q/Q | 32.60% |
| Dividend | 0.71% | Sales Q/Q | 18.90% |
| Insider Own | 0.82% | Inst Own | 59.40% |
| Insider Trans | 1.10% | Inst Trans | 0.69% |
| Short Float | 3.46% | Earnings | May 08/a |
| Analyst Recom | 2.70 | Target Price | 660.71 |
| Avg Volume | 76.56K | 52W Range | 422.07 - 666.67 |
|
|
|
|
Texas Pacific Land Corporation engages in the land and resource management, and water services and operations businesses. The company owns a 1/128th nonparticipating perpetual oil and gas royalty interest (NPRI) under approximately 85,000 acres of land; a 1/16th NPRI under approximately 371,000 acres of land; and approximately 4,000 additional net royalty acres, total of approximately 195,000 NRA located in the western part of Texas. The Land and Resource Management segment manages surface acres of land, and oil and gas royalty interest in West Texas. This segment also engages in easements, such as transporting oil, gas and related hydrocarbons, power line and utility, and subsurface wellbore easements. In addition, this segment leases its land for processing, storage, and compression facilities and roads; and is involved in sale of materials, such as caliche, sand, and other material, as well as sells land. The Water Services and Operations segment provides full-service water offerings, including water sourcing, produced-water treatment, infrastructure development, and disposal solutions to operators in the Permian Basin. This segment also holds produced water royalties. Texas Pacific Land Corporation was founded in 1888 and is headquartered in Dallas, Texas. |
| Insider Trading |
Relationship |
Date |
Transaction |
Cost |
#Shares |
Value ($) |
#Shares Total |
SEC Form 4 |
| HORIZON KINETICS ASSET MANAGEM | 10% Owner | May 09 '24 | Buy | 616.90 | 3 | 1,851 | 1,084,986 | May 10 10:35 AM | | HORIZON KINETICS ASSET MANAGEM | 10% Owner | May 08 '24 | Buy | 564.11 | 3 | 1,692 | 1,084,983 | May 09 11:19 AM | | HORIZON KINETICS ASSET MANAGEM | 10% Owner | May 07 '24 | Buy | 572.35 | 3 | 1,717 | 1,084,980 | May 08 10:51 AM | | HORIZON KINETICS ASSET MANAGEM | 10% Owner | May 06 '24 | Buy | 569.38 | 3 | 1,708 | 1,084,977 | May 07 11:25 AM | | HORIZON KINETICS ASSET MANAGEM | 10% Owner | May 03 '24 | Buy | 561.48 | 3 | 1,684 | 1,084,974 | May 06 11:45 AM |
|
|
|
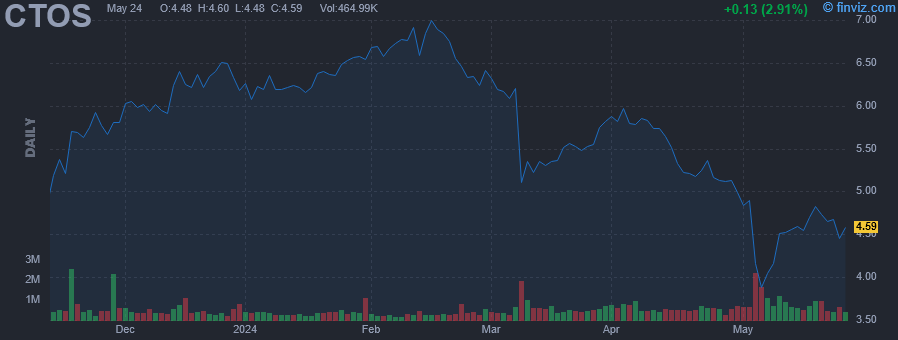 |
| Market Cap | 1.09B | EPS (ttm) | 0.09 |
| P/E | 49.51 | EPS this Y | -21.90% |
| Forward P/E | 15.41 | EPS next Y | 79.27% |
| PEG | 2.57 | EPS past 5Y | - |
| P/S | 0.60 | EPS next 5Y | 19.30% |
| P/B | 1.21 | EPS Q/Q | -206.62% |
| Dividend | - | Sales Q/Q | -9.04% |
| Insider Own | 77.33% | Inst Own | 19.12% |
| Insider Trans | 0.07% | Inst Trans | 0.07% |
| Short Float | 5.70% | Earnings | May 02/a |
| Analyst Recom | 1.60 | Target Price | 7.60 |
| Avg Volume | 652.39K | 52W Range | 3.61 - 7.53 |
|
|
|
|
Custom Truck One Source, Inc. engages in the sale and rental of truck and heavy equipment. The firm offers aftermarket parts and service, equipment customization, remanufacturing, financing solutions, and asset disposal services. The company was founded in 1996 and is headquartered in Kansas City, MO. |
| Insider Trading |
Relationship |
Date |
Transaction |
Cost |
#Shares |
Value ($) |
#Shares Total |
SEC Form 4 |
| NELSON GEORGIA R | Director | May 08 '24 | Buy | 4.12 | 12,000 | 49,387 | 83,586 | May 09 05:31 PM | | McMonagle Ryan | Chief Executive Officer | May 08 '24 | Buy | 4.04 | 10,000 | 40,356 | 496,587 | May 10 10:34 AM | | Heinberg Marshall | Director | May 07 '24 | Buy | 4.07 | 40,000 | 162,916 | 293,856 | May 08 09:40 PM | | Eperjesy Christopher J | Chief Financial Officer | May 07 '24 | Buy | 3.90 | 20,000 | 78,000 | 176,962 | May 08 09:40 PM | | BARRETT RAYMOND TODD | Chief Accounting Officer | May 07 '24 | Buy | 4.12 | 3,000 | 12,360 | 40,464 | May 08 09:41 PM |
|
|
|
