 |
| Market Cap | 2.09B | EPS (ttm) | 3.48 |
| P/E | 24.06 | EPS this Y | 18.76% |
| Forward P/E | 16.10 | EPS next Y | 18.81% |
| PEG | 1.07 | EPS past 5Y | 32.14% |
| P/S | 5.16 | EPS next 5Y | 22.50% |
| P/B | 4.17 | EPS Q/Q | 52.23% |
| Dividend | - | Sales Q/Q | 31.91% |
| Insider Own | 2.95% | Inst Own | 87.21% |
| Insider Trans | -9.13% | Inst Trans | 1.11% |
| Short Float | 1.86% | Earnings | May 02/a |
| Analyst Recom | 1.89 | Target Price | 91.83 |
| Avg Volume | 176.32K | 52W Range | 46.09 - 86.25 |
|
|
|
|
Palomar Holdings, Inc. is a specialty insurance company, which engages in the provision of property and casualty insurance products to individuals and businesses. The firm focuses on the residential and commercial earthquake markets in earthquake-exposed states such as California, Oregon, and Washington and states with exposure to the New Madrid Seismic Zone. It offers property and casualty insurance. The company was founded by Armstrong Mac and Fisher Heath in February 2014 and is headquartered in La Jolla, CA. |
| Insider Trading |
Relationship |
Date |
Transaction |
Cost |
#Shares |
Value ($) |
#Shares Total |
SEC Form 4 |
| BRADLEY THOMAS A | Director | May 07 '24 | Buy | 84.32 | 1,000 | 84,324 | 2,500 | May 08 06:08 PM | | Armstrong Mac | CEO and Chairman | Apr 22 '24 | Sale | 80.03 | 7,000 | 560,240 | 468,388 | Apr 24 04:49 PM | | Uchida T Christopher | Chief Financial Officer | Apr 17 '24 | Option Exercise | 15.00 | 1,000 | 15,000 | 26,344 | Apr 18 04:39 PM | | Christianson Jon | President | Apr 17 '24 | Sale | 76.30 | 2,000 | 152,595 | 57,761 | Apr 18 04:39 PM | | Uchida T Christopher | Chief Financial Officer | Apr 17 '24 | Sale | 76.30 | 1,000 | 76,296 | 25,344 | Apr 18 04:39 PM |
|
|
 |
 |
| Market Cap | 149.97B | EPS (ttm) | 2.84 |
| P/E | 43.74 | EPS this Y | 20.91% |
| Forward P/E | 20.73 | EPS next Y | 25.28% |
| PEG | 1.94 | EPS past 5Y | -4.02% |
| P/S | 14.49 | EPS next 5Y | 22.59% |
| P/B | 21.70 | EPS Q/Q | 870.06% |
| Dividend | 3.32% | Sales Q/Q | 2.73% |
| Insider Own | 41.51% | Inst Own | 41.07% |
| Insider Trans | -1.49% | Inst Trans | 0.80% |
| Short Float | 3.09% | Earnings | Apr 18/b |
| Analyst Recom | 2.48 | Target Price | 124.12 |
| Avg Volume | 3.73M | 52W Range | 78.97 - 133.08 |
|
|
|
|
Blackstone, Inc. engages in the provision of investment and fund management services. It operates through the following segments: Real Estate, Private Equity, Credit and Insurance, and Hedge Fund Solutions. The Real Estate segment includes management of opportunistic real estate funds, Core+ real estate funds, high-yield real estate debt funds, and liquid real estate debt funds. The Private Equity segment consists of management of flagship corporate private equity funds, sector and geographically focused corporate private equity funds, core private equity funds, an opportunistic investment platform, a secondary fund of funds business, infrastructure-focused funds, a life sciences investment platform, a growth equity investment platform, a multi-asset investment program for eligible high net worth investors and a capital markets services business. The Credit and Insurance segment refers to Blackstone Credit, which is organized into two overarching strategies: private credit which includes mezzanine direct lending funds, private placement strategies, stressed and distressed strategies and energy strategies, and liquid credit which consists of CLOs, closed-ended funds, open ended funds and separately managed accounts. In addition, the segment includes an insurer-focused platform, an asset-based finance platform, and publicly traded master limited partnership investment platform. The Hedge Fund Solutions segment focuses on Blackstone Alternative Asset Management, which manages a broad range of commingled and customized hedge fund of fund solutions. It also includes a GP Stakes business and investment platforms that invest directly, as well as investment platforms that seed new hedge fund businesses and create alternative solutions through daily liquidity products. The company was founded by Stephen Allen Schwarzman in 1985 and is headquartered in New York, NY. |
| Insider Trading |
Relationship |
Date |
Transaction |
Cost |
#Shares |
Value ($) |
#Shares Total |
SEC Form 4 |
| Porat Ruth | Director | May 06 '24 | Buy | 119.48 | 219 | 26,192 | 34,445 | May 08 05:23 PM | | Porat Ruth | Director | May 06 '24 | Buy | 119.95 | 58 | 6,929 | 8,406 | May 08 05:23 PM | | BX Buzz ML-1 GP LLC | 10% Owner | Mar 03 '24 | Sale | 11.10 | 2,509,316 | 27,845,378 | 12,802 | Mar 05 06:34 PM | | Brown Reginald J | Director | Feb 21 '24 | Buy | 125.62 | 2,400 | 301,500 | 16,949 | Feb 21 05:05 PM | | Blackstone Inc. | 10% Owner | Feb 16 '24 | Sale | 12.04 | 24,276,100 | 292,405,624 | 107,324 | Feb 21 04:40 PM |
|
|
|
 |
| Market Cap | 5.97B | EPS (ttm) | 6.53 |
| P/E | 10.80 | EPS this Y | 78.19% |
| Forward P/E | 6.61 | EPS next Y | 5.97% |
| PEG | 0.54 | EPS past 5Y | 286.70% |
| P/S | 1.05 | EPS next 5Y | 20.00% |
| P/B | 1.21 | EPS Q/Q | 125.25% |
| Dividend | 2.56% | Sales Q/Q | 6.70% |
| Insider Own | 0.74% | Inst Own | 85.51% |
| Insider Trans | 1.63% | Inst Trans | -8.21% |
| Short Float | 1.16% | Earnings | May 01/a |
| Analyst Recom | 2.00 | Target Price | 75.83 |
| Avg Volume | 614.10K | 52W Range | 51.61 - 70.35 |
|
|
|
|
AXIS Capital Holdings Ltd. engages in the provision of various insurance and reinsurance products and services. It operates through the Insurance and Reinsurance segments. The Insurance segment offers property, marine, terrorism, aviation, political risk, professional lines, liability, accident, and health insurance products. The Reinsurance segment offers non-life treaty reinsurance to insurance companies. The company was founded on December 9, 2002, and is headquartered in Pembroke, Bermuda. |
| Insider Trading |
Relationship |
Date |
Transaction |
Cost |
#Shares |
Value ($) |
#Shares Total |
SEC Form 4 |
| BECKER W MARSTON | Director | May 06 '24 | Buy | 66.58 | 3,025 | 201,404 | 21,821 | May 08 05:10 PM | | GALANSKI STANLEY A | Director | Feb 06 '24 | Buy | 58.45 | 7,000 | 409,150 | 9,763 | Feb 07 08:50 PM | | SMITH HENRY B | Director | Aug 07 '23 | Sale | 55.50 | 6,000 | 333,000 | 49,710 | Aug 07 05:01 PM |
|
|
| |
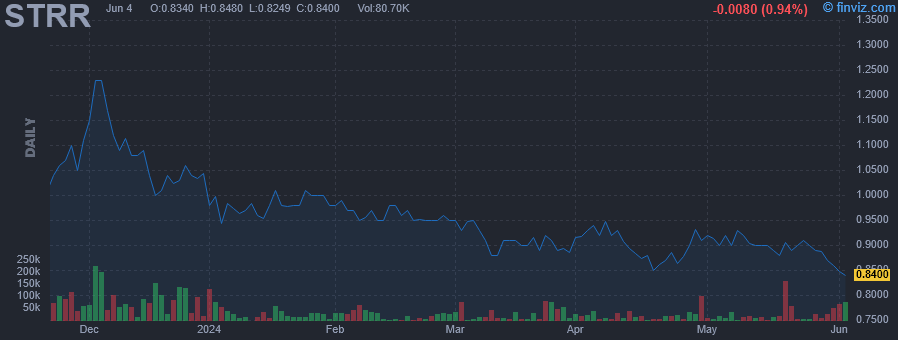 |
| Market Cap | 14.33M | EPS (ttm) | 1.47 |
| P/E | 0.61 | EPS this Y | -35.00% |
| Forward P/E | - | EPS next Y | 48.15% |
| PEG | 0.04 | EPS past 5Y | 39.31% |
| P/S | 0.24 | EPS next 5Y | 16.00% |
| P/B | 0.31 | EPS Q/Q | -14.27% |
| Dividend | - | Sales Q/Q | -56.10% |
| Insider Own | 31.33% | Inst Own | 4.09% |
| Insider Trans | 19.91% | Inst Trans | -5.80% |
| Short Float | 2.44% | Earnings | Mar 22/b |
| Analyst Recom | 1.00 | Target Price | 5.00 |
| Avg Volume | 24.01K | 52W Range | 0.75 - 1.59 |
|
|
|
|
Star Equity Holdings, Inc. is a holding company. It operates under the Construction and Investments segments. The Construction segment is involved in manufacturing modular housing units and providing other building components for commercial and residential real estate projects. The Investments segment focuses on managing and financing the company's real estate assets as well as its investment positions in private and public companies. The company was founded in 1997 and is headquartered in Old Greenwich, CT. |
| Insider Trading |
Relationship |
Date |
Transaction |
Cost |
#Shares |
Value ($) |
#Shares Total |
SEC Form 4 |
| Star Equity Fund, LP | 10% Owner | May 08 '24 | Buy | 0.24 | 24,733 | 5,817 | 2,029,829 | May 08 05:08 PM | | Star Equity Fund, LP | 10% Owner | May 07 '24 | Buy | 0.20 | 800 | 161 | 2,005,096 | May 08 05:08 PM | | Star Equity Fund, LP | 10% Owner | May 06 '24 | Buy | 0.20 | 18,572 | 3,705 | 2,004,296 | May 08 05:08 PM | | Star Equity Fund, LP | 10% Owner | Feb 23 '24 | Buy | 0.29 | 15,952 | 4,551 | 1,985,724 | Feb 23 05:23 PM | | Star Equity Fund, LP | 10% Owner | Feb 21 '24 | Buy | 0.28 | 150,000 | 42,015 | 1,969,772 | Feb 23 05:23 PM |
|
|
|
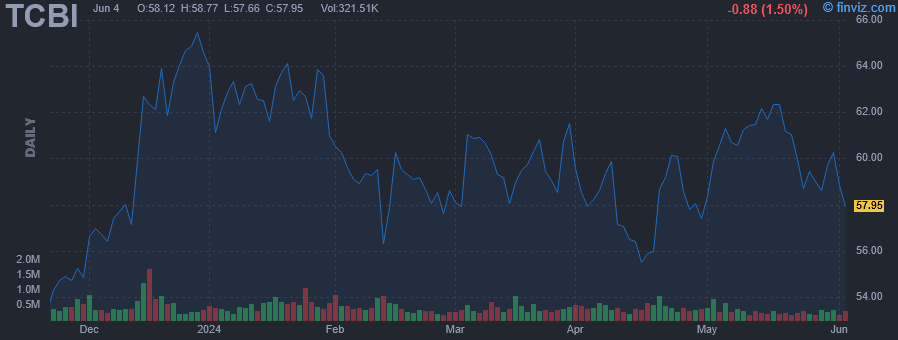 |
| Market Cap | 2.87B | EPS (ttm) | 3.30 |
| P/E | 18.63 | EPS this Y | -1.16% |
| Forward P/E | 14.38 | EPS next Y | 22.10% |
| PEG | 2.33 | EPS past 5Y | -9.39% |
| P/S | 1.57 | EPS next 5Y | 8.00% |
| P/B | 1.01 | EPS Q/Q | -34.89% |
| Dividend | - | Sales Q/Q | 8.14% |
| Insider Own | 1.87% | Inst Own | 104.67% |
| Insider Trans | 10.66% | Inst Trans | -3.81% |
| Short Float | 4.48% | Earnings | Apr 18/b |
| Analyst Recom | 2.93 | Target Price | 63.04 |
| Avg Volume | 431.37K | 52W Range | 42.79 - 66.18 |
|
|
|
|
Texas Capital Bancshares, Inc. is a holding company, which engages in the provision of financial services and customized solutions to businesses, entrepreneurs, and individual customers. The company was founded by George F. Jones, Jr. and Joseph M. Grant in November 1996 and is headquartered in Dallas, TX. |
| Insider Trading |
Relationship |
Date |
Transaction |
Cost |
#Shares |
Value ($) |
#Shares Total |
SEC Form 4 |
| STALLINGS ROBERT W | Director | May 07 '24 | Buy | 19.70 | 3,000 | 59,100 | 153,706 | May 08 05:07 PM | | ROSENBERG STEVE | Director | Apr 24 '24 | Option Exercise | 0.00 | 1,631 | 0 | 6,265 | Apr 25 07:17 PM | | Hyle Charles S | Director | Apr 24 '24 | Option Exercise | 0.00 | 1,631 | 0 | 13,020 | Apr 25 07:22 PM | | STALLINGS ROBERT W | Director | Apr 18 '24 | Option Exercise | 0.00 | 1,631 | 0 | 283,631 | Apr 25 07:23 PM | | Browning James H | Director | Apr 18 '24 | Option Exercise | 0.00 | 1,631 | 0 | 19,974 | Apr 25 07:24 PM |
|
|
| |
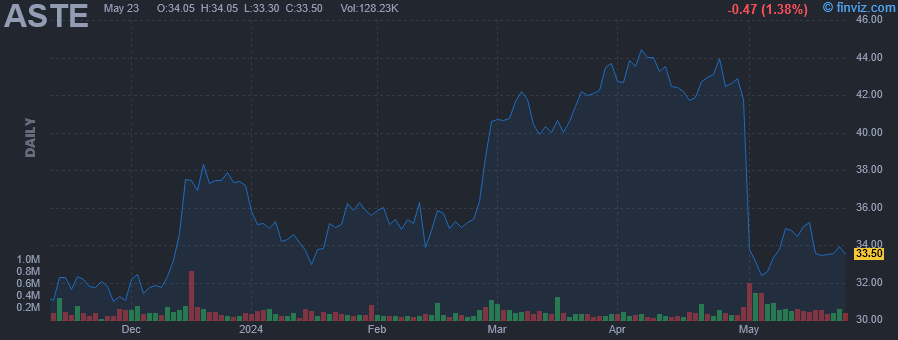 |
| Market Cap | 792.85M | EPS (ttm) | 1.09 |
| P/E | 32.02 | EPS this Y | -19.73% |
| Forward P/E | 12.69 | EPS next Y | 27.99% |
| PEG | 3.20 | EPS past 5Y | - |
| P/S | 0.61 | EPS next 5Y | 10.00% |
| P/B | 1.22 | EPS Q/Q | -72.01% |
| Dividend | 1.49% | Sales Q/Q | -11.12% |
| Insider Own | 2.17% | Inst Own | 92.34% |
| Insider Trans | 0.20% | Inst Trans | -1.64% |
| Short Float | 2.02% | Earnings | May 01/b |
| Analyst Recom | 2.33 | Target Price | 40.67 |
| Avg Volume | 161.11K | 52W Range | 28.97 - 56.33 |
|
|
|
|
Astec Industries, Inc. engages in the design, engineer, manufacture, and market of equipment and components used in road building and construction activities. It operates through the following segments: Infrastructure Solutions, Material Solutions, and Corporate and Other. The Infrastructure Solutions segment designs, engineers, manufactures, and markets a complete line of asphalt plants, concrete plants, and ancillary equipment, as well as supplying asphalt road construction equipment, industrial thermal systems, and heavy equipment. The Material Solutions segment designs and manufactures heavy processing equipment, in addition to servicing and supplying parts for the aggregate, metallic mining, recycling, ports, and bulk handling industries. The Corporate and Other segment is involved in the controls and automation business, through the firm's parent company, Astec Insurance. The company was founded by J. Don Brock in 1972 and is headquartered in Chattanooga, TN. |
| Insider Trading |
Relationship |
Date |
Transaction |
Cost |
#Shares |
Value ($) |
#Shares Total |
SEC Form 4 |
| NORRIS MICHAEL PAUL | GROUP PRESIDENT | May 08 '24 | Buy | 33.46 | 1,000 | 33,460 | 15,886 | May 08 04:57 PM |
|
|
|
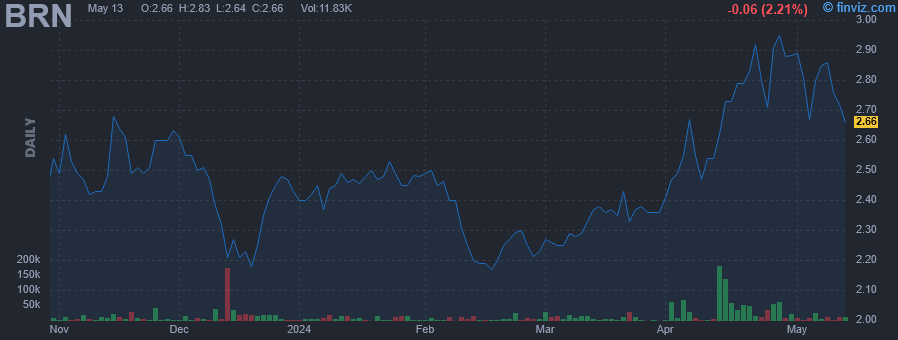 |
| Market Cap | 27.36M | EPS (ttm) | -0.27 |
| P/E | - | EPS this Y | - |
| Forward P/E | - | EPS next Y | - |
| PEG | - | EPS past 5Y | 14.73% |
| P/S | 1.14 | EPS next 5Y | - |
| P/B | 1.50 | EPS Q/Q | -160.69% |
| Dividend | 1.10% | Sales Q/Q | -15.06% |
| Insider Own | 53.26% | Inst Own | 12.88% |
| Insider Trans | 5.65% | Inst Trans | 3.06% |
| Short Float | 0.21% | Earnings | - |
| Analyst Recom | - | Target Price | - |
| Avg Volume | 21.61K | 52W Range | 2.06 - 2.99 |
|
|
|
Feb-20-24 06:00AM
|
Barnwell Industries, Inc. Announces Planned CEO Succession
(GlobeNewswire) |
|
Feb-12-24 06:00AM
|
Barnwell Industries, Inc. Reports First Quarter Results
(GlobeNewswire) |
|
Dec-20-23 08:30AM
|
Joshua S. Horowitz Elected Chairman of the Board of Directors of BK Technologies
(ACCESSWIRE) |
|
Dec-15-23 06:05PM
|
Barnwell Industries, Inc. Reports Fourth Quarter and Year End Results
(GlobeNewswire) |
|
Dec-14-23 06:00AM
|
Barnwell Industries, Inc. Announces Entry into Agreement for the Sale of Water Resources International, Inc. for Gross Proceeds of $2,000,000
(GlobeNewswire) |
|
Aug-11-23 04:55PM
|
Barnwell Industries, Inc. Reports Third Quarter and Nine Months Ended June 30, 2023 Results
(GlobeNewswire) |
|
May-15-23 06:00AM
|
Barnwell Industries, Inc. Reports Results for its Second Quarter and Six Months Ended March 31, 2023 and the Declaration of a Cash Dividend
(GlobeNewswire) |
|
Feb-23-23 04:07PM
|
12 High Growth Penny Stocks that are Profitable
(Insider Monkey) +6.02% |
|
Feb-10-23 06:00AM
|
Barnwell Industries, Inc. Reports Earnings for its First Quarter Ended December 31, 2022 and the Declaration of a Cash Dividend
(GlobeNewswire) |
|
Jan-23-23 06:00AM
|
Barnwell Industries, Inc. Reaches Cooperation and Support Agreement With its Largest Stockholders
(GlobeNewswire) |
|
Barnwell Industries, Inc. engages in the oil and natural gas exploration, land investment, and contract drilling services. It operates through the following segments: Oil and Natural Gas, Land Investment, and Contract Drilling. The Oil and Natural Gas segment engages in the exploration, development, production and sale of oil and natural gas in Canada. The Land Investment segment invests in land interest in Hawaii. The Contract Drilling segment provides well drilling services and water pumping system installation and repairs in Hawaii. The company was founded by Morton H. Kinzler in 1956 and is headquartered in Honolulu, HI. |
| Insider Trading |
Relationship |
Date |
Transaction |
Cost |
#Shares |
Value ($) |
#Shares Total |
SEC Form 4 |
| SHERWOOD NED L | 10% Owner | May 08 '24 | Buy | 2.84 | 1,906 | 5,413 | 2,717,083 | May 08 04:50 PM | | SHERWOOD NED L | 10% Owner | May 07 '24 | Buy | 2.80 | 352 | 986 | 2,715,177 | May 08 04:50 PM | | SHERWOOD NED L | 10% Owner | May 06 '24 | Buy | 2.79 | 6,524 | 18,202 | 2,714,825 | May 08 04:50 PM | | SHERWOOD NED L | 10% Owner | Apr 25 '24 | Buy | 2.80 | 21,276 | 59,573 | 2,708,301 | Apr 26 05:01 PM | | SHERWOOD NED L | 10% Owner | Apr 24 '24 | Buy | 2.71 | 17,048 | 46,200 | 2,687,025 | Apr 26 05:01 PM |
|
|
| |
 |
| Market Cap | 5.20B | EPS (ttm) | 2.34 |
| P/E | 10.91 | EPS this Y | 4.95% |
| Forward P/E | 15.56 | EPS next Y | 4.17% |
| PEG | - | EPS past 5Y | 7.93% |
| P/S | 1.17 | EPS next 5Y | -1.10% |
| P/B | 1.75 | EPS Q/Q | 162.73% |
| Dividend | 1.96% | Sales Q/Q | -30.13% |
| Insider Own | 3.81% | Inst Own | 72.13% |
| Insider Trans | 0.47% | Inst Trans | 0.31% |
| Short Float | 1.44% | Earnings | May 02/b |
| Analyst Recom | 3.00 | Target Price | 26.00 |
| Avg Volume | 1.34M | 52W Range | 18.04 - 25.78 |
|
|
|
|
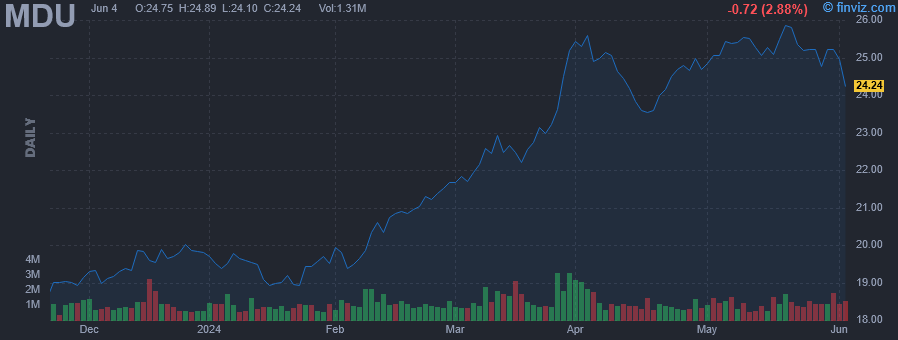
MDU Resources Group, Inc. engages in the provision of natural resource products and related services to energy and transportation infrastructure. It operates through the following business segments: Electric, Natural Gas Distribution, Pipeline and Midstream, Construction Materials and Contracting, Construction Services, and others. The Electric segment generates, transmits and distributes electricity in Montana, North Dakota, South Dakota, and Wyoming. The Natural Gas Distribution segment distributes natural gas in Montana, North Dakota, South Dakota, Wyoming, Idaho, Minnesota, Oregon, and Washington. The Pipeline and Midstream segment offers natural gas transportation, underground storage, processing and gathering services, as well as oil gathering, through regulated and non-regulated pipeline systems and processing facilities. The Construction Materials and Contracting segment mines aggregates and markets crushed stone, sand, gravel and related construction materials, including ready-mixed concrete, cement, asphalt, liquid asphalt and other value-added products. The Construction Services segment refers to the inside and outside specialty contracting services. The company was founded by C. C. Yawkey, R.M. Heskett and Walter Alexander on March 14,1924, and is headquartered in Bismarck, ND. |
| Insider Trading |
Relationship |
Date |
Transaction |
Cost |
#Shares |
Value ($) |
#Shares Total |
SEC Form 4 |
| Johnson Rob L. | President-WBI Holdings | May 07 '24 | Buy | 25.46 | 36,291 | 923,970 | 41,934 | May 08 04:44 PM | | Rosenthal Dale | Director | Mar 12 '24 | Buy | 22.55 | 375 | 8,456 | 16,499 | Mar 13 05:31 PM |
|
|
|
 |
| Market Cap | 2.45B | EPS (ttm) | -7.46 |
| P/E | - | EPS this Y | 59.14% |
| Forward P/E | 19.96 | EPS next Y | 161.25% |
| PEG | - | EPS past 5Y | - |
| P/S | 0.39 | EPS next 5Y | 9.09% |
| P/B | 0.79 | EPS Q/Q | -124.83% |
| Dividend | - | Sales Q/Q | -3.97% |
| Insider Own | 1.01% | Inst Own | 92.99% |
| Insider Trans | -7.33% | Inst Trans | - |
| Short Float | 19.78% | Earnings | May 02/b |
| Analyst Recom | 2.19 | Target Price | 22.71 |
| Avg Volume | 6.32M | 52W Range | 13.50 - 29.38 |
|
|
|
|
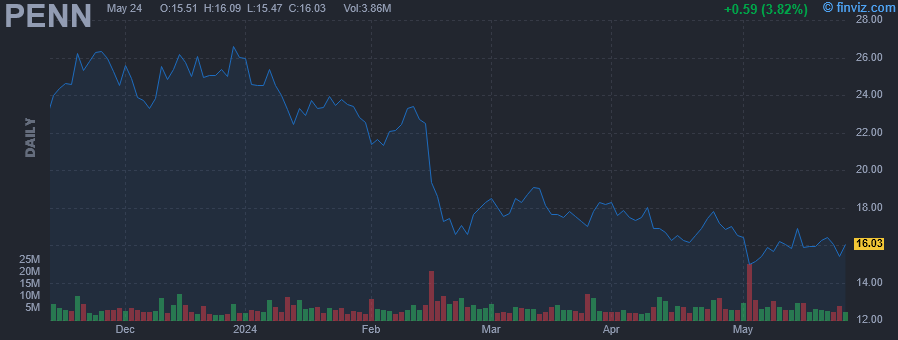
PENN Entertainment, Inc. owns and manages gaming and racing facilities and video gaming terminal operations with a focus on slot machine entertainment. It operates through the following business segments: Northeast, South, West, Midwest, Interactive, and Other. The Northeast segment consists of properties including Ameristar East Chicago, Greektown Casino-Hotel, and Hollywood Casino Bangor. The South segment operates properties including 1st Jackpot Casino, Ameristar Vicksburg, and Boomtown Biloxi. The West segment includes Ameristar Black Hawk, Cactus Pete's and Horseshu, and M Resort. The Midwest segment consists of properties including Ameristar Council Bluffs, Argosy Casino Alton, and Argosy Casino Riverside. The Interactive segment operates the online sports betting and casino applications. The Other segment manages properties including Freehold Raceway, Retama Park Racetrack, and Sanford-Orlando Kennel Club. The company was founded by Peter M. Carlino in 1982 and is headquartered in Wyomissing, PA. |
| Insider Trading |
Relationship |
Date |
Transaction |
Cost |
#Shares |
Value ($) |
#Shares Total |
SEC Form 4 |
| HANDLER DAVID A | Director | May 07 '24 | Buy | 15.84 | 20,000 | 316,850 | 20,000 | May 08 04:44 PM | | HANDLER DAVID A | Director | May 06 '24 | Buy | 15.37 | 20,000 | 307,386 | 243,450 | May 08 04:44 PM | | Hendrix Felicia | EVP and CFO | May 06 '24 | Buy | 15.47 | 16,157 | 249,997 | 68,596 | May 08 04:44 PM | | Rogers Christopher Byron | EVP and Chief Strategy Officer | Jan 03 '24 | Option Exercise | 14.10 | 7,074 | 99,743 | 35,231 | Jan 05 04:47 PM | | George Todd | EVP, Operations | Jan 03 '24 | Option Exercise | 14.10 | 5,375 | 75,788 | 44,347 | Jan 05 04:47 PM |
|
|
|
 |
| Market Cap | 629.65M | EPS (ttm) | -1.83 |
| P/E | - | EPS this Y | -25.16% |
| Forward P/E | - | EPS next Y | -43.50% |
| PEG | - | EPS past 5Y | 29.57% |
| P/S | 12.59 | EPS next 5Y | - |
| P/B | 2.41 | EPS Q/Q | 1.98% |
| Dividend | - | Sales Q/Q | 52.08% |
| Insider Own | 6.42% | Inst Own | 98.76% |
| Insider Trans | -28.33% | Inst Trans | -0.28% |
| Short Float | 13.55% | Earnings | May 08/b |
| Analyst Recom | 1.20 | Target Price | 39.11 |
| Avg Volume | 1.17M | 52W Range | 5.67 - 30.99 |
|
|
|
|
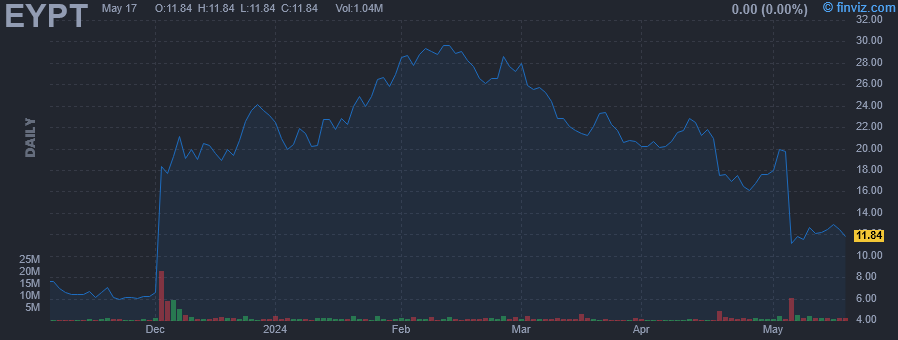
EyePoint Pharmaceuticals, Inc. is a biopharmaceutical company, which engages in the development and commercialization of therapeutics that treat eye disorders. It offers FDA-approved sustained-release treatments in ophthalmology under the DEXYCU, ILUVIEN, Verisome, Retisert, and Durasert brands. The company was founded in 1987 and is headquartered in Watertown, MA. |
| Insider Trading |
Relationship |
Date |
Transaction |
Cost |
#Shares |
Value ($) |
#Shares Total |
SEC Form 4 |
| Cormorant Asset Management, LP | 10% Owner | May 06 '24 | Buy | 11.86 | 850,000 | 10,081,721 | 8,325,000 | May 08 04:23 PM | | Cormorant Asset Management, LP | 10% Owner | Apr 18 '24 | Buy | 18.03 | 581,765 | 10,489,446 | 7,475,000 | Apr 22 04:00 PM | | Paggiarino Dario A. | Chief Medical Officer | Mar 30 '24 | Option Exercise | 0.00 | 50,404 | 0 | 92,626 | Apr 02 05:27 PM | | Duker Jay S. | President and CEO | Feb 09 '24 | Option Exercise | 0.00 | 11,967 | 0 | 55,453 | Feb 13 05:37 PM | | Lurker Nancy | Executive Vice Chair | Feb 09 '24 | Option Exercise | 0.00 | 37,534 | 0 | 172,975 | Feb 13 05:40 PM |
|
|
|
