 |
| Market Cap | 373.88M | EPS (ttm) | 0.79 |
| P/E | 17.30 | EPS this Y | - |
| Forward P/E | - | EPS next Y | - |
| PEG | - | EPS past 5Y | - |
| P/S | 106.43 | EPS next 5Y | - |
| P/B | 0.85 | EPS Q/Q | - |
| Dividend | 7.39% | Sales Q/Q | 34.40% |
| Insider Own | - | Inst Own | 35.89% |
| Insider Trans | - | Inst Trans | - |
| Short Float | 0.07% | Earnings | - |
| Analyst Recom | - | Target Price | - |
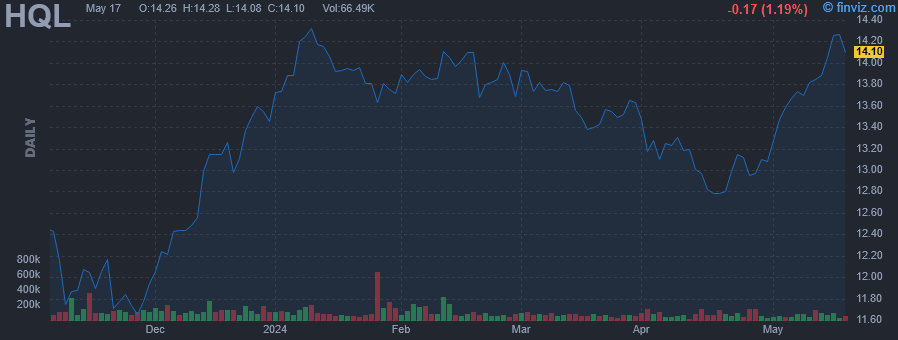
| Avg Volume | 92.89K | 52W Range | 11.34 - 14.37 |
|
|
|
|
Tekla Life Sciences Investors is a closed-ended equity mutual fund launched and managed by Tekla Capital Management LLC. The fund invests in public equity markets across the globe. It seeks to invest in stocks of companies operating in the life sciences sector, including the biotechnology, pharmaceutical, diagnostics, managed healthcare, medical equipment, hospitals, healthcare information technology and services, devices and supplies industries, and in agriculture and environmental management industries. The fund primarily invests in growth stocks of small cap companies. It employs fundamental analysis with a focus on factors such as market position for services or products, experience of business management, technological expertise, and the ability either to generate funds internally to finance growth or to secure outside sources of capital to create its portfolio. The fund benchmarks the performance of its portfolio against the NASDAQ Biotech Index and the S&P 500 Index. It was formerly known as H&Q Life Sciences Investors fund. Tekla Life Sciences Investors was formed on February 20, 1992 and is domiciled in the United States. |
| Insider Trading |
Relationship |
Date |
Transaction |
Cost |
#Shares |
Value ($) |
#Shares Total |
SEC Form 4 |
| Saba Capital Management, L.P. | 10% Owner | May 02 '24 | Buy | 13.46 | 26,274 | 353,648 | 3,068,730 | May 02 04:50 PM | | Saba Capital Management, L.P. | 10% Owner | May 01 '24 | Buy | 13.02 | 252 | 3,281 | 3,042,456 | May 02 04:50 PM | | Saba Capital Management, L.P. | 10% Owner | Apr 30 '24 | Buy | 13.13 | 16,573 | 217,603 | 3,042,204 | May 01 10:23 AM | | Saba Capital Management, L.P. | 10% Owner | Apr 26 '24 | Buy | 13.00 | 120,304 | 1,563,952 | 3,025,602 | Apr 29 04:54 PM | | Saba Capital Management, L.P. | 10% Owner | Apr 25 '24 | Buy | 12.99 | 97,574 | 1,267,486 | 2,905,298 | Apr 26 11:40 AM |
|
|
 |
 |
| Market Cap | 450.40M | EPS (ttm) | -0.66 |
| P/E | - | EPS this Y | - |
| Forward P/E | - | EPS next Y | - |
| PEG | - | EPS past 5Y | - |
| P/S | - | EPS next 5Y | - |
| P/B | - | EPS Q/Q | - |
| Dividend | 8.79% | Sales Q/Q | - |
| Insider Own | - | Inst Own | 40.44% |
| Insider Trans | - | Inst Trans | - |
| Short Float | 0.18% | Earnings | - |
| Analyst Recom | - | Target Price | - |
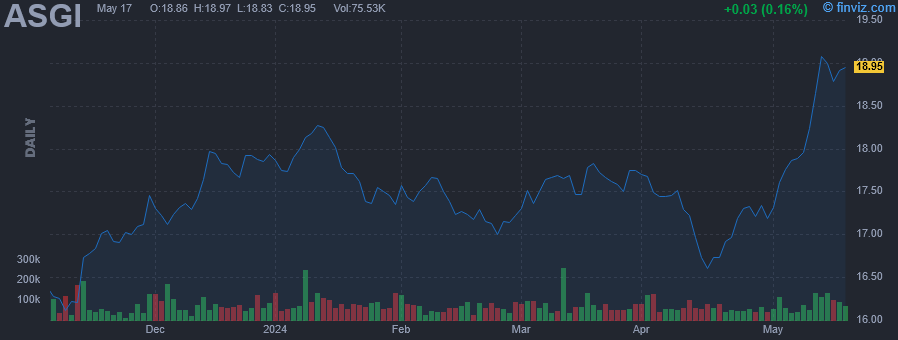
| Avg Volume | 71.59K | 52W Range | 14.96 - 18.55 |
|
|
|
|
Abrdn Global Infrastructure Income Fund seeks investment results that correspond generally to the price and yield performance, before fees and expenses, of the Northern Trust Real Assets Allocation IndexSM.Under normal circumstances, the fund will invest at least 80% of its total assets (exclusive of collateral held from securities lending) in the securities of the underlying index. The underlying index measures the performance of an optimized allocation to the underlying funds that is intended to provide exposures to certain real assets and minimize overall volatility of investment in the underlying funds. |
| Insider Trading |
Relationship |
Date |
Transaction |
Cost |
#Shares |
Value ($) |
#Shares Total |
SEC Form 4 |
| Saba Capital Management, L.P. | 10% Owner | May 02 '24 | Buy | 17.51 | 58,011 | 1,015,773 | 2,889,010 | May 02 04:47 PM | | Saba Capital Management, L.P. | 10% Owner | May 01 '24 | Buy | 17.20 | 18,556 | 319,163 | 2,830,999 | May 02 04:47 PM | | Saba Capital Management, L.P. | 10% Owner | Apr 29 '24 | Buy | 17.37 | 15,132 | 262,843 | 2,812,434 | May 01 10:21 AM | | Saba Capital Management, L.P. | 10% Owner | Apr 25 '24 | Buy | 17.27 | 34,547 | 596,627 | 2,797,302 | Apr 26 11:36 AM | | Saba Capital Management, L.P. | 10% Owner | Apr 23 '24 | Buy | 17.11 | 13,691 | 234,253 | 2,762,755 | Apr 23 07:56 PM |
|
|
|
 |
| Market Cap | 192.42M | EPS (ttm) | 3.76 |
| P/E | 8.07 | EPS this Y | -28.04% |
| Forward P/E | 9.06 | EPS next Y | 15.52% |
| PEG | - | EPS past 5Y | 13.51% |
| P/S | 1.56 | EPS next 5Y | - |
| P/B | 0.79 | EPS Q/Q | -28.77% |
| Dividend | 3.95% | Sales Q/Q | 36.68% |
| Insider Own | 25.85% | Inst Own | 43.54% |
| Insider Trans | 3.45% | Inst Trans | -0.39% |
| Short Float | 1.84% | Earnings | Apr 25/a |
| Analyst Recom | 3.00 | Target Price | 33.00 |
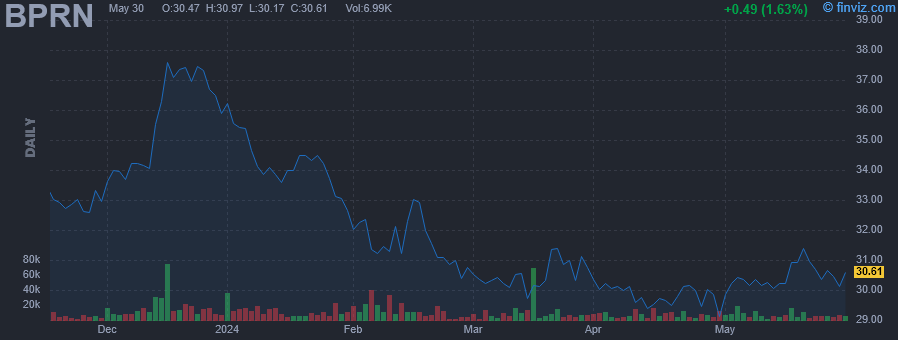
| Avg Volume | 10.92K | 52W Range | 23.49 - 38.19 |
|
|
|
|
Princeton Bancorp, Inc. operates as a bank holding company. It is a full-service financial institution that provides business and personal banking. It offers traditional retail banking services, one-to-four-family residential mortgage loans, multi-family and commercial mortgage loans, construction loans, commercial business loans, and consumer loans, including home equity loans and lines of credit. The company was founded in 2017 and is headquartered in Princeton, NJ. |
| Insider Trading |
Relationship |
Date |
Transaction |
Cost |
#Shares |
Value ($) |
#Shares Total |
SEC Form 4 |
| TUCHMAN MARTIN | Director | May 01 '24 | Buy | 29.35 | 105 | 3,081 | 90,924 | May 02 04:35 PM | | TUCHMAN MARTIN | Director | Apr 30 '24 | Buy | 29.43 | 2,000 | 58,850 | 90,819 | May 02 04:35 PM | | TUCHMAN MARTIN | Director | Mar 15 '24 | Buy | 29.75 | 10,000 | 297,500 | 600,141 | Mar 18 09:08 AM | | TUCHMAN MARTIN | Director | Mar 15 '24 | Buy | 29.74 | 5,000 | 148,720 | 88,819 | Mar 18 09:08 AM | | TUCHMAN MARTIN | Director | Mar 12 '24 | Buy | 29.99 | 3,168 | 95,000 | 590,141 | Mar 14 03:02 PM |
|
|
| |
 |
| Market Cap | 70.26B | EPS (ttm) | 5.69 |
| P/E | 9.84 | EPS this Y | -16.24% |
| Forward P/E | 6.87 | EPS next Y | 11.29% |
| PEG | 4.77 | EPS past 5Y | - |
| P/S | 0.19 | EPS next 5Y | 2.06% |
| P/B | 0.95 | EPS Q/Q | -46.91% |
| Dividend | 4.48% | Sales Q/Q | 3.60% |
| Insider Own | 0.18% | Inst Own | 82.53% |
| Insider Trans | -0.85% | Inst Trans | 0.60% |
| Short Float | 1.44% | Earnings | May 01/b |
| Analyst Recom | 1.90 | Target Price | 72.87 |
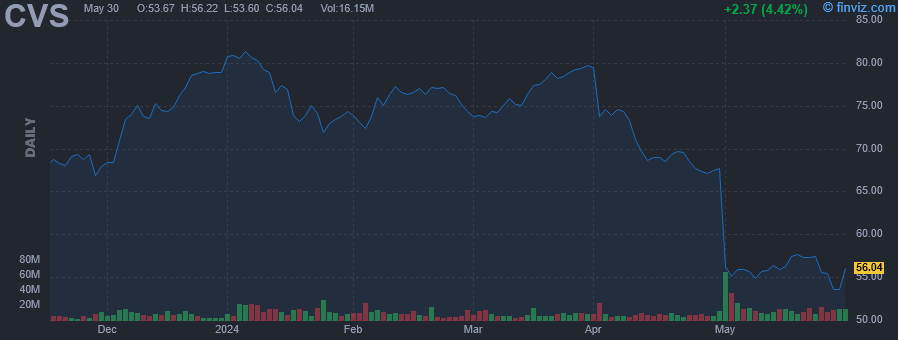
| Avg Volume | 10.83M | 52W Range | 53.70 - 83.25 |
|
|
| Today | Downgrade |
TD Cowen |
Buy → Hold |
$99 → $59 |
|
|
|
CVS Health Corp. is a health solutions company, which engages in the provision of healthcare services. It operates through the following segments: Health Care Benefits, Health Services, Pharmacy and Consumer Wellness, and Corporate and Other. The Health Care Benefits segment operates as a health care benefits provider. The Health Services segment offers a full range of PBM solutions, delivers health care services in its medical clinics, virtually, and in the home. The Pharmacy & Consumer Wellness segment dispenses prescriptions in its retail pharmacies and through its infusion operations. The Corporate and Other Segment is involved in management and administrative expenses. The company was founded by Stanley P. Goldstein and Ralph Hoagland in 1963 and is headquartered in Woonsocket, RI. |
| Insider Trading |
Relationship |
Date |
Transaction |
Cost |
#Shares |
Value ($) |
#Shares Total |
SEC Form 4 |
| Mahoney Michael F | Director | May 02 '24 | Buy | 54.49 | 9,181 | 500,294 | 9,356 | May 02 04:30 PM | | LUDWIG EDWARD J | Director | May 02 '24 | Buy | 53.88 | 1,000 | 53,879 | 21,630 | May 02 04:31 PM | | Shah Prem S | EVP and Pres-Pharm, Consumer W | Feb 16 '24 | Sale | 76.95 | 29,473 | 2,267,947 | 39,765 | Feb 16 06:46 PM | | LUDWIG EDWARD J | Director | Nov 03 '23 | Buy | 70.47 | 2,000 | 140,930 | 20,630 | Nov 06 10:59 AM | | Clark James David | SVP, Cont & Chief Acct Officer | Aug 03 '23 | Sale | 74.92 | 25,759 | 1,930,004 | 4,698 | Aug 04 05:41 PM |
|
|
|
 |
| Market Cap | 11.69M | EPS (ttm) | - |
| P/E | - | EPS this Y | - |
| Forward P/E | - | EPS next Y | - |
| PEG | - | EPS past 5Y | - |
| P/S | - | EPS next 5Y | - |
| P/B | - | EPS Q/Q | - |
| Dividend | - | Sales Q/Q | - |
| Insider Own | - | Inst Own | 65.02% |
| Insider Trans | - | Inst Trans | 0.11% |
| Short Float | 0.67% | Earnings | - |
| Analyst Recom | - | Target Price | - |
| Avg Volume | 3.82K | 52W Range | 7.79 - 12.66 |
|
|
|
|
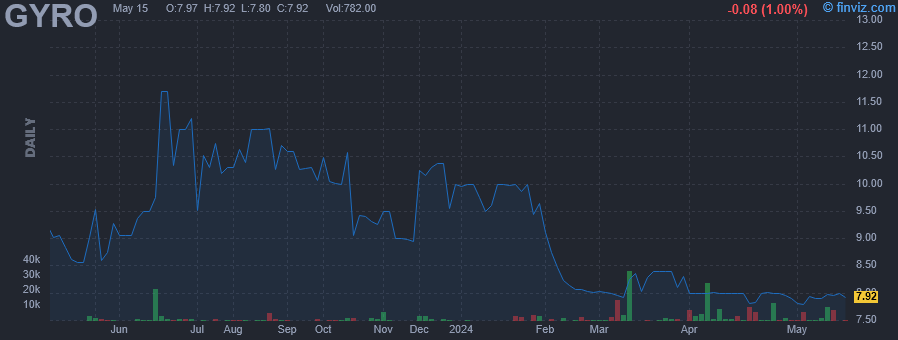
Gyrodyne LLC engages in the management of a portfolio of medical office and industrial properties. Its properties include Flowerfield, Port Jefferson Professional Park, Courtland Medical Center, and Grove. The company was founded by Peter James Papadakos in 1946 and is headquartered in St. James, NY. |
| Insider Trading |
Relationship |
Date |
Transaction |
Cost |
#Shares |
Value ($) |
#Shares Total |
SEC Form 4 |
| TOWERVIEW LLC | 10% Owner | May 02 '24 | Buy | 7.80 | 1,846 | 14,399 | 347,000 | May 02 04:18 PM | | TOWERVIEW LLC | 10% Owner | May 01 '24 | Buy | 7.83 | 424 | 3,320 | 345,154 | May 02 04:18 PM | | TOWERVIEW LLC | 10% Owner | Apr 16 '24 | Buy | 7.84 | 2,434 | 19,083 | 344,730 | Apr 18 08:54 AM | | LAMB PAUL L | Director | Apr 01 '24 | Sale | 7.99 | 4,368 | 34,916 | 111,328 | Apr 04 01:03 PM |
|
|
| |
 |
| Market Cap | 3.03B | EPS (ttm) | 4.23 |
| P/E | 29.05 | EPS this Y | 34.01% |
| Forward P/E | 20.76 | EPS next Y | 18.86% |
| PEG | 1.48 | EPS past 5Y | - |
| P/S | 2.59 | EPS next 5Y | 19.60% |
| P/B | 1.84 | EPS Q/Q | 1525.52% |
| Dividend | 1.95% | Sales Q/Q | 13.11% |
| Insider Own | 3.32% | Inst Own | 92.76% |
| Insider Trans | -1.60% | Inst Trans | -6.12% |
| Short Float | 1.68% | Earnings | Apr 25/b |
| Analyst Recom | 1.00 | Target Price | 136.25 |
| Avg Volume | 119.16K | 52W Range | 64.53 - 121.29 |
|
|
|
|
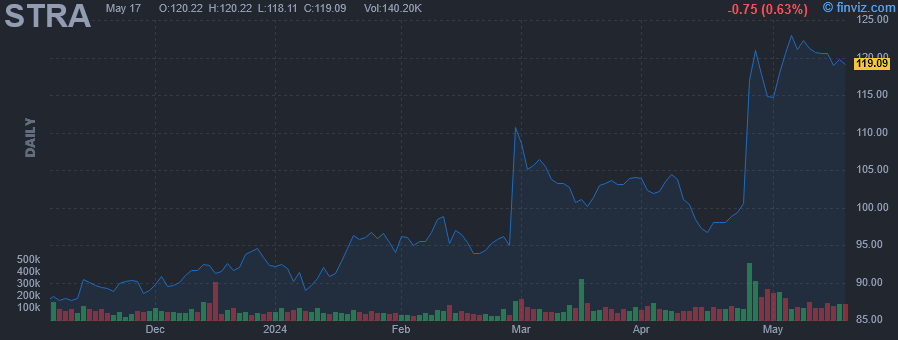
Strategic Education, Inc. engages in the provision of educational services. It provides access to education through campus-based and online post-secondary education offerings, as well as through programs to develop job-ready skills. The firm operates through three segments: U.S. Higher Education, Education Technology Services and Australia/New Zealand. The U.S. Higher Education segment primarily consists of Strayer University and Capella University and focuses on providing flexible and affordable certificate and degree programs to working adults. The Education Technology Services segment focuses on developing and maintaining relationships with employers to build employee education benefits programs. The Australia/New Zealand segment through Torrens University and associated assets, provides certificate and degree programs in Australia and New Zealand. The company was founded in 1892 and is headquartered in Herndon, VA. |
| Insider Trading |
Relationship |
Date |
Transaction |
Cost |
#Shares |
Value ($) |
#Shares Total |
SEC Form 4 |
| GILLIGAN J KEVIN | Vice Chairman | May 04 '29 | Sale | 148.88 | 739 | 110,022 | 6,293 | May 05 04:36 PM | | GRUSKY ROBERT R | Director | May 06 '24 | Sale | 122.50 | 350 | 42,875 | 11,345 | May 06 04:08 PM | | GRUSKY ROBERT R | Director | May 02 '24 | Sale | 118.55 | 250 | 29,638 | 11,695 | May 06 04:08 PM | | DINH VIET D | Director | Apr 30 '24 | Buy | 114.83 | 4,300 | 493,769 | 15,020 | May 02 04:14 PM | | GRUSKY ROBERT R | Director | Apr 29 '24 | Sale | 120.99 | 462 | 55,897 | 11,945 | May 01 04:39 PM |
|
|
|
 |
| Market Cap | 125.57M | EPS (ttm) | 2.60 |
| P/E | 6.35 | EPS this Y | -59.54% |
| Forward P/E | 11.38 | EPS next Y | 10.27% |
| PEG | - | EPS past 5Y | 18.59% |
| P/S | 0.96 | EPS next 5Y | - |
| P/B | 0.64 | EPS Q/Q | -64.11% |
| Dividend | 2.42% | Sales Q/Q | 12.20% |
| Insider Own | 9.81% | Inst Own | 55.65% |
| Insider Trans | 0.65% | Inst Trans | -2.06% |
| Short Float | 2.14% | Earnings | Apr 22/b |
| Analyst Recom | 2.00 | Target Price | 20.75 |
| Avg Volume | 24.43K | 52W Range | 14.97 - 25.97 |
|
|
|
|
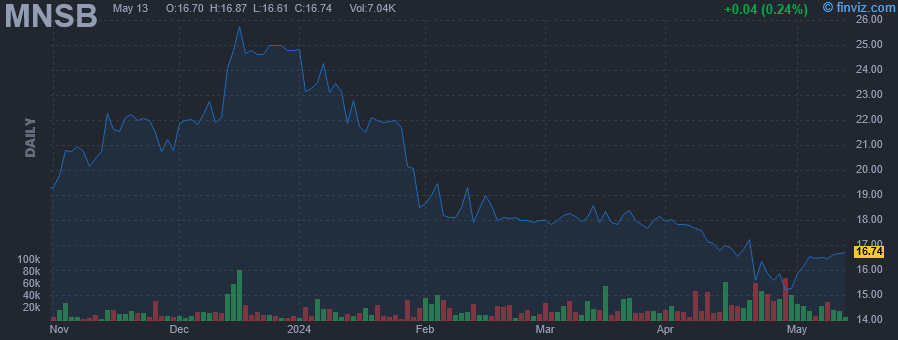
MainStreet Bancshares, Inc. is a holding company, which engages in the provision of banking solutions through MainStreet Bank. It offers products and services such as checking, deposits, loans, credit cards, mortgages, and savings. The company was founded on March 28, 2003 and is headquartered in Fairfax, VA. |
| Insider Trading |
Relationship |
Date |
Transaction |
Cost |
#Shares |
Value ($) |
#Shares Total |
SEC Form 4 |
| ECHLOV RUSSELL | Director | May 02 '24 | Buy | 16.02 | 200 | 3,204 | 4,003 | May 02 04:14 PM | | DICK JEFF W | Chairman, President and CEO | Apr 29 '24 | Buy | 16.12 | 1,056 | 17,018 | 191,133 | Apr 29 11:28 AM | | ECHLOV RUSSELL | Director | Apr 26 '24 | Buy | 15.62 | 200 | 3,124 | 3,803 | Apr 26 08:44 AM | | Brockett Charles C. | Director | Apr 24 '24 | Buy | 16.40 | 710 | 11,644 | 92,318 | Apr 25 07:35 AM | | Brockett Charles C. | Director | Apr 24 '24 | Buy | 16.40 | 450 | 7,380 | 852 | Apr 25 07:35 AM |
|
|
| |
 |
| Market Cap | 131.84B | EPS (ttm) | 0.96 |
| P/E | 32.26 | EPS this Y | 8.97% |
| Forward P/E | 15.64 | EPS next Y | 73.09% |
| PEG | 0.81 | EPS past 5Y | -38.29% |
| P/S | 2.39 | EPS next 5Y | 39.84% |
| P/B | 1.24 | EPS Q/Q | 86.47% |
| Dividend | 1.67% | Sales Q/Q | 8.61% |
| Insider Own | 0.06% | Inst Own | 65.84% |
| Insider Trans | 0.55% | Inst Trans | -1.78% |
| Short Float | 1.79% | Earnings | Apr 25/a |
| Analyst Recom | 2.76 | Target Price | 39.49 |
| Avg Volume | 49.31M | 52W Range | 26.85 - 51.28 |
|
|
|
|
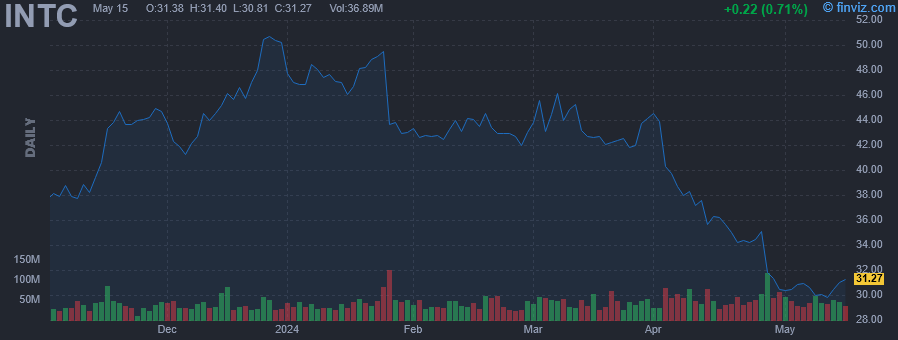
Intel Corp. engages in the design, manufacture, and sale of computer products and technologies. It delivers computer, networking, data storage, and communications platforms. The firm operates through the following segments: Client Computing Group (CCG), Data Center and AI (DCAI), Network and Edge (NEX), Mobileye, Accelerated Computing Systems and Graphics (AXG), Intel Foundry Services (IFS), and All Other. The CCG segment consists of platforms designed for notebooks, 2-in-1 systems, desktops, tablets, phones, wireless and wired connectivity products, and mobile communication components. The DCAI segment delivers solutions to cloud service providers and enterprise customers, along with silicon devices for communications service providers and high-performance computing customers. The NEX segment offers computing system solutions from inflexible fixed-function hardware to general-purpose compute, acceleration, and networking devices running cloud native software on programmable hardware. The Mobileye segment develops driving assistance and self-driving solutions. The AXG segment provides products and technologies designed to help customers solve the toughest computational problems. Its products include CPUs for high-performance computing and GPUs targeted for a range of workloads and platforms, from gaming and content creation on client devices to delivering media and gaming in the cloud, and the most demanding high-performance computing and AI workloads on supercomputers. The IFS segment refers to full stack solutions created from the foundry industry ecosystem. The All Other segment represents results from other non-reportable segments and corporate-related charges. The company was founded by Robert Norton Noyce and Gordon Earle Moore on July 18, 1968, and is headquartered in Santa Clara, CA. |
| Insider Trading |
Relationship |
Date |
Transaction |
Cost |
#Shares |
Value ($) |
#Shares Total |
SEC Form 4 |
| GELSINGER PATRICK P | CEO | May 01 '24 | Buy | 30.29 | 4,100 | 124,173 | 39,375 | May 02 04:12 PM | | GELSINGER PATRICK P | CEO | Apr 29 '24 | Buy | 31.42 | 4,000 | 125,674 | 35,275 | May 01 04:05 PM | | GELSINGER PATRICK P | CEO | Feb 01 '24 | Buy | 42.74 | 2,800 | 119,671 | 31,275 | Feb 02 04:27 PM | | GELSINGER PATRICK P | CEO | Jan 29 '24 | Buy | 43.36 | 3,000 | 130,083 | 28,475 | Jan 30 04:56 PM | | GELSINGER PATRICK P | CEO | Nov 01 '23 | Buy | 36.80 | 6,775 | 249,333 | 25,475 | Nov 02 05:40 PM |
|
|
|
 |
| Market Cap | 14.73B | EPS (ttm) | 5.32 |
| P/E | 17.25 | EPS this Y | -26.56% |
| Forward P/E | 13.90 | EPS next Y | 5.52% |
| PEG | 1.15 | EPS past 5Y | 4.11% |
| P/S | 3.25 | EPS next 5Y | 15.00% |
| P/B | 2.31 | EPS Q/Q | -21.99% |
| Dividend | 2.98% | Sales Q/Q | -9.29% |
| Insider Own | 0.37% | Inst Own | 87.23% |
| Insider Trans | -3.51% | Inst Trans | 1.45% |
| Short Float | 4.48% | Earnings | Apr 30/a |
| Analyst Recom | 2.67 | Target Price | 102.32 |
| Avg Volume | 2.48M | 52W Range | 85.06 - 115.69 |
|
|
|
May-06-24 01:58PM
|
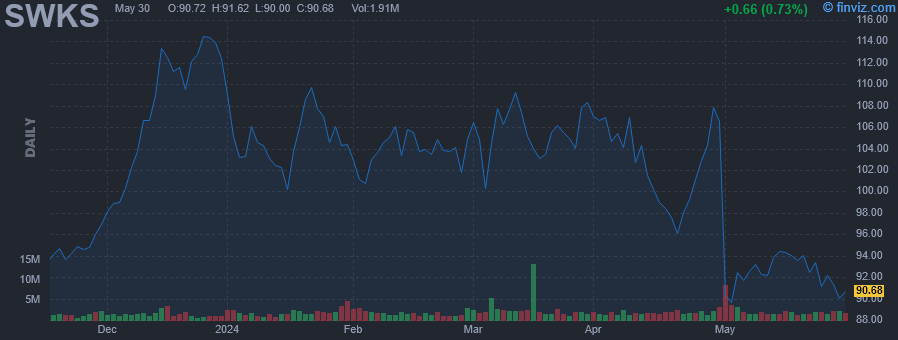
Hedge Fund and Insider Trading News: Michael Platt, Bill Ackman, Warren Buffet, Third Point LLC, Shah Capital, Skyworks Solutions Inc (SWKS), Heartland Express, Inc. (HTLD), and More
(Insider Monkey) |
|
May-03-24 06:21PM
|
Why Skyworks Solutions Stock Sank This Week
(Motley Fool) |
|
May-02-24 04:43PM
|
Skyworks Solutions Insider Bought Shares Worth $1,002,780, According to a Recent SEC Filing
(MT Newswires) |
|
04:13PM
|
Qualcomm Stock Breaks Out On Beat-And-Raise Report
(Investor's Business Daily) |
|
02:19PM
|
3 5G Technology Stocks With the Potential to Make You an Overnight Millionaire
(InvestorPlace) |
|
May-01-24 07:52PM
|
Analyst Report: Skyworks Solutions, Inc.
(Morningstar Research) -15.28% |
|
05:04PM
|
Qualcomm Delivers Beat-And-Raise Report As Diversification Efforts Pay Off
(Investor's Business Daily) |
|
04:54PM
|
S&P 500 Gains and Losses Today: CVS Falls as Health Care Costs Pressure Profits
(Investopedia) |
|
04:52PM
|
Nvidia Stock Drops After Rival AMD Gives Uninspiring Outlook
(Investor's Business Daily) |
|
04:30PM
|
These Stocks Moved the Most Today: CVS, AMD, Super Micro, Amazon, Starbucks, Pfizer, Norwegian, Pinterest, DuPont, and More
(Barrons.com) |
|
Skyworks Solutions, Inc. engages in the design, development, and manufacture of proprietary semiconductor products. Its products include amplifiers, attenuators, circulators, demodulators, detectors, diodes, directional couplers, front-end modules, hybrids, isolators, lighting and display solutions, mixers, modulators, optocouplers, opt isolators, phase shifters, synthesizers, power dividers and combiners, receivers, switches, and technical ceramics. The company was founded in 1962 and is headquartered in Irvine, CA. |
| Insider Trading |
Relationship |
Date |
Transaction |
Cost |
#Shares |
Value ($) |
#Shares Total |
SEC Form 4 |
| GRIFFIN LIAM | Chairman, CEO and President | May 02 '24 | Buy | 90.00 | 11,142 | 1,002,780 | 104,153 | May 02 04:03 PM | | Durham Karilee A | SVP, Human Resources | Dec 14 '23 | Sale | 110.00 | 3,189 | 350,790 | 17,323 | Dec 15 06:38 PM | | Kasnavi Reza | SVP, Tech. & Manufacturing | Nov 17 '23 | Sale | 94.04 | 5,289 | 497,378 | 19,078 | Nov 20 06:30 PM | | TERRY ROBERT JOHN | SVP, Gen. Counsel & Secretary | Nov 14 '23 | Sale | 91.65 | 4,457 | 408,497 | 14,045 | Nov 16 06:30 PM | | Kasnavi Reza | SVP, Tech. & Manufacturing | Nov 13 '23 | Sale | 89.09 | 3,873 | 345,046 | 24,367 | Nov 14 06:47 PM |
|
|
|
 |
| Market Cap | 416.85M | EPS (ttm) | -0.19 |
| P/E | - | EPS this Y | - |
| Forward P/E | - | EPS next Y | - |
| PEG | - | EPS past 5Y | - |
| P/S | 12.92 | EPS next 5Y | - |
| P/B | 0.98 | EPS Q/Q | - |
| Dividend | 11.67% | Sales Q/Q | 37.90% |
| Insider Own | - | Inst Own | 26.77% |
| Insider Trans | - | Inst Trans | - |
| Short Float | 0.31% | Earnings | - |
| Analyst Recom | - | Target Price | - |
| Avg Volume | 110.66K | 52W Range | 9.24 - 12.16 |
|
|
|
|
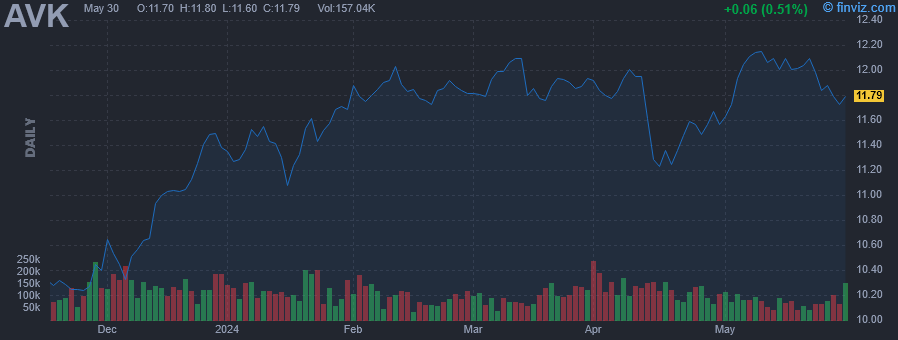
Advent Claymore Convertible Securities and Income Fund is a closed-ended fixed income mutual fund launched and managed by Advent Capital Management, LLC. The fund primarily invests in the fixed income markets of the United States. It seeks to invest in securities of companies operating across the diversified sectors. The fund invests approximately 60% of its portfolio in convertible securities and rest in lower-grade non-convertible income securities. It employs fundamental analysis to create its portfolio. Advent Claymore Convertible Securities and Income Fund was formed on April 29, 2003 and is domiciled in the United States. |
| Insider Trading |
Relationship |
Date |
Transaction |
Cost |
#Shares |
Value ($) |
#Shares Total |
SEC Form 4 |
| Stuebe Nancy E. | TRUSTEE | May 02 '24 | Buy | 11.71 | 500 | 5,855 | 4,552 | May 02 03:24 PM | | Stuebe Nancy E. | TRUSTEE | Feb 02 '24 | Buy | 11.86 | 400 | 4,745 | 3,933 | Feb 02 01:11 PM | | MAITLAND TRACY V | CHAIRMAN, PRESIDENT & CEO | Dec 20 '23 | Sale | 11.17 | 7,163 | 80,011 | 34,087 | Dec 22 11:56 AM | | Stuebe Nancy E. | TRUSTEE | Aug 02 '23 | Buy | 11.84 | 375 | 4,440 | 2,922 | Aug 02 10:12 AM | | ADVENT CAPITAL MANAGEMENT /DE/ | INVESTMENT MANAGER | Jul 18 '23 | Sale | 11.72 | 19,048 | 223,191 | 0 | Jul 18 04:47 PM |
|
|
|
