 |
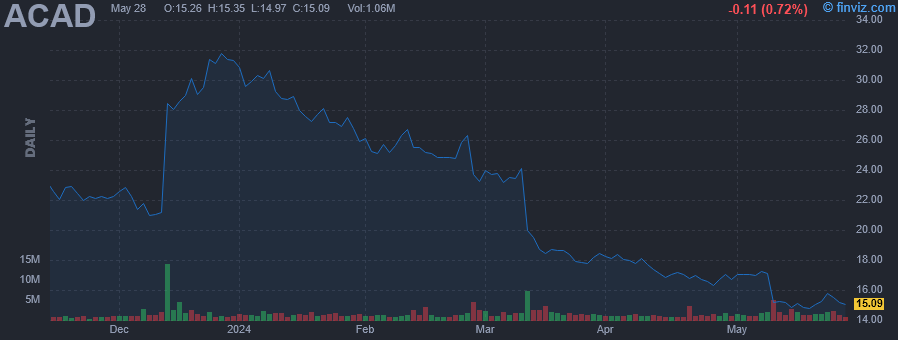
| Market Cap | 2.82B | EPS (ttm) | -0.38 |
| P/E | - | EPS this Y | 273.60% |
| Forward P/E | 13.57 | EPS next Y | 95.66% |
| PEG | - | EPS past 5Y | 28.03% |
| P/S | 3.88 | EPS next 5Y | - |
| P/B | 6.50 | EPS Q/Q | 206.75% |
| Dividend | - | Sales Q/Q | 69.27% |
| Insider Own | 0.80% | Inst Own | 96.66% |
| Insider Trans | -7.57% | Inst Trans | 0.91% |
| Short Float | 6.81% | Earnings | May 08/a |
| Analyst Recom | 1.71 | Target Price | 28.79 |
| Avg Volume | 1.81M | 52W Range | 16.16 - 33.99 |
|
|
|
|
ACADIA Pharmaceuticals, Inc. engages in the development and commercialization of medicines for central nervous system disorders. Its products include Nuplazid, which is used for the treatment of hallucinations and delusions associated with Parkinson's disease psychosis. The company was founded by Mark R. Brann on July 16, 1993 and is headquartered in San Diego, CA. |
| Insider Trading |
Relationship |
Date |
Transaction |
Cost |
#Shares |
Value ($) |
#Shares Total |
SEC Form 4 |
| DAVIS STEPHEN | CEO | May 02 '24 | Sale | 16.94 | 11,427 | 193,573 | 155,231 | May 03 06:00 PM | | Schneyer Mark C. | EVP, CHIEF FINANCIAL OFFICER | May 02 '24 | Sale | 16.94 | 3,503 | 59,341 | 32,053 | May 03 06:00 PM | | Teehan Brendan | EVP, COO, HEAD OF COMMERCIAL | May 02 '24 | Sale | 16.94 | 3,477 | 58,900 | 42,133 | May 03 06:00 PM | | Kihara James | PRINCIPAL ACCOUNTING OFFICER | May 02 '24 | Sale | 16.94 | 1,326 | 22,462 | 14,370 | May 03 06:00 PM | | DAVIS STEPHEN | CEO | Apr 08 '24 | Sale | 17.87 | 26,574 | 474,877 | 144,267 | Apr 09 06:00 PM |
|
|
 |
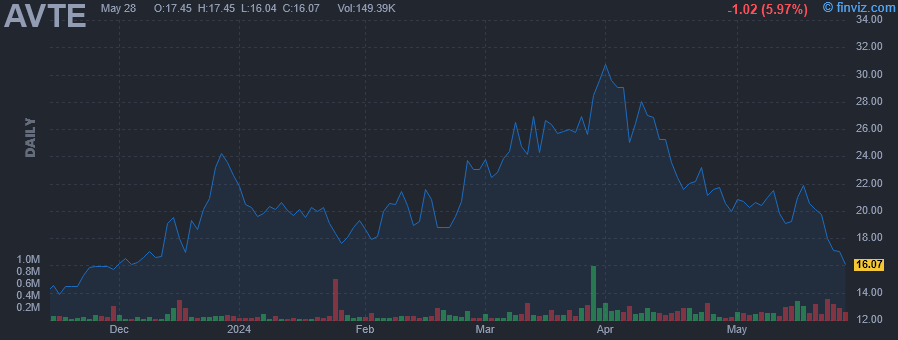 |
| Market Cap | 583.13M | EPS (ttm) | -2.87 |
| P/E | - | EPS this Y | -6.41% |
| Forward P/E | - | EPS next Y | -1.35% |
| PEG | - | EPS past 5Y | -114.14% |
| P/S | - | EPS next 5Y | - |
| P/B | 5.15 | EPS Q/Q | -20.76% |
| Dividend | - | Sales Q/Q | - |
| Insider Own | 37.26% | Inst Own | 63.26% |
| Insider Trans | -2.58% | Inst Trans | 4.38% |
| Short Float | 6.94% | Earnings | Mar 25/a |
| Analyst Recom | 1.00 | Target Price | 44.67 |
| Avg Volume | 143.71K | 52W Range | 9.41 - 32.42 |
|
|
|
|
Aerovate Therapeutics, Inc. is a biotechnology company which engages in the development of drugs for rare cardiopulmonary disease. It focuses on advancing AV-101, a dry powder inhaled formulation of imatinib for the treatment of pulmonary arterial hypertension. The company was founded by Benjamin T. Dake on July 27, 2018 and is headquartered in Waltham, MA. |
| Insider Trading |
Relationship |
Date |
Transaction |
Cost |
#Shares |
Value ($) |
#Shares Total |
SEC Form 4 |
| Verwijs Marinus | CHIEF TECHNICAL OFFICER | May 02 '24 | Sale | 21.02 | 1,981 | 41,631 | 0 | May 03 06:00 PM | | NOYES TIMOTHY P | CHIEF EXECUTIVE OFFICER | May 01 '24 | Option Exercise | 2.14 | 10,000 | 21,400 | 10,000 | May 03 06:00 PM | | NOYES TIMOTHY P | CHIEF EXECUTIVE OFFICER | May 01 '24 | Sale | 20.34 | 11,357 | 230,946 | 0 | May 03 06:00 PM | | Dake Benjamin T | SEE REMARKS | Apr 17 '24 | Option Exercise | 2.14 | 6,853 | 14,665 | 8,144 | Apr 19 06:00 PM | | Gillies Hunter | CHIEF MEDICAL OFFICER | Apr 17 '24 | Option Exercise | 1.74 | 4,000 | 6,960 | 7,251 | Apr 19 06:00 PM |
|
|
|
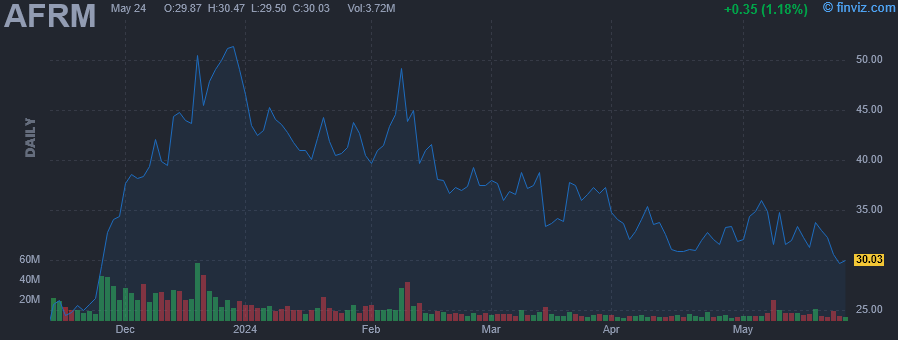 |
| Market Cap | 10.72B | EPS (ttm) | -2.49 |
| P/E | - | EPS this Y | 28.78% |
| Forward P/E | - | EPS next Y | 27.53% |
| PEG | - | EPS past 5Y | -58.94% |
| P/S | 5.60 | EPS next 5Y | - |
| P/B | 4.05 | EPS Q/Q | 50.58% |
| Dividend | - | Sales Q/Q | 47.94% |
| Insider Own | 20.47% | Inst Own | 70.07% |
| Insider Trans | -4.65% | Inst Trans | 4.91% |
| Short Float | 11.99% | Earnings | May 08/b |
| Analyst Recom | 2.89 | Target Price | 37.48 |
| Avg Volume | 7.77M | 52W Range | 8.80 - 52.48 |
|
|
|
|
Affirm Holdings, Inc. operates a platform for digital and mobile-first commerce. Its platform consists of three core elements: a point-of-sale payment solution for consumers, merchant commerce solutions, and a consumer-focused app. The company was founded by Max R. Levchin in 2012 and is headquartered in San Francisco, CA. |
| Insider Trading |
Relationship |
Date |
Transaction |
Cost |
#Shares |
Value ($) |
#Shares Total |
SEC Form 4 |
| Linford Michael | Chief Financial Officer | May 01 '24 | Option Exercise | 0.00 | 2,336 | 0 | 117,298 | May 03 05:59 PM | | Adkins Katherine | Chief Legal Officer | May 01 '24 | Option Exercise | 0.00 | 6,783 | 0 | 108,964 | May 03 05:59 PM | | Michalek Libor | President | May 01 '24 | Option Exercise | 0.00 | 2,336 | 0 | 145,390 | May 03 05:59 PM | | Rabois Keith | Director | May 01 '24 | Sale | 32.12 | 9,276 | 297,902 | 60,000 | May 03 05:59 PM | | Adkins Katherine | Chief Legal Officer | Apr 01 '24 | Option Exercise | 0.00 | 6,784 | 0 | 104,651 | Apr 03 06:01 PM |
|
|
| |
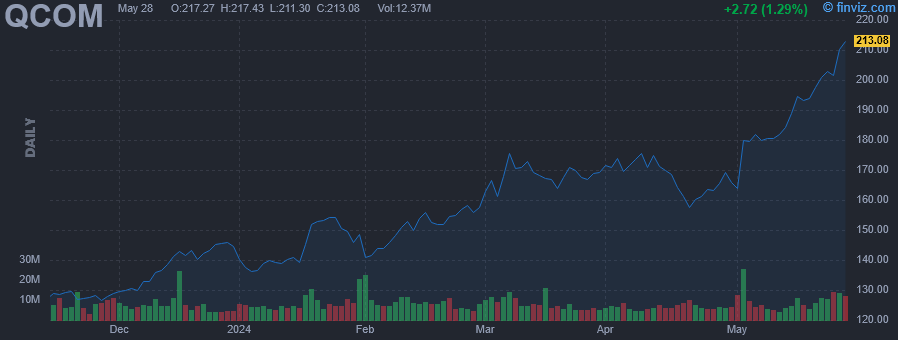 |
| Market Cap | 200.48B | EPS (ttm) | 7.44 |
| P/E | 24.14 | EPS this Y | 18.77% |
| Forward P/E | 15.74 | EPS next Y | 14.01% |
| PEG | 2.14 | EPS past 5Y | - |
| P/S | 5.51 | EPS next 5Y | 11.29% |
| P/B | 8.21 | EPS Q/Q | 35.65% |
| Dividend | 1.87% | Sales Q/Q | 1.23% |
| Insider Own | 0.21% | Inst Own | 76.53% |
| Insider Trans | -3.64% | Inst Trans | -0.30% |
| Short Float | 1.71% | Earnings | May 01/a |
| Analyst Recom | 1.95 | Target Price | 187.43 |
| Avg Volume | 8.41M | 52W Range | 101.47 - 181.69 |
|
|
|
Today 06:18AM
|
3 Internet of Things (IoT) Stocks with the Potential to Make You an Overnight Millionaire
(InvestorPlace) |
|
May-03-24 05:55PM
|
Qualcomm Insider Sold Shares Worth $1,456,000, According to a Recent SEC Filing
(MT Newswires) |
|
10:41AM
|
Digi International Inc. (NASDAQ:DGII) Q2 2024 Earnings Call Transcript
(Insider Monkey) |
|
08:00AM
|
How To Buy Stocks: Use 'Ants' Indicator To Spot Exceptional Demand
(Investor's Business Daily) |
|
06:30AM
|
Why It's Time to Pound the Table on Qualcomm Stock in 2024
(InvestorPlace) |
|
04:58AM
|
Qualcomm sees smartphone demand surge, eyes AI PC market entry
(DigiTimes) |
|
May-02-24 10:26PM
|
Qualcomm CEO on automotive investments: 'As new cars are launched you'll start to see the benefits'
(CNBC TV) +9.74% |
|
09:40PM
|
Qualcomm, MediaTek unfazed by Huawei rebound
(DigiTimes) |
|
04:57PM
|
US STOCKS-Wall Street ends higher as Fed signals dovish bias; jobs report eyed
(Reuters) |
|
04:27PM
|
These Stocks Are Moving the Most Today: Carvana, Fastly, Peloton, Wayfair, Qualcomm, Moderna, Howmet, Apple, Qorvo, and More
(Barrons.com) |
|
QUALCOMM, Inc. engages in developing and commercializing foundational technologies and products used in mobile devices and other wireless products. It operates through the following segments: Qualcomm CDMA Technologies (QCT), Qualcomm Technology Licensing (QTL), and Qualcomm Strategic Initiatives (QSI). The QCT segment develops and supplies integrated circuits and system software based on technologies for use in voice and data communications, networking, application processing, multimedia, and global positioning system products. The QTL segment grants licenses and provides rights to use portions of the firm's intellectual property portfolio. The QSI segment focuses on opening new or expanding opportunities for its technologies and supporting the design and introduction of new products and services for voice and data communications. The company was founded by Franklin P. Antonio, Adelia A. Coffman, Andrew Cohen, Klein Gilhousen, Irwin Mark Jacobs, Andrew J. Viterbi, and Harvey P. White in July 1985 and is headquartered in San Diego, CA. |
| Insider Trading |
Relationship |
Date |
Transaction |
Cost |
#Shares |
Value ($) |
#Shares Total |
SEC Form 4 |
| THOMPSON JAMES H | Chief Technology Officer | May 03 '24 | Sale | 182.00 | 8,000 | 1,456,000 | 253,893 | May 03 05:54 PM | | Palkhiwala Akash J. | CFO & COO | Apr 04 '24 | Sale | 173.49 | 3,000 | 520,480 | 69,343 | Apr 04 07:35 PM | | THOMPSON JAMES H | Chief Technology Officer | Apr 01 '24 | Sale | 168.27 | 8,000 | 1,346,160 | 261,893 | Apr 02 04:13 PM | | Miller Jamie S | Director | Mar 10 '24 | Option Exercise | 0.00 | 2,056 | 0 | 4,159 | Mar 11 05:08 PM | | Henderson Jeffrey William | Director | Mar 10 '24 | Option Exercise | 0.00 | 2,056 | 0 | 6,408 | Mar 11 05:09 PM |
|
|
|
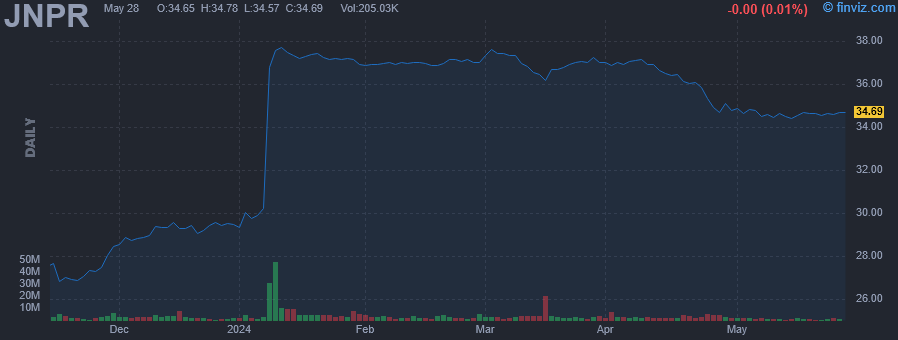 |
| Market Cap | 11.32B | EPS (ttm) | 0.69 |
| P/E | 50.47 | EPS this Y | -14.59% |
| Forward P/E | 15.50 | EPS next Y | 16.45% |
| PEG | 4.59 | EPS past 5Y | -9.86% |
| P/S | 2.12 | EPS next 5Y | 11.00% |
| P/B | 2.53 | EPS Q/Q | -100.96% |
| Dividend | 2.54% | Sales Q/Q | -16.25% |
| Insider Own | 1.31% | Inst Own | 91.92% |
| Insider Trans | -7.71% | Inst Trans | -0.69% |
| Short Float | 4.51% | Earnings | Apr 25/a |
| Analyst Recom | 3.00 | Target Price | 40.06 |
| Avg Volume | 3.54M | 52W Range | 24.87 - 38.04 |
|
|
|
|
Juniper Networks, Inc. engages in the business of designing, developing, and selling products and services for networks to enable customers to build networks for their businesses. The firm also offers routing, switching, Wi-Fi, network security, artificial intelligence-enabled enterprise networking operations, and software-defined networking technologies. The company was founded by Pradeep S. Sindhu on February 6, 1996 and is headquartered in Sunnyvale, CA. |
| Insider Trading |
Relationship |
Date |
Transaction |
Cost |
#Shares |
Value ($) |
#Shares Total |
SEC Form 4 |
| rahim rami | Chief Executive Officer | May 03 '24 | Sale | 34.86 | 5,555 | 193,640 | 986,764 | May 03 05:53 PM | | rahim rami | Chief Executive Officer | May 02 '24 | Sale | 34.72 | 5,555 | 192,890 | 992,319 | May 03 05:53 PM | | rahim rami | Chief Executive Officer | May 01 '24 | Sale | 34.83 | 5,555 | 193,504 | 997,874 | May 03 05:53 PM | | rahim rami | Chief Executive Officer | Apr 05 '24 | Sale | 37.06 | 5,555 | 205,875 | 1,003,429 | Apr 05 05:05 PM | | rahim rami | Chief Executive Officer | Apr 04 '24 | Sale | 37.03 | 5,555 | 205,694 | 1,008,984 | Apr 05 05:05 PM |
|
|
| |
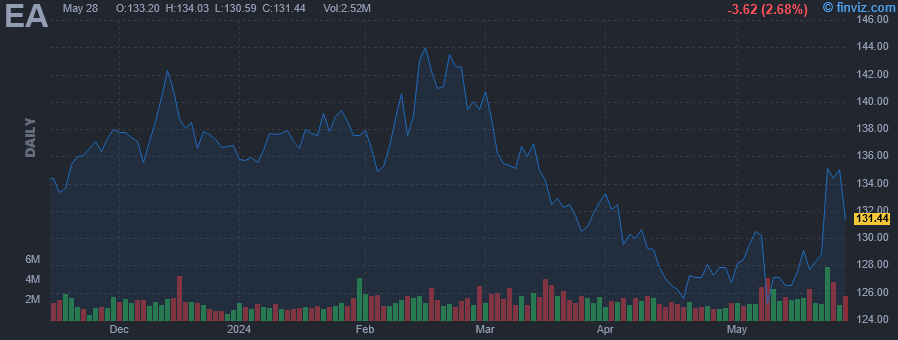 |
| Market Cap | 34.64B | EPS (ttm) | 3.96 |
| P/E | 32.71 | EPS this Y | 9.49% |
| Forward P/E | 17.05 | EPS next Y | 7.27% |
| PEG | 2.62 | EPS past 5Y | -2.89% |
| P/S | 4.58 | EPS next 5Y | 12.50% |
| P/B | 4.61 | EPS Q/Q | 45.83% |
| Dividend | 0.60% | Sales Q/Q | 6.50% |
| Insider Own | 9.56% | Inst Own | 85.04% |
| Insider Trans | -0.27% | Inst Trans | -0.26% |
| Short Float | 2.85% | Earnings | May 07/a |
| Analyst Recom | 2.06 | Target Price | 151.10 |
| Avg Volume | 2.08M | 52W Range | 117.47 - 144.53 |
|
|
|
|
Electronic Arts, Inc. engages in the development, marketing, publication, and distribution of games, content, and services for game consoles, PCs, mobile phones, and tablets. The company develops and publishes games and services across various genres, such as sports, first-person shooter, action, role-playing, and simulation primarily under the Battlefield, The Sims, Apex Legends, Anthem, Need for Speed, and Plants v. Zombies brands, and license games, including FIFA, Madden NFL, and Star Wars brands. The firm also provides advertising services and licenses its games to third parties to distribute and host its games. It markets and sells its games and services through digital distribution channels, as well as through retail channels, such as mass-market retailers, electronics specialty stores, and game software specialty stores. The company was founded by William M. Hawkins III and William Gordon in 1982 and is headquartered in Redwood City, CA. |
| Insider Trading |
Relationship |
Date |
Transaction |
Cost |
#Shares |
Value ($) |
#Shares Total |
SEC Form 4 |
| Hoskins Roche L Talbott | Director | May 01 '24 | Option Exercise | 128.18 | 183 | 23,457 | 22,306 | May 03 05:58 PM | | Gonzalez Rachel A | Director | May 01 '24 | Option Exercise | 128.18 | 177 | 22,688 | 5,338 | May 03 05:54 PM | | Huber Jeff | Director | May 01 '24 | Option Exercise | 128.18 | 161 | 20,637 | 14,077 | May 03 05:56 PM | | Simonson Richard A | Director | May 01 '24 | Option Exercise | 128.18 | 161 | 20,637 | 61,355 | May 03 06:01 PM | | Ueberroth Heidi | Director | May 01 '24 | Option Exercise | 128.18 | 155 | 19,868 | 8,410 | May 03 06:03 PM |
|
|
|
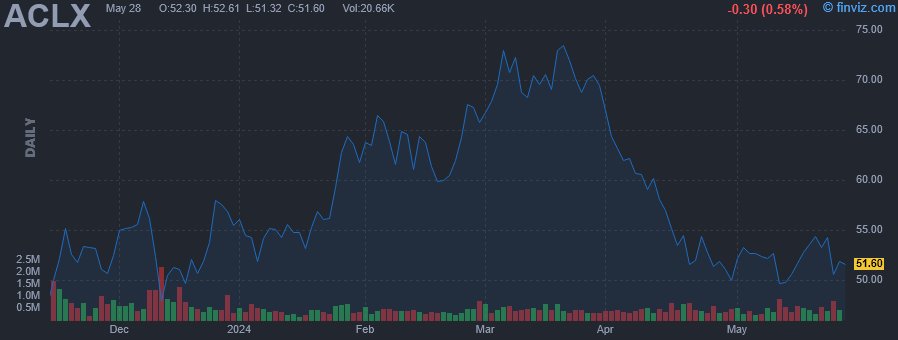 |
| Market Cap | 2.81B | EPS (ttm) | -1.51 |
| P/E | - | EPS this Y | -26.34% |
| Forward P/E | - | EPS next Y | -2.70% |
| PEG | - | EPS past 5Y | -29.89% |
| P/S | 25.45 | EPS next 5Y | - |
| P/B | 5.68 | EPS Q/Q | 142.94% |
| Dividend | - | Sales Q/Q | - |
| Insider Own | 25.35% | Inst Own | 73.96% |
| Insider Trans | -8.99% | Inst Trans | 15.29% |
| Short Float | 10.12% | Earnings | Feb 28/a |
| Analyst Recom | 1.13 | Target Price | 80.31 |
| Avg Volume | 457.98K | 52W Range | 30.74 - 75.10 |
|
|
|
|
Arcellx, Inc is a clinical-stage biotechnology company, which provides cell therapy through the development of innovative immunotherapies for patients with cancer and other incurable diseases. The company was founded by David M. Hilbert and Luba Zaritskaya in December 2014 and is headquartered in Gaithersburg, MD. |
| Insider Trading |
Relationship |
Date |
Transaction |
Cost |
#Shares |
Value ($) |
#Shares Total |
SEC Form 4 |
| Heery Christopher | CHIEF MEDICAL OFFICER | May 01 '24 | Option Exercise | 6.28 | 18,168 | 114,095 | 27,106 | May 03 05:50 PM | | Heery Christopher | CHIEF MEDICAL OFFICER | May 01 '24 | Sale | 51.33 | 18,168 | 932,557 | 8,938 | May 03 05:50 PM | | Ware Olivia C | Director | Apr 16 '24 | Option Exercise | 7.61 | 9,402 | 71,549 | 9,402 | Apr 18 04:01 PM | | Ware Olivia C | Director | Apr 16 '24 | Sale | 55.55 | 9,402 | 522,260 | 0 | Apr 18 04:01 PM | | Elghandour Rami | SEE REMARKS | Apr 01 '24 | Sale | 67.09 | 23,086 | 1,548,887 | 69,253 | Apr 03 04:44 PM |
|
|
| |
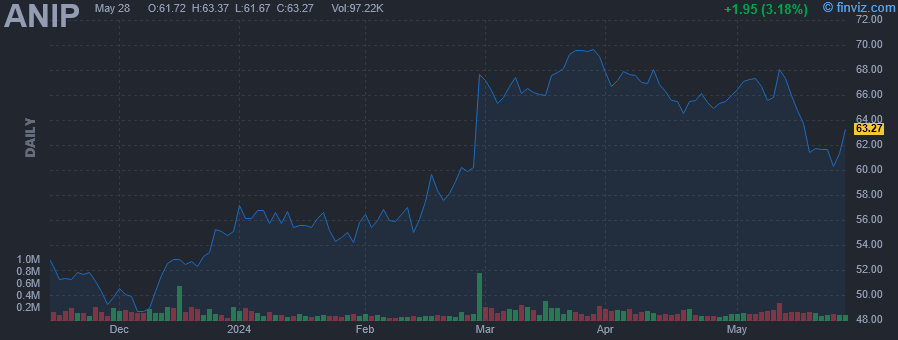 |
| Market Cap | 1.41B | EPS (ttm) | 0.93 |
| P/E | 72.55 | EPS this Y | -4.88% |
| Forward P/E | 13.41 | EPS next Y | 11.96% |
| PEG | 32.98 | EPS past 5Y | -6.27% |
| P/S | 2.90 | EPS next 5Y | 2.20% |
| P/B | 3.18 | EPS Q/Q | 113.69% |
| Dividend | - | Sales Q/Q | 39.71% |
| Insider Own | 18.25% | Inst Own | 68.34% |
| Insider Trans | -9.57% | Inst Trans | 2.76% |
| Short Float | 1.24% | Earnings | May 10/b |
| Analyst Recom | 1.40 | Target Price | 79.80 |
| Avg Volume | 145.40K | 52W Range | 37.64 - 70.81 |
|
|
|
|
ANI Pharmaceuticals, Inc. is a bio-pharmaceutical company, which engages in the development, manufacture, and marketing of branded and generic prescription pharmaceuticals. It operates through the Generics, Established Brands, and Other, and Rare Disease segments. The Generics, Established Brands, and Other segment consists of contract manufactured products, development services, royalties, and other. The Rare Disease segment involves the operations related to Cortrophin Gel. The company was founded on August 29, 1996 and is headquartered in Baudette, MN. |
| Insider Trading |
Relationship |
Date |
Transaction |
Cost |
#Shares |
Value ($) |
#Shares Total |
SEC Form 4 |
| Gassert Chad | SVP - CORP. DEV. & STRATEGY | May 01 '24 | Sale | 66.62 | 20,000 | 1,332,400 | 233,226 | May 03 05:48 PM | | Shanmugam Muthusamy | HEAD OF R&D, COO-NOVITIUM OPS | Apr 19 '24 | Sale | 65.17 | 16,809 | 1,095,443 | 782,620 | Apr 22 06:26 PM | | Shanmugam Muthusamy | HEAD OF R&D, COO-NOVITIUM OPS | Apr 18 '24 | Sale | 64.98 | 10,423 | 677,287 | 799,429 | Apr 22 06:26 PM | | Shanmugam Muthusamy | HEAD OF R&D, COO-NOVITIUM OPS | Apr 17 '24 | Sale | 65.40 | 9,520 | 622,608 | 809,852 | Apr 17 04:33 PM | | Shanmugam Muthusamy | HEAD OF R&D, COO-NOVITIUM OPS | Apr 16 '24 | Sale | 66.20 | 5,834 | 386,211 | 819,372 | Apr 17 04:33 PM |
|
|
|
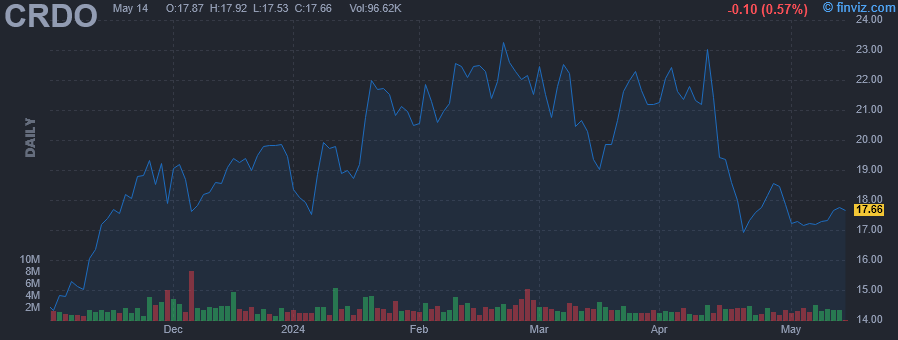 |
| Market Cap | 2.81B | EPS (ttm) | -0.23 |
| P/E | - | EPS this Y | 42.18% |
| Forward P/E | 50.15 | EPS next Y | 381.91% |
| PEG | - | EPS past 5Y | - |
| P/S | 17.08 | EPS next 5Y | 20.00% |
| P/B | 5.25 | EPS Q/Q | -85.56% |
| Dividend | - | Sales Q/Q | -2.23% |
| Insider Own | 22.43% | Inst Own | 66.96% |
| Insider Trans | -14.72% | Inst Trans | 54.35% |
| Short Float | 8.48% | Earnings | Feb 27/a |
| Analyst Recom | 1.50 | Target Price | 26.56 |
| Avg Volume | 2.07M | 52W Range | 7.20 - 23.90 |
|
|
|
|
Credo Technology Group Holding Ltd. engages in the development of connectivity solutions and products for the data infrastructure market. Its products include integrated circuits, active electrical cables, and SerDes chiplets. The company was founded by Chi Fung Cheng and Yat Tung Lam in September 2014 and is headquartered in George Town, Cayman Islands. |
| Insider Trading |
Relationship |
Date |
Transaction |
Cost |
#Shares |
Value ($) |
#Shares Total |
SEC Form 4 |
| Brennan William Joseph | Pres & Chief Executive Officer | Nov 17 '27 | Sale | 17.71 | 15,000 | 265,662 | 3,867,421 | Nov 17 08:52 PM | | Brennan William Joseph | Pres & Chief Executive Officer | Oct 24 '24 | Sale | 14.45 | 15,000 | 216,762 | 3,927,421 | Oct 24 05:51 PM | | Brennan William Joseph | Pres & Chief Executive Officer | May 03 '24 | Sale | 17.35 | 15,000 | 260,226 | 2,947,500 | May 03 05:46 PM | | Brennan William Joseph | Pres & Chief Executive Officer | May 02 '24 | Sale | 17.15 | 15,000 | 257,320 | 2,962,500 | May 03 05:46 PM | | Cheng Chi Fung | Chief Technology Officer | May 01 '24 | Sale | 17.41 | 55,000 | 957,622 | 9,773,602 | May 03 05:13 PM |
|
|
|
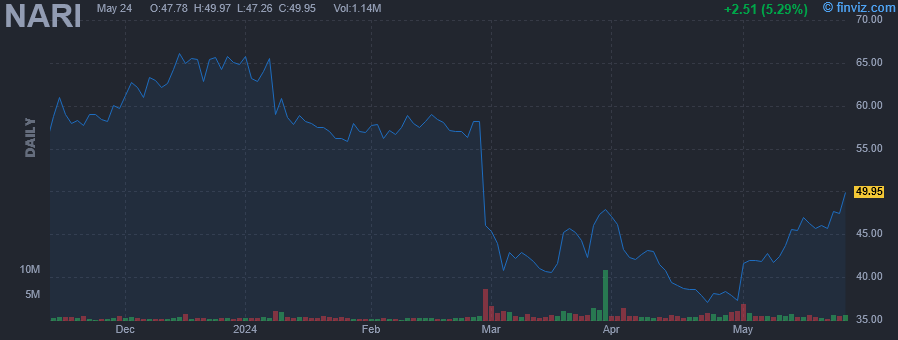 |
| Market Cap | 2.44B | EPS (ttm) | -0.41 |
| P/E | - | EPS this Y | -1400.00% |
| Forward P/E | 215.04 | EPS next Y | 143.43% |
| PEG | - | EPS past 5Y | 32.83% |
| P/S | 4.69 | EPS next 5Y | - |
| P/B | 5.45 | EPS Q/Q | -931.36% |
| Dividend | - | Sales Q/Q | 23.27% |
| Insider Own | 14.51% | Inst Own | 86.09% |
| Insider Trans | -1.88% | Inst Trans | 0.07% |
| Short Float | 7.97% | Earnings | Apr 30/a |
| Analyst Recom | 1.45 | Target Price | 65.82 |
| Avg Volume | 1.34M | 52W Range | 36.73 - 71.85 |
|
|
|
Today 02:30AM
|
Director William Hoffman Sells Shares of Inari Medical Inc (NARI)
(GuruFocus.com) |
|
May-03-24 05:49PM
|
Inari Medical Insider Sold Shares Worth $1,619,047, According to a Recent SEC Filing
(MT Newswires) |
|
12:02PM
|
Lowey Dannenberg, P.C. is Investigating Inari Medical Inc. ( Inari or the Company ) (NASDAQ:NARI) for Potential Violations of the Federal Securities Laws and Encourages Investors with more than $50,000 in Losses to Contact the Firm
(GlobeNewswire) |
|
May-02-24 04:07PM
|
Inari Medical, Inc. (NASDAQ:NARI) Q1 2024 Earnings Call Transcript
(Insider Monkey) |
|
May-01-24 12:19PM
|
Inari Medical Shares Jump on Higher Q1 Revenue
(MT Newswires) +11.41% |
|
10:59AM
|
Inari Medical (NARI) Q1 Earnings Miss Estimates, OpEx Rises
(Zacks) |
|
07:42AM
|
Q1 2024 Inari Medical Inc Earnings Call
(Thomson Reuters StreetEvents) |
|
03:30AM
|
Inari Medical Inc (NARI) Q1 2024 Earnings Call Transcript Highlights: Robust Growth and ...
(GuruFocus.com) |
|
Apr-30-24 09:55PM
|
NARI Stock Earnings: Inari Medical Misses EPS, Beats Revenue for Q1 2024
(InvestorPlace) |
|
05:45PM
|
Inari Medical, Inc. (NARI) Reports Q1 Loss, Tops Revenue Estimates
(Zacks) |
|
Inari Medical, Inc. operates as a medical device company. The firm develops, manufactures, markets and sells devices for the interventional treatment of venous diseases. Its products include FlowTriever system and ClotTriever system. The company was founded by Brian J. Cox, Paul Lubock and Robert F. Rosenbluth in June 2011 and is headquartered in Irvine, CA. |
| Insider Trading |
Relationship |
Date |
Transaction |
Cost |
#Shares |
Value ($) |
#Shares Total |
SEC Form 4 |
| Hoffman William | Director | May 01 '24 | Sale | 42.00 | 38,549 | 1,619,047 | 965,359 | May 03 05:40 PM | | Hoffman William | Director | Apr 16 '24 | Sale | 40.00 | 1,451 | 58,040 | 999,782 | Apr 18 06:38 PM | | Hill, Mitch C. | Chief Financial Officer | Apr 12 '24 | Option Exercise | 0.46 | 6,000 | 2,742 | 187,294 | Apr 16 04:32 PM | | Hill, Mitch C. | Chief Financial Officer | Apr 12 '24 | Sale | 40.96 | 6,000 | 245,760 | 181,294 | Apr 16 04:32 PM | | Hoffman William | Director | Mar 18 '24 | Sale | 41.13 | 40,000 | 1,645,079 | 1,003,296 | Mar 20 04:34 PM |
|
|
|
