 |
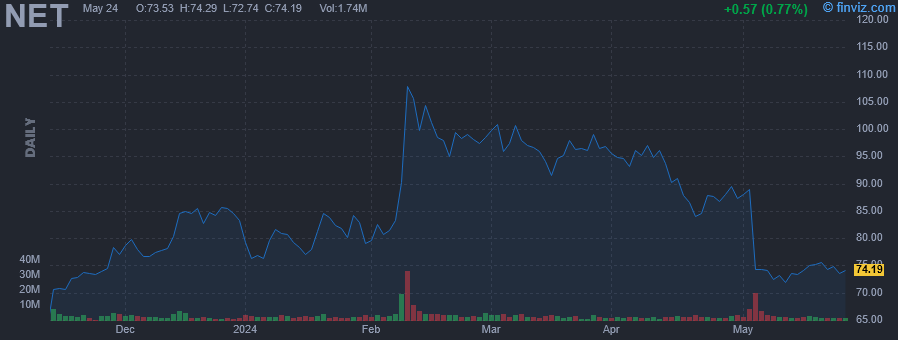
| Market Cap | 25.12B | EPS (ttm) | -0.54 |
| P/E | - | EPS this Y | 23.75% |
| Forward P/E | 98.58 | EPS next Y | 24.46% |
| PEG | - | EPS past 5Y | -13.56% |
| P/S | 18.14 | EPS next 5Y | - |
| P/B | 31.71 | EPS Q/Q | 8.93% |
| Dividend | - | Sales Q/Q | 30.47% |
| Insider Own | 13.37% | Inst Own | 74.74% |
| Insider Trans | -5.88% | Inst Trans | -0.16% |
| Short Float | 3.80% | Earnings | May 02/a |
| Analyst Recom | 2.47 | Target Price | 93.32 |
| Avg Volume | 4.06M | 52W Range | 39.90 - 116.00 |
|
|
|
May-03-24 05:41PM
|
Cloudflare Insider Sold Shares Worth $264,360, According to a Recent SEC Filing
(MT Newswires) -16.38% |
|
04:51PM
|
These Stocks Moved the Most Today: Apple, Amgen, Expedia, Coinbase, Cloudflare, Fortinet, Live Nation, and More
(Barrons.com) |
|
04:15PM
|
Cloudflare Tumbles As Revenue Outlook Underwhelms Investors
(Investor's Business Daily) |
|
03:46PM
|
Cloudflare stock plunges on lackluster Q2 revenue forecast
(Yahoo Finance Video) |
|
03:46PM
|
These Stocks Are Moving the Most Today: Apple, Amgen, Expedia, Coinbase, Cloudflare, Fortinet, Live Nation, and More
(Barrons.com) |
|
01:57PM
|
Cybersecurity Firm Fortinet's Billings Drag Stock Despite Revenue and Earnings Beat
(Investopedia) |
|
01:36PM
|
Stocks surge as soft jobs report revives Fed rate cut hopes: Yahoo Finance
(Yahoo Finance Video) |
|
01:05PM
|
Fortinet and Cloudflare Stocks Are Sinking. Uncertainty Is Up in Cybersecurity.
(Barrons.com) |
|
12:56PM
|
Cloudflare, Inc. (NYSE:NET) Q1 2024 Earnings Call Transcript
(Insider Monkey) |
|
12:52PM
|
Fortinet and Cloudflare Stocks Are Sinking
(Barrons.com) |
|
Cloudflare, Inc. engages in the provision of cloud-based services to secure websites. It offers various products for performance and reliability, video streaming and delivery, advanced security, insights, Cloudflare for developers, domain registration and Cloudflare marketplace. It operates through United States and Rest of the World geographical segments. The company was founded by Matthew Prince, Michelle Zatlyn and Lee Holloway in July 2009 and is headquartered in San Francisco, CA. |
| Insider Trading |
Relationship |
Date |
Transaction |
Cost |
#Shares |
Value ($) |
#Shares Total |
SEC Form 4 |
| Ledbetter Carl | Director | May 01 '24 | Sale | 87.49 | 8,022 | 701,860 | 1,196,793 | May 02 04:51 PM | | Eitel Maria S | Director | May 01 '24 | Sale | 88.12 | 6,875 | 605,825 | 16,638 | May 02 04:48 PM | | Kramer Douglas James | CHIEF LEGAL OFFICER | May 01 '24 | Sale | 88.12 | 3,000 | 264,360 | 205,238 | May 03 05:39 PM | | Ledbetter Carl | Director | Apr 24 '24 | Sale | 89.16 | 10,015 | 892,960 | 1,204,815 | Apr 25 04:49 PM | | Zatlyn Michelle | President and COO | Apr 18 '24 | Sale | 87.07 | 18,955 | 1,650,463 | 19,615 | Apr 18 08:14 PM |
|
|
 |
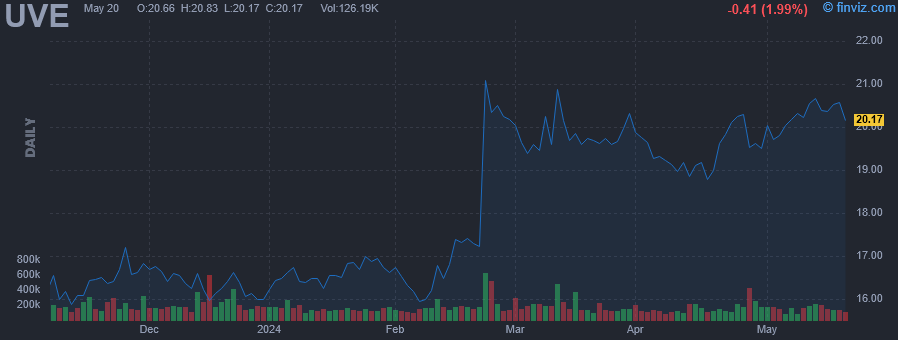 |
| Market Cap | 569.74M | EPS (ttm) | 2.55 |
| P/E | 7.75 | EPS this Y | -12.87% |
| Forward P/E | 9.79 | EPS next Y | 19.08% |
| PEG | - | EPS past 5Y | -7.49% |
| P/S | 0.39 | EPS next 5Y | - |
| P/B | 1.56 | EPS Q/Q | 45.03% |
| Dividend | 3.23% | Sales Q/Q | 16.26% |
| Insider Own | 10.51% | Inst Own | 67.11% |
| Insider Trans | -1.95% | Inst Trans | 0.76% |
| Short Float | 1.46% | Earnings | Apr 25/a |
| Analyst Recom | 2.00 | Target Price | 25.00 |
| Avg Volume | 198.38K | 52W Range | 11.07 - 22.38 |
|
|
|
|
Universal Insurance Holdings, Inc. engages in offering property and casualty insurance and value-added insurance services. It develops, markets and underwrites insurance products for consumers in the personal residential homeowner's lines of business and perform substantially all other insurance-related services for primary insurance entities, including risk management, claims management, and distribution. The company was founded by Bradley I. Meier on November 13, 1990 and is headquartered in Fort Lauderdale, FL. |
| Insider Trading |
Relationship |
Date |
Transaction |
Cost |
#Shares |
Value ($) |
#Shares Total |
SEC Form 4 |
| DOWNES SEAN P | Executive Chairman | May 02 '24 | Sale | 19.72 | 20,000 | 394,434 | 1,162,262 | May 03 05:36 PM | | DOWNES SEAN P | Executive Chairman | Mar 07 '24 | Sale | 19.53 | 20,000 | 390,616 | 1,191,390 | Mar 08 04:08 PM | | DOWNES SEAN P | Executive Chairman | Dec 22 '23 | Sale | 16.60 | 20,000 | 332,044 | 1,251,919 | Dec 22 07:02 PM | | DOWNES SEAN P | Executive Chairman | Nov 03 '23 | Sale | 16.13 | 20,000 | 322,592 | 1,285,591 | Nov 03 06:40 PM | | Donaghy Stephen | CEO | Sep 06 '23 | Buy | 12.07 | 5,000 | 60,350 | 706,051 | Sep 06 07:54 PM |
|
|
|
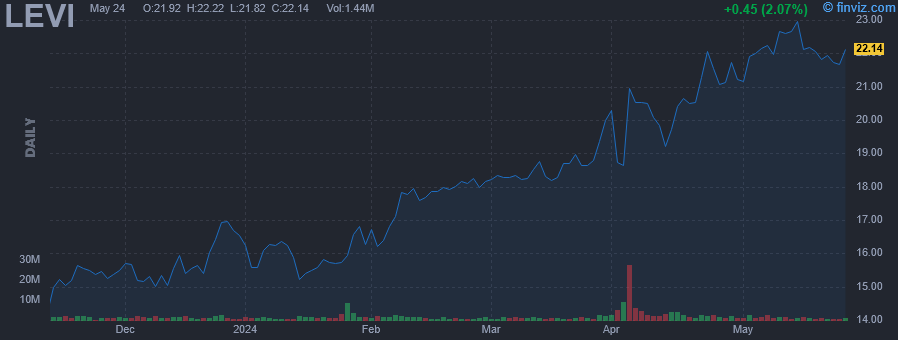 |
| Market Cap | 8.78B | EPS (ttm) | 0.31 |
| P/E | 71.17 | EPS this Y | 15.25% |
| Forward P/E | 15.05 | EPS next Y | 15.27% |
| PEG | 5.16 | EPS past 5Y | -3.14% |
| P/S | 1.45 | EPS next 5Y | 13.80% |
| P/B | 4.43 | EPS Q/Q | -109.28% |
| Dividend | 2.37% | Sales Q/Q | -7.59% |
| Insider Own | 78.02% | Inst Own | 21.10% |
| Insider Trans | -0.11% | Inst Trans | 0.93% |
| Short Float | 10.94% | Earnings | Apr 03/a |
| Analyst Recom | 2.14 | Target Price | 21.98 |
| Avg Volume | 2.72M | 52W Range | 12.41 - 22.39 |
|
|
|
|
Levi Strauss & Co. engages in the design, marketing, and sale of apparel products. The company offers jeans, casual and dress pants, tops, shorts, skirts, jackets, footwear, and related accessories. It operates through the following geographical segments: Americas, Europe, and Asia. The company was founded by Levi Strauss in 1853 and is headquartered in San Francisco, CA. |
| Insider Trading |
Relationship |
Date |
Transaction |
Cost |
#Shares |
Value ($) |
#Shares Total |
SEC Form 4 |
| Friedman David A | Director | May 02 '24 | Sale | 22.00 | 4,166 | 91,652 | 183,342 | May 03 05:35 PM | | Friedman David A | Director | May 01 '24 | Sale | 21.23 | 12,500 | 265,375 | 187,508 | May 03 05:35 PM | | Haas Bradley J. | 10% Owner | Apr 23 '24 | Sale | 22.06 | 85,985 | 1,896,545 | 0 | Apr 24 12:07 PM | | Haas Bradley J. | 10% Owner | Apr 04 '24 | Sale | 22.05 | 14,015 | 309,081 | 0 | Apr 05 04:36 PM | | Haas Bradley J. | 10% Owner | Apr 01 '24 | Sale | 20.14 | 26,959 | 542,871 | 0 | Apr 02 12:38 PM |
|
|
| |
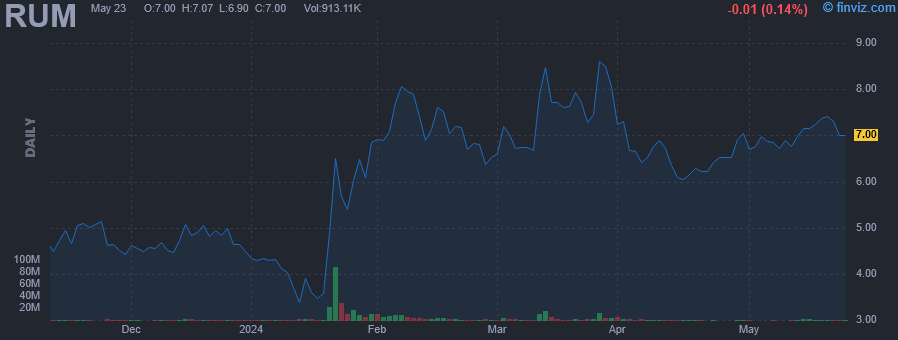 |
| Market Cap | 1.97B | EPS (ttm) | -0.58 |
| P/E | - | EPS this Y | -10.34% |
| Forward P/E | - | EPS next Y | 60.94% |
| PEG | - | EPS past 5Y | - |
| P/S | 24.30 | EPS next 5Y | - |
| P/B | 7.77 | EPS Q/Q | -2985.11% |
| Dividend | - | Sales Q/Q | 2.18% |
| Insider Own | 76.42% | Inst Own | 8.60% |
| Insider Trans | -2.11% | Inst Trans | 163.28% |
| Short Float | 18.82% | Earnings | Mar 27/a |
| Analyst Recom | 2.00 | Target Price | 6.00 |
| Avg Volume | 3.44M | 52W Range | 3.33 - 11.25 |
|
|
|
|
Rumble, Inc. operates an online neutral video platform. It deals with the following business segments: Rumble Services & Rumble Cloud. The Rumble Services segment includes Rumble Video, Rumble Streaming Market Place & Rumble Advertising Center. The collective vision of Rumble Services is to provide creators with the best monetization toolkit on the internet. The Rumble Cloud segment provides infrastructure as a service offering consisting of a portfolio of compute, storage, security & networking offerings. The company was founded in 2013 by Chris Pavlovski and is headquartered in Longboat Key, FL. |
| Insider Trading |
Relationship |
Date |
Transaction |
Cost |
#Shares |
Value ($) |
#Shares Total |
SEC Form 4 |
| Arsov Robert | Director | May 03 '24 | Sale | 6.85 | 35,000 | 239,750 | 15,208,902 | May 03 05:32 PM | | Arsov Robert | Director | May 02 '24 | Sale | 6.76 | 35,000 | 236,550 | 15,243,902 | May 03 05:32 PM | | Arsov Robert | Director | May 01 '24 | Sale | 6.70 | 35,012 | 234,622 | 15,278,902 | May 03 05:32 PM | | Sacks David O | Director | Apr 08 '24 | Sale | 6.45 | 133,896 | 864,017 | 3,390 | Apr 08 07:41 PM | | Sacks David O | Director | Apr 05 '24 | Sale | 6.46 | 383,362 | 2,474,602 | 4,692 | Apr 08 07:41 PM |
|
|
|
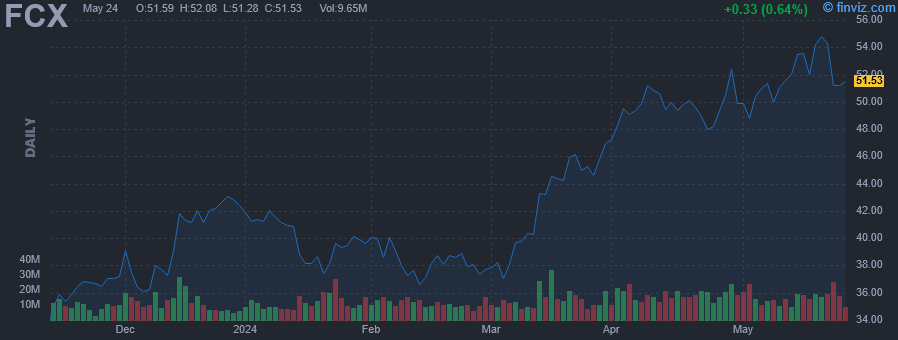 |
| Market Cap | 72.37B | EPS (ttm) | 1.13 |
| P/E | 44.50 | EPS this Y | 2.82% |
| Forward P/E | 23.49 | EPS next Y | 35.66% |
| PEG | 1.68 | EPS past 5Y | -6.56% |
| P/S | 3.03 | EPS next 5Y | 26.54% |
| P/B | 4.34 | EPS Q/Q | -29.82% |
| Dividend | 1.20% | Sales Q/Q | 23.75% |
| Insider Own | 1.66% | Inst Own | 80.73% |
| Insider Trans | -1.31% | Inst Trans | -0.48% |
| Short Float | 1.62% | Earnings | Apr 23/b |
| Analyst Recom | 1.86 | Target Price | 53.54 |
| Avg Volume | 14.99M | 52W Range | 32.72 - 52.52 |
|
|
|
|
Freeport-McMoRan, Inc. engages in the mining of copper, gold, and molybdenum. It operates through the following segments: North America Copper Mines, South America Mining, Indonesia Mining, Molybdenum Mines, Rod and Refining, Atlantic Copper Smelting and Refining, and Corporate and Other. The North America Copper Mines segment operates open-pit copper mines in Morenci, Bagdad, Safford, Sierrita, Miami in Arizona and Chino, and Tyrone in New Mexico. The South America Mining segment includes Cerro Verde in Peru and El Abra in Chile. The Indonesia Mining segment handles the operations of the Grasberg minerals district that produce copper concentrate containing significant quantities of gold and silver. The Molybdenum Mines segment includes the Henderson underground mine and Climax open pit mine, both in Colorado. The Rod and Refining segment consists of copper conversion facilities located in North America and includes a refinery, and rod mills. The Atlantic Copper Smelting and Refining segment smelts and refines copper concentrate and markets refined copper and precious metals in slimes. The Corporate and Other segment offers other mining and eliminations, oil and gas operations, and other corporate and elimination items. The company was founded by James R. Moffett on November 10, 1987 and is headquartered in Phoenix, AZ. |
| Insider Trading |
Relationship |
Date |
Transaction |
Cost |
#Shares |
Value ($) |
#Shares Total |
SEC Form 4 |
| Higgins Stephen T. | Senior VP & CAO | May 03 '24 | Option Exercise | 11.91 | 42,767 | 509,355 | 147,144 | May 03 05:30 PM | | Higgins Stephen T. | Senior VP & CAO | May 03 '24 | Sale | 50.35 | 42,767 | 2,153,259 | 104,377 | May 03 05:30 PM | | Higgins Stephen T. | Senior VP & CAO | May 01 '24 | Option Exercise | 11.89 | 43,900 | 521,982 | 148,277 | May 03 05:30 PM | | Mikes Ellie L. | Chief Accounting Officer | May 01 '24 | Option Exercise | 28.14 | 1,333 | 37,511 | 47,905 | May 03 05:28 PM | | Higgins Stephen T. | Senior VP & CAO | May 01 '24 | Sale | 51.08 | 43,900 | 2,242,333 | 104,377 | May 03 05:30 PM |
|
|
| |
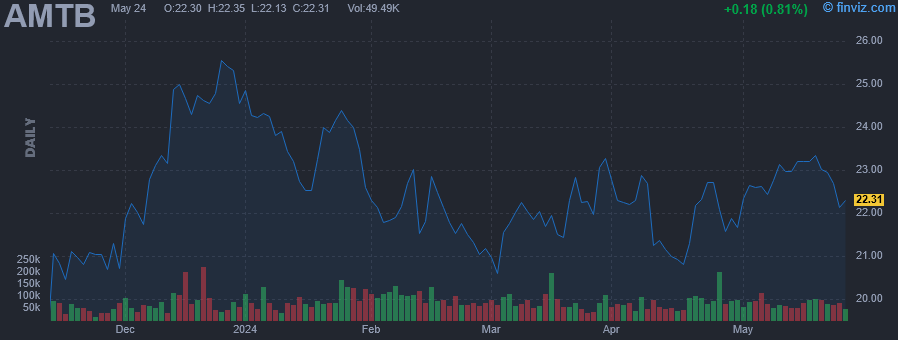 |
| Market Cap | 759.70M | EPS (ttm) | 0.67 |
| P/E | 33.70 | EPS this Y | -12.02% |
| Forward P/E | 9.13 | EPS next Y | 45.82% |
| PEG | - | EPS past 5Y | -2.21% |
| P/S | 1.23 | EPS next 5Y | - |
| P/B | 1.03 | EPS Q/Q | -48.00% |
| Dividend | 1.59% | Sales Q/Q | 23.17% |
| Insider Own | 13.39% | Inst Own | 35.22% |
| Insider Trans | -0.26% | Inst Trans | -0.05% |
| Short Float | 1.68% | Earnings | Apr 24/a |
| Analyst Recom | 2.40 | Target Price | 25.30 |
| Avg Volume | 83.37K | 52W Range | 15.79 - 26.13 |
|
|
|
|
Amerant Bancorp, Inc. is a bank holding company, which engages in the provision of deposits, credit, investment, wealth management, retail banking, mortgage and fiduciary services. It offers banking services including personal, business, international, and private clients. The company was founded in 1979 and is headquartered in Coral Gables, FL. |
| Insider Trading |
Relationship |
Date |
Transaction |
Cost |
#Shares |
Value ($) |
#Shares Total |
SEC Form 4 |
| Iafigliola Carlos | SEVP Chief Operating Officer | May 02 '24 | Sale | 22.62 | 10,579 | 239,298 | 9,961 | May 03 05:30 PM | | Esterripa Juan | See remarks | Apr 17 '24 | Option Exercise | 0.00 | 9,806 | 0 | 10,806 | Apr 19 04:40 PM | | Martin Silvio Marshall | EVP & Chief Legal Officer | Mar 08 '24 | Option Exercise | 0.00 | 416 | 0 | 7,347 | Mar 12 05:47 PM | | Capriles Alberto | SEVP Chief Risk Officer | Feb 16 '24 | Option Exercise | 0.00 | 15,992 | 0 | 36,375 | Feb 21 05:43 PM | | Calderon Sharymar | EVP - Chief Financial Officer | Feb 16 '24 | Option Exercise | 0.00 | 833 | 0 | 4,970 | Feb 21 05:40 PM |
|
|
|
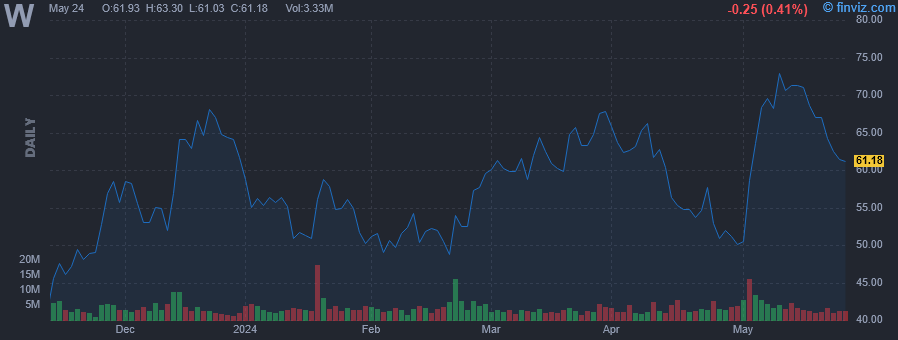 |
| Market Cap | 7.65B | EPS (ttm) | -5.36 |
| P/E | - | EPS this Y | 198.80% |
| Forward P/E | 29.73 | EPS next Y | 91.58% |
| PEG | - | EPS past 5Y | -2.82% |
| P/S | 0.64 | EPS next 5Y | - |
| P/B | - | EPS Q/Q | 35.96% |
| Dividend | - | Sales Q/Q | -1.62% |
| Insider Own | 28.57% | Inst Own | 84.74% |
| Insider Trans | -0.73% | Inst Trans | -1.40% |
| Short Float | 27.09% | Earnings | May 02/b |
| Analyst Recom | 1.97 | Target Price | 71.15 |
| Avg Volume | 4.31M | 52W Range | 30.70 - 90.71 |
|
|
|
|
Wayfair, Inc. engages in an online home furnishing store. It operates through the U.S. and International segments. The U.S. segment consists of amounts earned through product sales through the company's five distinct sites in the U.S. and through websites operated by third parties in the U.S. The International segment is composed of earnings through product sales in international sites. The company was founded by Steven K. Conine and Niraj S. Shah in May 2002 and is headquartered in Boston, MA. |
| Insider Trading |
Relationship |
Date |
Transaction |
Cost |
#Shares |
Value ($) |
#Shares Total |
SEC Form 4 |
| Schaferkordt Anke | Director | May 02 '24 | Sale | 58.81 | 348 | 20,465 | 13,251 | May 03 05:24 PM | | Blotner Jon | Chief Commercial Officer | Apr 15 '24 | Sale | 60.52 | 4,144 | 250,795 | 37,957 | Apr 16 08:01 PM | | Conine Steven | Co-Founder | Apr 08 '24 | Sale | 64.62 | 10,000 | 646,182 | 239,073 | Apr 09 08:29 PM | | Shah Niraj | Chief Executive Officer | Apr 08 '24 | Sale | 64.58 | 10,000 | 645,790 | 239,137 | Apr 09 08:35 PM | | Tan Fiona | Chief Technology Officer | Apr 04 '24 | Sale | 65.03 | 4,884 | 317,599 | 41,027 | Apr 05 07:06 PM |
|
|
| |
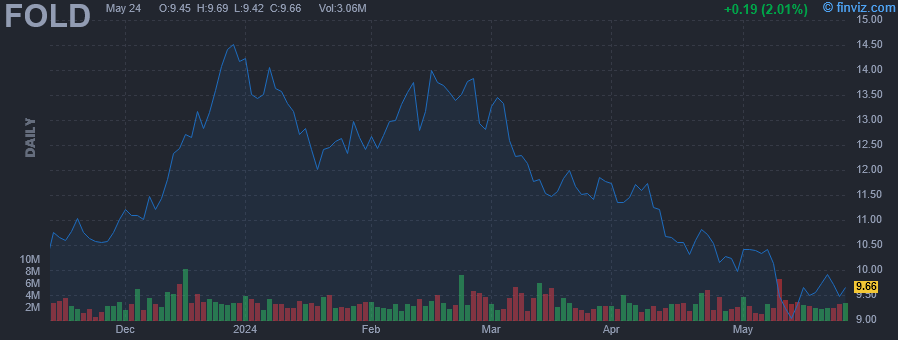 |
| Market Cap | 3.08B | EPS (ttm) | -0.52 |
| P/E | - | EPS this Y | 98.81% |
| Forward P/E | 26.83 | EPS next Y | 6481.79% |
| PEG | - | EPS past 5Y | 22.84% |
| P/S | 7.71 | EPS next 5Y | - |
| P/B | 19.06 | EPS Q/Q | 41.97% |
| Dividend | - | Sales Q/Q | 30.63% |
| Insider Own | 2.98% | Inst Own | 106.28% |
| Insider Trans | -5.45% | Inst Trans | -4.29% |
| Short Float | 10.90% | Earnings | Feb 28/b |
| Analyst Recom | 1.55 | Target Price | 18.78 |
| Avg Volume | 3.06M | 52W Range | 9.70 - 14.57 |
|
|
|
|
Amicus Therapeutics, Inc. operates as a biotechnology company. The firm focuses on discovering, developing and delivering medicines for people living with metabolic diseases. Its product portfolio includes first and only approved oral precision medicine for people living with Fabry disease who have amenable genetic variants, a novel, clinical-stage, treatment paradigm for Pompe disease and a rare disease gene therapy portfolio. The company was founded by John Francis Crowley on February 4, 2002 and is headquartered in Princeton, NJ. |
| Insider Trading |
Relationship |
Date |
Transaction |
Cost |
#Shares |
Value ($) |
#Shares Total |
SEC Form 4 |
| Campbell Bradley L | President and CEO | May 01 '24 | Option Exercise | 8.61 | 7,500 | 64,575 | 894,154 | May 03 05:21 PM | | Campbell Bradley L | President and CEO | May 01 '24 | Sale | 10.07 | 7,500 | 75,524 | 886,654 | May 03 05:21 PM | | Campbell Bradley L | President and CEO | Apr 01 '24 | Option Exercise | 8.61 | 7,500 | 64,575 | 894,154 | Apr 03 06:14 PM | | Campbell Bradley L | President and CEO | Apr 01 '24 | Sale | 11.67 | 7,500 | 87,496 | 886,654 | Apr 03 06:14 PM | | SBLENDORIO GLENN | Director | Mar 07 '24 | Option Exercise | 2.80 | 15,000 | 42,000 | 83,596 | Mar 11 05:36 PM |
|
|
|
 |
| Market Cap | 391.74M | EPS (ttm) | -1.28 |
| P/E | - | EPS this Y | 8.62% |
| Forward P/E | - | EPS next Y | 15.41% |
| PEG | - | EPS past 5Y | -0.33% |
| P/S | 5.99 | EPS next 5Y | - |
| P/B | 18.37 | EPS Q/Q | 48.44% |
| Dividend | - | Sales Q/Q | 40.84% |
| Insider Own | 52.25% | Inst Own | 30.25% |
| Insider Trans | -4.36% | Inst Trans | -1.25% |
| Short Float | 0.71% | Earnings | May 08/a |
| Analyst Recom | 1.29 | Target Price | 17.29 |
| Avg Volume | 108.42K | 52W Range | 3.80 - 18.15 |
|
|
|
|
NeuroPace, Inc. develops, manufactures, and markets implantable devices for treating epilepsy and neurological disorders. It offers implantable components, which include the RNS neurostimulator as well as depth and cortical strip leads. The firm's RNS System is designed for the treatment of medically refractory partial epilepsy and includes implantable and external products. The company was founded by Rebecca L. Kuhn, Frank M. Fischer on November 19, 1997 and is headquartered in Mountain View, CA. |
| Insider Trading |
Relationship |
Date |
Transaction |
Cost |
#Shares |
Value ($) |
#Shares Total |
SEC Form 4 |
| ORBIMED ADVISORS LLC | 10% Owner | May 03 '24 | Sale | 14.03 | 4,674 | 65,576 | 3,406,335 | May 03 05:16 PM | | ORBIMED ADVISORS LLC | 10% Owner | May 02 '24 | Sale | 14.01 | 8,842 | 123,876 | 3,411,009 | May 03 05:16 PM | | ORBIMED ADVISORS LLC | 10% Owner | May 01 '24 | Sale | 14.02 | 15,690 | 219,974 | 3,419,851 | May 03 05:16 PM | | ORBIMED ADVISORS LLC | 10% Owner | Apr 24 '24 | Sale | 14.06 | 1,781 | 25,041 | 3,435,541 | Apr 26 05:01 PM | | ORBIMED ADVISORS LLC | 10% Owner | Apr 23 '24 | Sale | 14.29 | 21,791 | 311,393 | 3,437,322 | Apr 23 06:38 PM |
|
|
|
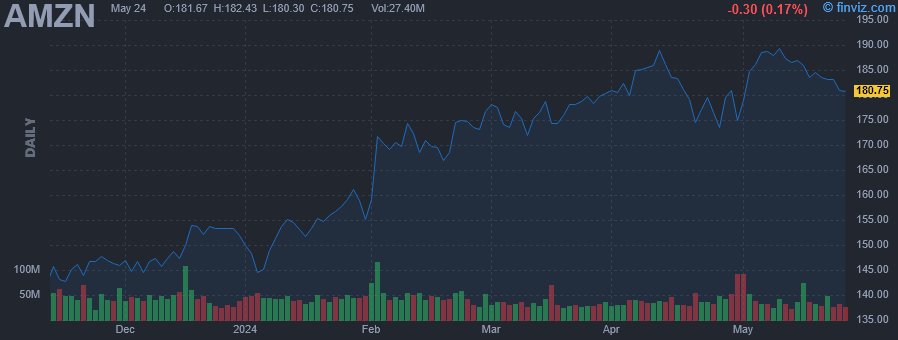 |
| Market Cap | 1936.06B | EPS (ttm) | 3.56 |
| P/E | 52.30 | EPS this Y | 54.79% |
| Forward P/E | 32.25 | EPS next Y | 28.61% |
| PEG | 1.71 | EPS past 5Y | 23.55% |
| P/S | 3.28 | EPS next 5Y | 30.50% |
| P/B | 8.94 | EPS Q/Q | 218.85% |
| Dividend | - | Sales Q/Q | 12.53% |
| Insider Own | 11.09% | Inst Own | 61.89% |
| Insider Trans | -4.18% | Inst Trans | 0.60% |
| Short Float | 0.82% | Earnings | Apr 30/a |
| Analyst Recom | 1.19 | Target Price | 221.42 |
| Avg Volume | 42.25M | 52W Range | 103.28 - 189.77 |
|
|
|
|
Amazon.com, Inc. is a multinational technology company, which engages in providing online retail shopping services. It operates through the following segments: North America, International, and Amazon Web Services (AWS). The North America segment is involved in the retail sales of consumer products including from sellers and subscriptions through North America-focused online and physical stores. The International segment focuses on the amounts earned from retail sales of consumer products including from sellers and subscriptions through internationally focused online stores. The AWS segment includes global sales of computer, storage, database, and other services for start-ups, enterprises, government agencies, and academic institutions. The company was founded by Jeffrey P. Bezos in July 1994 and is headquartered in Seattle, WA. |
| Insider Trading |
Relationship |
Date |
Transaction |
Cost |
#Shares |
Value ($) |
#Shares Total |
SEC Form 4 |
| Herrington Douglas J | CEO Worldwide Amazon Stores | May 01 '24 | Sale | 180.29 | 3,500 | 631,012 | 509,358 | May 03 05:16 PM | | Selipsky Adam | CEO Amazon Web Services | Apr 19 '24 | Sale | 179.00 | 500 | 89,500 | 130,100 | Apr 22 04:25 PM | | Selipsky Adam | CEO Amazon Web Services | Apr 18 '24 | Sale | 181.38 | 500 | 90,690 | 130,600 | Apr 22 04:25 PM | | Selipsky Adam | CEO Amazon Web Services | Apr 05 '24 | Sale | 182.53 | 500 | 91,265 | 131,100 | Apr 08 04:24 PM | | Selipsky Adam | CEO Amazon Web Services | Apr 04 '24 | Sale | 184.00 | 500 | 92,000 | 131,600 | Apr 08 04:24 PM |
|
|
|
