 |
| Market Cap | 5.02B | EPS (ttm) | 3.49 |
| P/E | 31.42 | EPS this Y | 20.40% |
| Forward P/E | 24.44 | EPS next Y | 10.81% |
| PEG | 1.21 | EPS past 5Y | - |
| P/S | 2.20 | EPS next 5Y | 26.00% |
| P/B | 3.68 | EPS Q/Q | 526.82% |
| Dividend | - | Sales Q/Q | 22.00% |
| Insider Own | 0.93% | Inst Own | 99.11% |
| Insider Trans | -8.75% | Inst Trans | 1.46% |
| Short Float | 3.41% | Earnings | May 02/b |
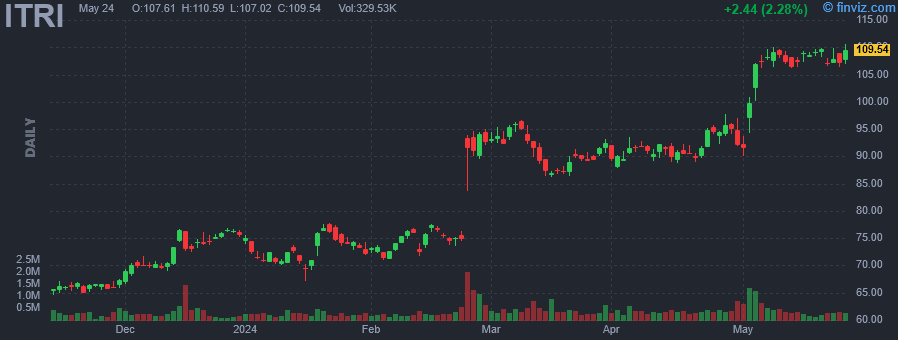
| Analyst Recom | 2.00 | Target Price | 111.73 |
| Avg Volume | 504.14K | 52W Range | 56.11 - 110.59 |
|
|
|
|
Itron, Inc. is a technology and services company, which engages in the provision of solutions that measure, manage, and analyze energy and water use. It operates through the following segments: Device Solutions, Networked Solutions, and Outcomes. The Device Solutions segment includes hardware products used for measurement, control, or sensing that do not have communications capability embedded for use with its broader Itron systems. The Networked Solutions segment offers a combination of communicating devices, network infrastructure, and associated application software designed and sold as a complete solution for acquiring and transporting robust application-specific data. The Outcomes segment consist of the firm's value-added, enhanced software and services operating segment in which it manage, organize, analyze, and interpret data to improve decision making, maximize operational profitability, drive resource efficiency, and deliver results for consumers, utilities, and smart cities. The company was founded in 1977 and is headquartered in Liberty Lake, WA. |
| Insider Trading |
Relationship |
Date |
Transaction |
Cost |
#Shares |
Value ($) |
#Shares Total |
SEC Form 4 |
| Ware Christopher E. | SVP, GC & Corp. Secretary | May 13 '24 | Sale | 106.84 | 311 | 33,226 | 15,371 | May 14 04:16 PM | | Pulatie-Hahn Laurie Ann | SVP, HR | May 13 '24 | Sale | 106.84 | 306 | 32,692 | 18,525 | May 14 03:42 PM | | Deitrich Thomas | President & CEO | Mar 25 '24 | Option Exercise | 35.13 | 8,538 | 299,940 | 207,036 | Mar 26 03:32 PM | | Lande Jerome J. | Director | Mar 07 '24 | Sale | 95.25 | 14,896 | 1,418,895 | 5,750 | Mar 07 06:47 PM | | Deitrich Thomas | President & CEO | Feb 28 '24 | Sale | 91.02 | 3,353 | 305,198 | 198,498 | Feb 29 02:17 PM |
|
|
 |
 |
| Market Cap | 17.93B | EPS (ttm) | 7.21 |
| P/E | 11.93 | EPS this Y | 6.57% |
| Forward P/E | 12.56 | EPS next Y | 6.37% |
| PEG | 2.98 | EPS past 5Y | - |
| P/S | 0.63 | EPS next 5Y | 4.00% |
| P/B | 6.76 | EPS Q/Q | 139.65% |
| Dividend | 1.94% | Sales Q/Q | -1.49% |
| Insider Own | 2.20% | Inst Own | 100.54% |
| Insider Trans | -2.42% | Inst Trans | -1.83% |
| Short Float | 4.73% | Earnings | May 07/b |
| Analyst Recom | 2.40 | Target Price | 84.29 |
| Avg Volume | 4.08M | 52W Range | 31.68 - 86.46 |
|
|
|
|
NRG Energy, Inc. engages in the production, sale, and distribution of energy and energy services. It operates through the following segments: Generation, Retail, and Corporate. The Generation segment includes all power plant activities, domestic and international, as well as renewables. The Retail segment includes mass customers and business solutions, and other distributed and reliability products. The Corporate segment includes residential solar and electric vehicle services. The company was founded in 1989 and is headquartered in Houston, TX. |
| Insider Trading |
Relationship |
Date |
Transaction |
Cost |
#Shares |
Value ($) |
#Shares Total |
SEC Form 4 |
| Patel Rasesh M. | President, NRG Consumer | May 17 '24 | Sale | 83.41 | 24,546 | 2,047,382 | 266,064 | May 20 05:01 PM | | Killinger Elizabeth R | Exec VP, NRG Home | Mar 15 '24 | Sale | 63.64 | 40,000 | 2,545,600 | 107,123 | Mar 18 05:15 PM | | Patel Rasesh M. | Exec VP, Smart Home | Mar 14 '24 | Sale | 62.59 | 49,092 | 3,072,668 | 356,962 | Mar 18 05:15 PM | | Curci Brian | Exec VP & General Counsel | Jan 02 '24 | Option Exercise | 51.25 | 16,746 | 858,232 | 99,628 | Jan 05 10:35 AM | | Chung Bruce | EVP & CFO | Jan 02 '24 | Option Exercise | 51.25 | 14,247 | 730,159 | 82,703 | Jan 05 10:54 AM |
|
|
|
 |
| Market Cap | 11.35B | EPS (ttm) | 6.89 |
| P/E | 18.90 | EPS this Y | 6.99% |
| Forward P/E | 9.87 | EPS next Y | 9.59% |
| PEG | 2.59 | EPS past 5Y | -1.35% |
| P/S | 0.20 | EPS next 5Y | 7.30% |
| P/B | 1.40 | EPS Q/Q | 10.35% |
| Dividend | 1.24% | Sales Q/Q | -7.60% |
| Insider Own | 11.03% | Inst Own | 79.12% |
| Insider Trans | -32.49% | Inst Trans | -1.70% |
| Short Float | 2.66% | Earnings | Mar 26/b |
| Analyst Recom | 1.67 | Target Price | 132.73 |
| Avg Volume | 961.42K | 52W Range | 87.68 - 130.69 |
|
|
|
|
TD SYNNEX Corp. engages in the distribution and aggregation of solutions in the information technology ecosystem. It operates through the following geographical segments: Americas, Europe, and Asia-Pacific and Japan. The firm offers IT hardware, software, and systems including personal computing devices and peripherals, mobile phones and accessories, printers, server and datacenter infrastructure, hybrid cloud, security, networking, communications and storage solutions, and system components. It also provides system design and integration solutions. The company was founded by Robert T. Huang in 1980 and is headquartered in Fremont, CA. |
| Insider Trading |
Relationship |
Date |
Transaction |
Cost |
#Shares |
Value ($) |
#Shares Total |
SEC Form 4 |
| HUME RICHARD T | Chief Executive Officer | May 01 '24 | Sale | 115.79 | 10,000 | 1,157,920 | 219,363 | May 02 04:25 PM | | POLK DENNIS | Head of Hyve Solutions | Apr 08 '24 | Option Exercise | 38.89 | 20,000 | 777,800 | 154,706 | Apr 09 06:59 PM | | POLK DENNIS | Head of Hyve Solutions | Apr 08 '24 | Sale | 118.10 | 20,000 | 2,361,936 | 134,706 | Apr 09 06:59 PM | | HUME RICHARD T | Chief Executive Officer | Mar 04 '24 | Sale | 105.57 | 10,000 | 1,055,703 | 229,363 | Mar 05 03:55 PM | | HUME RICHARD T | Chief Executive Officer | Feb 20 '24 | Sale | 101.18 | 10,000 | 1,011,787 | 239,363 | Feb 21 04:39 PM |
|
|
| |
 |
| Market Cap | 720.09M | EPS (ttm) | 2.55 |
| P/E | 13.95 | EPS this Y | -14.43% |
| Forward P/E | 12.85 | EPS next Y | 11.11% |
| PEG | 1.39 | EPS past 5Y | 0.75% |
| P/S | 0.67 | EPS next 5Y | 10.00% |
| P/B | 1.54 | EPS Q/Q | -11.98% |
| Dividend | 1.69% | Sales Q/Q | 11.14% |
| Insider Own | 2.26% | Inst Own | 91.62% |
| Insider Trans | -2.76% | Inst Trans | -1.45% |
| Short Float | 1.12% | Earnings | May 06/a |
| Analyst Recom | 2.00 | Target Price | 37.67 |
| Avg Volume | 143.70K | 52W Range | 22.52 - 36.36 |
|
|
|
|
Heidrick & Struggles International, Inc. engages in provision of leadership consulting, culture shaping and senior-level executive search services. It offers its clients build leadership teams through facilitating the recruitment, management and deployment of senior executives. It operates under the following segments: Americas, Europe, Asia Pacific, Heidrick Consulting, and On Demand Talent Business. The company was founded by Gardner Heidrick and John Struggles in 1953 and is headquartered in Chicago, IL. |
| Insider Trading |
Relationship |
Date |
Transaction |
Cost |
#Shares |
Value ($) |
#Shares Total |
SEC Form 4 |
| Harris Mark R | Chief Financial Officer | May 09 '24 | Sale | 31.77 | 7,000 | 222,379 | 76,169 | May 10 04:05 PM | | Harris Mark R | Chief Financial Officer | Dec 12 '23 | Sale | 28.04 | 6,000 | 168,232 | 63,206 | Dec 14 04:09 PM |
|
|
|
 |
| Market Cap | 83.44B | EPS (ttm) | 1.16 |
| P/E | 38.40 | EPS this Y | 7.37% |
| Forward P/E | 26.51 | EPS next Y | 9.42% |
| PEG | 5.41 | EPS past 5Y | 4.06% |
| P/S | 7.33 | EPS next 5Y | 7.10% |
| P/B | 19.06 | EPS Q/Q | 12.48% |
| Dividend | 1.79% | Sales Q/Q | 8.52% |
| Insider Own | 0.00% | Inst Own | 3.88% |
| Insider Trans | - | Inst Trans | -1.19% |
| Short Float | 0.16% | Earnings | Feb 15/b |
| Analyst Recom | 2.33 | Target Price | 46.40 |
| Avg Volume | 1.07M | 52W Range | 30.10 - 44.96 |
|
|
|
|
RELX Plc engages in provision of information and analytics solutions for professional and business customers across industries. It operates through the following business segments: Scientific, Technical & Medical; Risk & Business Analytics; Legal; and Exhibitions. The Scientific, Technical & Medical segment is a global information analytics business that helps institutions and professionals advance healthcare, open science, and improve performance for the benefit of humanity. The Risk & Business Analytics segment provides customers with solutions and decision tools that combine public and industry specific content with advanced technology and analytics to assist them in evaluating and predicting risk and enhancing operational efficiency. The Legal segment is a global provider of legal, regulatory and business information and analytics that helps customers increase productivity, improve decision-making and outcomes and advance the rule of law around the world. The Exhibitions segment is an event business, enhancing the effect of face-to-face through data and digital tools. The company was founded by Albert Edward Reed in 1903 and is headquartered in London, the United Kingdom. |
|
| |
 |
| Market Cap | 872.70M | EPS (ttm) | 5.98 |
| P/E | 8.75 | EPS this Y | -46.79% |
| Forward P/E | 10.74 | EPS next Y | 36.80% |
| PEG | 1.75 | EPS past 5Y | - |
| P/S | 0.42 | EPS next 5Y | 5.00% |
| P/B | 1.27 | EPS Q/Q | -27.13% |
| Dividend | - | Sales Q/Q | -5.56% |
| Insider Own | 3.34% | Inst Own | 92.72% |
| Insider Trans | 0.00% | Inst Trans | -7.02% |
| Short Float | 2.57% | Earnings | Apr 29/a |
| Analyst Recom | 3.00 | Target Price | 42.00 |
| Avg Volume | 204.75K | 52W Range | 29.22 - 52.36 |
|
|
|
|
Clearwater Paper Corp. engages in the manufacturing and selling of private label tissue, paperboard, and pulp-based products. It operates through the Consumer Products and Pulp and Paperboard segments. The Consumer Products segment manufactures and sells a complete line of at-home tissue products. The Pulp and Paperboard segment produces and markets solid bleached sulfate paperboard for the high-end segment of the packaging industry and offers custom sheeting, slitting, and cutting of paperboard. The company was founded on December 9, 2008 and is headquartered in Spokane, WA. |
| Insider Trading |
Relationship |
Date |
Transaction |
Cost |
#Shares |
Value ($) |
#Shares Total |
SEC Form 4 |
| Gadd Michael S | Sr. Vice President | Aug 04 '23 | Sale | 35.68 | 6,182 | 220,574 | 61,843 | Aug 08 05:15 PM |
|
|
|
 |
| Market Cap | 76.49B | EPS (ttm) | 9.36 |
| P/E | 36.12 | EPS this Y | 16.29% |
| Forward P/E | 28.76 | EPS next Y | 11.77% |
| PEG | 2.75 | EPS past 5Y | 10.15% |
| P/S | 4.20 | EPS next 5Y | 13.15% |
| P/B | 11.12 | EPS Q/Q | 43.31% |
| Dividend | 0.96% | Sales Q/Q | 15.00% |
| Insider Own | 0.27% | Inst Own | 86.10% |
| Insider Trans | -6.80% | Inst Trans | 1.04% |
| Short Float | 1.24% | Earnings | Apr 30/b |
| Analyst Recom | 2.64 | Target Price | 335.31 |
| Avg Volume | 926.32K | 52W Range | 162.04 - 338.09 |
|
|
|
|
Trane Technologies Plc engages in providing solutions to buildings, homes, and transportation. It operates through the following business segments: Americas, EMEA, and Asia Pacific. The Americas segment encompasses commercial heating and cooling systems, building controls, and energy services and solutions, residential heating and cooling, and transport refrigeration systems, and solutions in North America and Latin America regions. The EMEA segment includes heating and cooling systems, services and solutions for commercial buildings, and transport refrigeration systems and solutions in Europe, Middle East, and Africa regions. The Asia Pacific segment is involved in heating and cooling systems, services and solutions for commercial buildings and transport refrigeration systems and solutions in Asia Pacific region. The company was founded in 1871 and is headquartered in Swords, Ireland. |
| Insider Trading |
Relationship |
Date |
Transaction |
Cost |
#Shares |
Value ($) |
#Shares Total |
SEC Form 4 |
| Regnery David S | Chair and CEO | Mar 06 '24 | Sale | 286.43 | 9,782 | 2,801,836 | 104,092 | Mar 07 04:12 PM | | Kuehn Christopher J | Executive Vice President & CFO | Mar 06 '24 | Sale | 286.48 | 3,762 | 1,077,728 | 61,691 | Mar 07 04:11 PM | | Regnery David S | Chair and CEO | Mar 05 '24 | Sale | 286.19 | 6,990 | 2,000,494 | 113,874 | Mar 07 04:12 PM | | Camuti Paul A | Executive Vice President | Mar 04 '24 | Sale | 288.30 | 5,643 | 1,626,899 | 88,770 | Mar 06 04:12 PM | | Simmons Donald E. | Group President, Americas | Mar 04 '24 | Sale | 288.31 | 3,763 | 1,084,917 | 3,388 | Mar 06 04:11 PM |
|
|
| |
 |
| Market Cap | 6.17B | EPS (ttm) | 4.92 |
| P/E | 23.27 | EPS this Y | -4.58% |
| Forward P/E | 16.19 | EPS next Y | 12.44% |
| PEG | 19.40 | EPS past 5Y | 27.38% |
| P/S | 3.45 | EPS next 5Y | 1.20% |
| P/B | 3.37 | EPS Q/Q | 183.04% |
| Dividend | - | Sales Q/Q | -0.27% |
| Insider Own | 0.56% | Inst Own | 90.27% |
| Insider Trans | -6.95% | Inst Trans | 2.84% |
| Short Float | 1.61% | Earnings | May 07/a |
| Analyst Recom | 1.90 | Target Price | 112.00 |
| Avg Volume | 413.98K | 52W Range | 65.02 - 116.14 |
|
|
|
|
Cirrus Logic, Inc. engages in the development of mixed-signal processing solutions. Its product lines include audio and High-Performance Mixed-Signal (HPMS) products. It operates through the following geographical segments: China, Hong Kong, Vietnam, South Korea, India, United States, and Rest of World. The company was founded by Suhas S. Patil and Michael L. Hackworth in 1984 and is headquartered in Austin, TX. |
| Insider Trading |
Relationship |
Date |
Transaction |
Cost |
#Shares |
Value ($) |
#Shares Total |
SEC Form 4 |
| Alberty Carl Jackson | VP, MSP | May 22 '24 | Option Exercise | 74.57 | 837 | 62,416 | 39,344 | May 22 06:44 PM | | Alberty Carl Jackson | VP, MSP | May 20 '24 | Sale | 113.35 | 2,000 | 226,700 | 38,507 | May 22 06:44 PM | | Dougherty Justin E | SVP, Global Operations | May 13 '24 | Sale | 107.85 | 4,000 | 431,400 | 5,838 | May 13 04:52 PM | | Nathamuni Venkatesh | Chief Financial Officer | May 04 '24 | Option Exercise | 0.00 | 3,421 | 0 | 5,008 | May 07 04:07 PM | | Grode Denise | Chief Human Resources Officer | Apr 06 '24 | Option Exercise | 0.00 | 2,947 | 0 | 5,155 | Apr 09 05:02 PM |
|
|
|
 |
| Market Cap | 653.84M | EPS (ttm) | -0.02 |
| P/E | - | EPS this Y | - |
| Forward P/E | - | EPS next Y | - |
| PEG | - | EPS past 5Y | - |
| P/S | 14.45 | EPS next 5Y | - |
| P/B | 6.26 | EPS Q/Q | 114.29% |
| Dividend | - | Sales Q/Q | 9.89% |
| Insider Own | 85.29% | Inst Own | 0.87% |
| Insider Trans | -0.16% | Inst Trans | 1.43% |
| Short Float | 0.55% | Earnings | Jan 17/b |
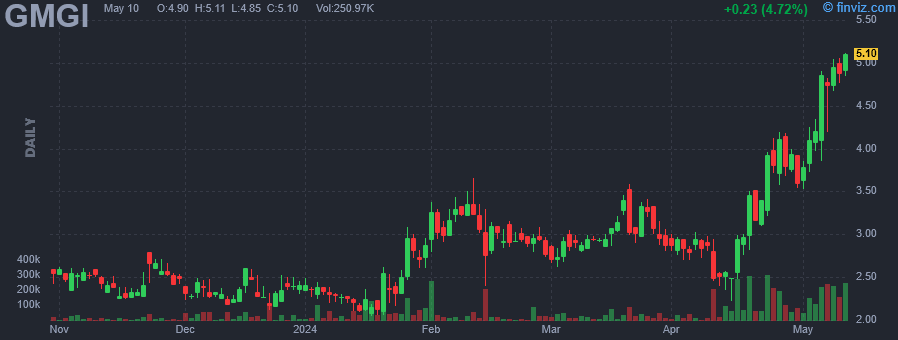
| Analyst Recom | 1.00 | Target Price | 4.00 |
| Avg Volume | 106.93K | 52W Range | 1.95 - 5.50 |
|
|
|
|
Golden Matrix Group, Inc. engages in offering casino, sportsbook, and competition products. Its brands include R Kings Competitions, MexPlay, and GM-AG. It operates through the Business-to-business (B2B) and Business-to-consumer (B2C) segments. The B2B segment is involved in the charges of usage of its software and royalties charged on the use of third-party gaming content. The B2C segment focuses on the charges to enter prize competitions in the United Kingdom. The company was founded by Weiting Feng and Anthony Brian Goodman on June 4, 2008 and is headquartered in Las Vegas, NV. |
| Insider Trading |
Relationship |
Date |
Transaction |
Cost |
#Shares |
Value ($) |
#Shares Total |
SEC Form 4 |
| Feng Weiting | Chief Operating Officer | May 20 '24 | Sale | 4.39 | 100,000 | 439,200 | 2,691,231 | May 22 04:01 PM | | Feng Weiting | Chief Operating Officer | May 07 '24 | Sale | 4.36 | 37,166 | 162,055 | 2,791,231 | May 08 04:01 PM | | Feng Weiting | Chief Operating Officer | May 06 '24 | Sale | 4.04 | 9,291 | 37,565 | 2,828,397 | May 08 04:01 PM | | Feng Weiting | Chief Operating Officer | Apr 24 '24 | Sale | 4.00 | 15,727 | 62,908 | 2,837,688 | Apr 30 04:01 PM |
|
|
|
 |
| Market Cap | 281.06M | EPS (ttm) | -0.52 |
| P/E | - | EPS this Y | 77.55% |
| Forward P/E | - | EPS next Y | 36.36% |
| PEG | - | EPS past 5Y | - |
| P/S | 221.30 | EPS next 5Y | - |
| P/B | 25.09 | EPS Q/Q | -25.73% |
| Dividend | - | Sales Q/Q | - |
| Insider Own | 51.90% | Inst Own | 7.33% |
| Insider Trans | 0.20% | Inst Trans | - |
| Short Float | 3.70% | Earnings | - |
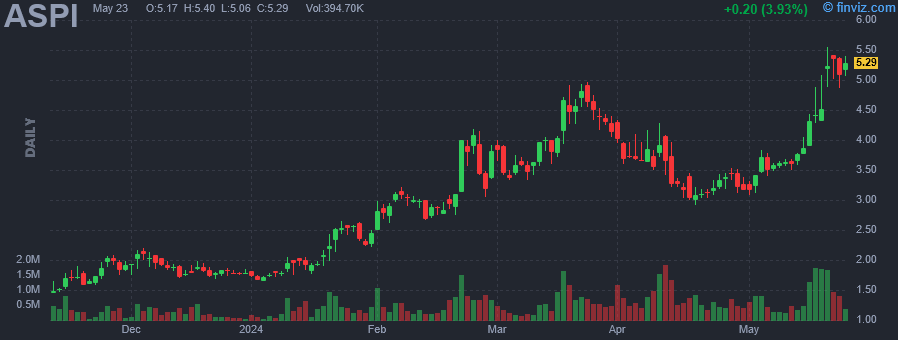
| Analyst Recom | 1.00 | Target Price | 5.50 |
| Avg Volume | 730.95K | 52W Range | 0.30 - 5.57 |
|
|
|
|
ASP Isotopes, Inc. is a pre-commercial stage advanced materials company, which engages in the development of technology and processes that will allow for the enrichment of natural isotopes into higher concentration products. Its products include medical, green energy, and Industrial isotopes. The company was founded by Paul E. Mann and Robert Ainscow on September 13, 2021 and is headquartered in Washington, DC. |
| Insider Trading |
Relationship |
Date |
Transaction |
Cost |
#Shares |
Value ($) |
#Shares Total |
SEC Form 4 |
| Ryan Robert John Andrew | Director | Apr 30 '24 | Buy | 3.43 | 16,234 | 55,740 | 572,102 | May 01 08:50 AM | | Ryan Robert John Andrew | Director | Apr 29 '24 | Buy | 3.20 | 4,313 | 13,802 | 555,868 | May 01 08:50 AM | | Ryan Robert John Andrew | Director | Apr 26 '24 | Buy | 3.48 | 5,000 | 17,400 | 551,555 | Apr 30 07:49 AM | | Ryan Robert John Andrew | Director | Apr 25 '24 | Buy | 3.42 | 9,500 | 32,450 | 546,555 | Apr 29 09:04 PM | | Ryan Robert John Andrew | Director | Jan 29 '24 | Buy | 2.35 | 15,596 | 36,651 | 537,055 | Feb 26 07:27 AM |
|
|
|
