 |
| Market Cap | 19.75B | EPS (ttm) | 12.03 |
| P/E | 11.65 | EPS this Y | -29.29% |
| Forward P/E | 22.49 | EPS next Y | -4.24% |
| PEG | - | EPS past 5Y | 84.46% |
| P/S | 4.58 | EPS next 5Y | -1.90% |
| P/B | 48.12 | EPS Q/Q | 812.62% |
| Dividend | - | Sales Q/Q | 7.34% |
| Insider Own | 0.74% | Inst Own | 98.02% |
| Insider Trans | -15.97% | Inst Trans | -1.88% |
| Short Float | 2.14% | Earnings | May 02/a |
| Analyst Recom | 1.84 | Target Price | 143.28 |
| Avg Volume | 1.28M | 52W Range | 69.18 - 140.00 |
|
|
|
|
GoDaddy, Inc. engages in the provision of simple and easy-to-use products on a single technology platform wrapped with personalized guidance. It operates under the Applications and Commerce (A and C) and Core Platform (Core) segments. The A and C segment includes selling products containing proprietary software, commerce products, third-party email, productivity solutions, and certain products included in bundled offerings of proprietary software products. The Core segment includes domain registrations and renewals, aftermarket domain sales, website hosting products, website security products not included in bundled offerings of proprietary software, and products that do not contain a software component. The company was founded by Robert R. Parsons in 1997 and is headquartered in Tempe, AZ. |
| Insider Trading |
Relationship |
Date |
Transaction |
Cost |
#Shares |
Value ($) |
#Shares Total |
SEC Form 4 |
| McCaffrey Mark | Chief Financial Officer | May 15 '24 | Sale | 133.69 | 4,058 | 542,497 | 112,473 | May 17 05:16 PM | | Chen Roger | Chief Operating Officer | May 01 '24 | Sale | 122.60 | 4,000 | 490,400 | 200,632 | May 03 06:23 PM | | McCaffrey Mark | Chief Financial Officer | Apr 02 '24 | Sale | 120.83 | 624 | 75,401 | 116,328 | Apr 03 09:18 PM | | Chen Roger | Chief Operating Officer | Apr 01 '24 | Sale | 118.56 | 4,000 | 474,240 | 204,632 | Apr 03 09:18 PM | | Bhutani Amanpal Singh | Chief Executive Officer | Mar 21 '24 | Sale | 120.00 | 2,500 | 300,000 | 384,323 | Mar 25 06:27 PM |
|
|
 |
 |
| Market Cap | 81.83B | EPS (ttm) | 3.27 |
| P/E | 41.64 | EPS this Y | 13.38% |
| Forward P/E | 35.10 | EPS next Y | 13.74% |
| PEG | 3.11 | EPS past 5Y | 10.05% |
| P/S | 6.37 | EPS next 5Y | 13.40% |
| P/B | 9.43 | EPS Q/Q | 23.35% |
| Dividend | 0.64% | Sales Q/Q | 9.49% |
| Insider Own | 0.55% | Inst Own | 96.57% |
| Insider Trans | -12.92% | Inst Trans | 0.04% |
| Short Float | 1.38% | Earnings | Apr 24/b |
| Analyst Recom | 2.00 | Target Price | 132.50 |
| Avg Volume | 3.19M | 52W Range | 72.77 - 137.38 |
|
|
|
|
Amphenol Corp. engages in the design, manufacture, and marketing of electrical, electronic and fiber optic connectors, interconnect systems, antennas, sensors and sensor-based products, and specialty cable. It operates through the following segments: Harsh Environment Solutions, Communications Solutions, and Interconnect and Sensor Systems. The Harsh Environment Solutions segment manufactures and markets a broad range of ruggedized interconnect products, including connectors and interconnect systems, printed circuits and printed circuit assemblies, and other products. The Communications Solutions segment focuses on the design, manufacture, and marketing of connector and interconnect systems, including radio frequency, power, fiber optic, and other products, together with antennas. The Interconnect and Sensor Systems segment is involved in the design, manufacture, and marketing of sensors, sensor-based systems, connectors, and value-add interconnect systems. The company was founded by Schmitt J. Arthur in 1932 and is headquartered in Wallingford, CT. |
| Insider Trading |
Relationship |
Date |
Transaction |
Cost |
#Shares |
Value ($) |
#Shares Total |
SEC Form 4 |
| WALTER LUC | President, HES Division | May 23 '24 | Option Exercise | 43.99 | 70,000 | 3,079,300 | 293,895 | May 24 10:44 AM | | WALTER LUC | President, HES Division | May 23 '24 | Sale | 135.68 | 70,000 | 9,497,334 | 223,895 | May 24 10:44 AM | | WALTER LUC | President, HES Division | May 22 '24 | Option Exercise | 43.99 | 155,000 | 6,818,450 | 313,640 | May 24 10:44 AM | | WALTER LUC | President, HES Division | May 22 '24 | Sale | 135.14 | 115,000 | 15,540,801 | 198,640 | May 24 10:44 AM | | Straub Peter | President, ISS Division | Mar 06 '24 | Option Exercise | 43.99 | 20,000 | 879,800 | 20,000 | Mar 07 08:55 AM |
|
|
|
 |
| Market Cap | 2.75B | EPS (ttm) | 2.89 |
| P/E | 29.48 | EPS this Y | 19.34% |
| Forward P/E | 12.29 | EPS next Y | 11.58% |
| PEG | 5.26 | EPS past 5Y | -11.48% |
| P/S | 1.27 | EPS next 5Y | 5.60% |
| P/B | 1.65 | EPS Q/Q | 26.61% |
| Dividend | 0.47% | Sales Q/Q | -2.12% |
| Insider Own | 1.38% | Inst Own | 97.44% |
| Insider Trans | -12.95% | Inst Trans | -2.26% |
| Short Float | 0.90% | Earnings | Apr 25/a |
| Analyst Recom | 1.25 | Target Price | 96.50 |
| Avg Volume | 142.87K | 52W Range | 48.61 - 84.54 |
|
|
|
|
Minerals Technologies, Inc. is a resource and technology-based company. It develops, produces, and markets a range of mineral, mineral-based, and synthetic mineral products. It operates through the Consumer and Specialties and Engineered Solutions segments. The Consumer and Specialties segment serves consumer end markets directly and provides mineral-based solutions and technologies that are essential to customers' products. The Engineered Solutions segment combines all engineered systems, mineral blends, and technologies that are designed to aid in customer processes and projects. The company was founded on February 19, 1968 and is headquartered in New York, NY. |
| Insider Trading |
Relationship |
Date |
Transaction |
Cost |
#Shares |
Value ($) |
#Shares Total |
SEC Form 4 |
| Hastings Jonathan J | Senior Vice President | May 21 '24 | Option Exercise | 60.19 | 7,814 | 470,286 | 61,676 | May 23 10:59 AM | | Hastings Jonathan J | Senior Vice President | May 21 '24 | Sale | 83.13 | 7,814 | 649,601 | 53,862 | May 23 10:59 AM | | JOHNSON KRISTINA M | Director | May 16 '24 | Buy | 80.92 | 400 | 32,368 | 400 | May 17 12:04 PM | | MONAGLE DJ III | Group President | Mar 22 '24 | Option Exercise | 65.16 | 1,180 | 76,889 | 82,211 | Mar 26 11:56 AM | | MONAGLE DJ III | Group President | Mar 22 '24 | Sale | 74.12 | 1,180 | 87,459 | 81,031 | Mar 26 11:56 AM |
|
|
| |
 |
| Market Cap | 906.34M | EPS (ttm) | 0.35 |
| P/E | 73.97 | EPS this Y | 20.89% |
| Forward P/E | 20.45 | EPS next Y | 39.89% |
| PEG | 4.93 | EPS past 5Y | - |
| P/S | 1.62 | EPS next 5Y | 15.00% |
| P/B | 3.91 | EPS Q/Q | -25.80% |
| Dividend | - | Sales Q/Q | 12.23% |
| Insider Own | 15.19% | Inst Own | 69.39% |
| Insider Trans | 0.89% | Inst Trans | 1.53% |
| Short Float | 4.37% | Earnings | Apr 30/b |
| Analyst Recom | 1.00 | Target Price | 27.67 |
| Avg Volume | 316.63K | 52W Range | 10.68 - 25.82 |
|
|
|
May-13-24 07:00AM
|
CECO Environmental Announces Upcoming Investor Conferences
(GlobeNewswire) |
|
May-02-24 01:59PM
|
Hedge Fund and Insider Trading News: Simon Sadler, John Paulson, Bill Ackman, Alden Global Capital, Greenlight Capital, Citadel LLC, Point72 Asset Management, CECO Environmental Corp. (CECO), Liberty SiriusXM Group (LSXMA), and More
(Insider Monkey) |
|
Apr-30-24 11:16PM
|
Q1 2024 CECO Environmental Corp Earnings Call
(Thomson Reuters StreetEvents) -14.85% |
|
11:55AM
|
CECO Stock Earnings: CECO Environmental Meets EPS, Misses Revenue for Q1 2024
(InvestorPlace) |
|
08:37AM
|
CECO Environmental Corp (CECO) Q1 2024 Earnings: Mixed Results Amidst Record Revenues
(GuruFocus.com) |
|
08:10AM
|
CECO Environmental (CECO) Q1 Earnings Meet Estimates
(Zacks) |
|
07:07AM
|
CECO: Q1 Earnings Snapshot
(Associated Press Finance) |
|
07:00AM
|
CECO Environmental Reports First Quarter 2024 Results
(GlobeNewswire) |
|
Apr-16-24 07:00AM
|
CECO Environmental to Release First Quarter Earnings and Host Conference Call on April 30
(GlobeNewswire) |
|
Apr-08-24 02:46PM
|
7 Small-Cap Stocks for the Thinking Speculator
(InvestorPlace) |
|
CECO Environmental Corp. engages in the provision of engineering technology and solutions. It offers services in the field of environment, energy, fluid handling, and filtration. The firm operates through the following segments: Energy Solutions, Industrial Solutions and Fluid Handling Solutions. The Energy Solutions segment improves air quality and solves fluid handling needs with market engineered, and customized solutions for the power generation, oil and gas, and petrochemical industries. The Industrial Solutions segment serves the industrial pollution control market. The Fluid Handling Solutions segment provides pump and filtration solutions that maintain safe and clean operations in some of the most harsh and toxic environments. The company was founded by Phillip DeZwirek in 1966 and is headquartered in Dallas, TX. |
| Insider Trading |
Relationship |
Date |
Transaction |
Cost |
#Shares |
Value ($) |
#Shares Total |
SEC Form 4 |
| WALLMAN RICHARD F | Director | May 21 '24 | Buy | 24.50 | 4,000 | 98,000 | 205,319 | May 22 11:44 AM | | WALLMAN RICHARD F | Director | May 01 '24 | Buy | 21.95 | 5,000 | 109,749 | 191,853 | May 02 08:12 AM | | WALLMAN RICHARD F | Director | Mar 06 '24 | Buy | 19.78 | 50,000 | 989,195 | 185,853 | Mar 08 09:28 AM | | SIEGEL LAURIE | Director | Mar 06 '24 | Buy | 19.87 | 2,500 | 49,664 | 7,906 | Mar 08 09:29 AM | | Gleason Todd R | Chief Executive Officer | Dec 21 '23 | Sale | 21.11 | 14,500 | 306,088 | 184,965 | Dec 26 09:28 AM |
|
|
|
 |
| Market Cap | 117.92B | EPS (ttm) | 15.41 |
| P/E | 29.65 | EPS this Y | 11.54% |
| Forward P/E | 25.03 | EPS next Y | 7.46% |
| PEG | 2.37 | EPS past 5Y | 11.42% |
| P/S | 11.59 | EPS next 5Y | 12.53% |
| P/B | 6.36 | EPS Q/Q | 56.65% |
| Dividend | - | Sales Q/Q | 14.21% |
| Insider Own | 0.24% | Inst Own | 92.81% |
| Insider Trans | -18.88% | Inst Trans | 1.21% |
| Short Float | 1.46% | Earnings | May 06/a |
| Analyst Recom | 1.97 | Target Price | 466.23 |
| Avg Volume | 1.04M | 52W Range | 320.01 - 453.71 |
|
|
|
|
Vertex Pharmaceuticals, Inc. is a global biotechnology company, which engages in the business of discovering, developing, manufacturing, and commercializing small molecule drugs for patients with serious diseases. The firm focuses on development and commercializing therapies for the treatment of cystic fibrosis, infectious diseases including viral infections such as influenza and bacterial infections, autoimmune diseases such as rheumatoid arthritis, cancer, inflammatory bowel disease and neurological disorders including pain and multiple sclerosis. The company was founded by Joshua S. Boger in 1989 and is headquartered in Boston, MA. |
| Insider Trading |
Relationship |
Date |
Transaction |
Cost |
#Shares |
Value ($) |
#Shares Total |
SEC Form 4 |
| SACHS BRUCE I | Director | May 22 '24 | Option Exercise | 93.51 | 7,073 | 661,396 | 47,073 | May 24 04:13 PM | | SACHS BRUCE I | Director | May 22 '24 | Sale | 448.00 | 7,073 | 3,168,704 | 40,000 | May 24 04:13 PM | | Kewalramani Reshma | CEO & President | May 20 '24 | Sale | 447.00 | 15,202 | 6,795,294 | 121,374 | May 22 04:21 PM | | Arbuckle Stuart A | EVP, COO | May 15 '24 | Sale | 430.93 | 69 | 29,734 | 49,691 | May 17 04:24 PM | | ALTSHULER DAVID | EVP, Chief Scientific Officer | May 15 '24 | Sale | 430.93 | 54 | 23,270 | 25,813 | May 17 04:22 PM |
|
|
| |
 |
| Market Cap | 79.20B | EPS (ttm) | 5.25 |
| P/E | 33.51 | EPS this Y | 5.10% |
| Forward P/E | 42.85 | EPS next Y | 11.20% |
| PEG | 4.09 | EPS past 5Y | 50.27% |
| P/S | 11.41 | EPS next 5Y | 8.20% |
| P/B | 7.19 | EPS Q/Q | -33.43% |
| Dividend | 1.19% | Sales Q/Q | 8.46% |
| Insider Own | 69.55% | Inst Own | 21.70% |
| Insider Trans | 0.00% | Inst Trans | -1.79% |
| Short Float | 1.21% | Earnings | May 02/b |
| Analyst Recom | 2.76 | Target Price | 166.78 |
| Avg Volume | 324.33K | 52W Range | 117.46 - 174.55 |
|
|
|
|
Thomson Reuters Corp. engages in the provision of news and information for professional markets. It operates through the following segments: Legal Professionals, Corporates, Tax and Accounting Professionals, Reuters News, and Global Print. The Legal Professionals segment provides research and workflow products to law firms and government. The Corporates segment serves corporate customers with full suite of content-enabled technology solutions for in-house legal, tax, regulatory, compliance, and information technology professionals. The Tax and Accounting Professionals segment offers research and workflow products focusing on intuitive tax offerings and automating tax workflows to tax, accounting, and audit professional in accounting firms. The Reuters News segment supplies business, financial, national, and international news to professionals via desktop terminals. The Global Print segment offers legal and tax information primarily in print format to customers around the world. The company was founded in 1799 and is headquartered in Toronto, Canada. |
|
|
 |
| Market Cap | 4.78B | EPS (ttm) | 1.76 |
| P/E | 59.98 | EPS this Y | 32.66% |
| Forward P/E | 34.77 | EPS next Y | 17.09% |
| PEG | 5.17 | EPS past 5Y | 25.47% |
| P/S | 14.05 | EPS next 5Y | 11.60% |
| P/B | 10.77 | EPS Q/Q | 43.26% |
| Dividend | 0.63% | Sales Q/Q | 33.89% |
| Insider Own | 38.74% | Inst Own | 51.02% |
| Insider Trans | 0.00% | Inst Trans | -0.86% |
| Short Float | 8.64% | Earnings | May 09/b |
| Analyst Recom | 1.38 | Target Price | 107.88 |
| Avg Volume | 415.25K | 52W Range | 26.70 - 105.92 |
|
|
|
|
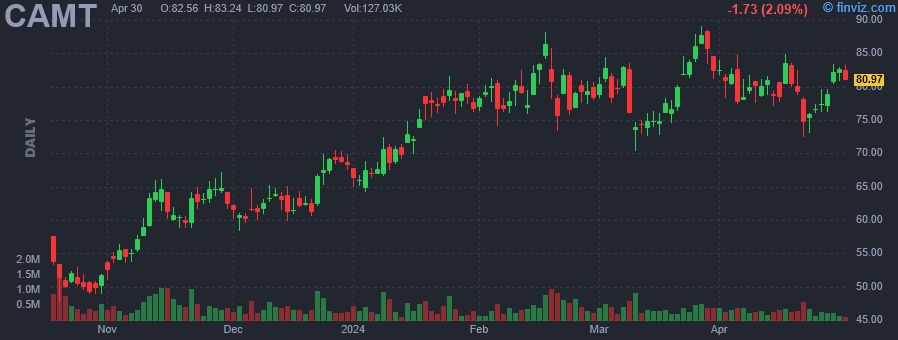
Camtek Ltd. engages in the business of developing and manufacturing high-end inspection and metrology equipment for the semiconductor industry. The firm is also involved in inspecting integrated circuits and measuring its features on wafers throughout the production process of semiconductor devices, covering the front and mid-end and up to the beginning of assembly. The company was founded on October 21, 1987 and is headquartered in Migdal HaEmek, Israel. |
|
| |
 |
| Market Cap | 1.58B | EPS (ttm) | 5.27 |
| P/E | 19.43 | EPS this Y | - |
| Forward P/E | - | EPS next Y | - |
| PEG | - | EPS past 5Y | 2.34% |
| P/S | 1.38 | EPS next 5Y | - |
| P/B | 1.70 | EPS Q/Q | 121.46% |
| Dividend | 2.31% | Sales Q/Q | 10.97% |
| Insider Own | 19.90% | Inst Own | 55.02% |
| Insider Trans | -0.49% | Inst Trans | -1.96% |
| Short Float | 4.13% | Earnings | May 10/b |
| Analyst Recom | - | Target Price | - |
| Avg Volume | 56.73K | 52W Range | 56.87 - 101.81 |
|
|
|
|
National HealthCare Corp. engages in the provision of nursing facilities, assisted living facilities, independent living facilities and homecare programs. It provides sub and post-acute nursing care, intermediate nursing care, rehabilitative care, senior living services and home health care services. It operates through the following segments: Inpatient Services, Homecare and Hospice Services, and All Other. The Inpatient Services segment includes the operation of skilled nursing facilities and assisted and independent living facilities. The Homecare and Hospice Services segment focuses on the revenues from rental income, management and accounting services fees, insurance services, and costs of the corporate office. The company was founded by Carl E. Adams in 1971 and is headquartered in Murfreesboro, TN. |
| Insider Trading |
Relationship |
Date |
Transaction |
Cost |
#Shares |
Value ($) |
#Shares Total |
SEC Form 4 |
| Flatt Stephen Fowler | CEO | May 17 '24 | Option Exercise | 53.94 | 2,500 | 134,850 | 62,725 | May 21 05:03 PM | | ADAMS W ANDREW | Director | May 07 '24 | Option Exercise | 77.92 | 7,500 | 584,400 | 262,072 | May 09 06:05 PM | | HASSAN EMIL E | Director | May 03 '24 | Option Exercise | 77.92 | 7,500 | 584,400 | 73,095 | May 06 05:32 PM | | BURGESS ERNEST G III | Director | May 01 '24 | Option Exercise | 77.92 | 7,500 | 584,400 | 92,500 | May 03 04:12 PM | | LAROCHE RICHARD F JR | Director | Apr 30 '24 | Option Exercise | 77.92 | 7,500 | 584,400 | 0 | May 01 04:40 PM |
|
|
|
 |
| Market Cap | 1.57B | EPS (ttm) | 1.83 |
| P/E | 23.71 | EPS this Y | 1.96% |
| Forward P/E | 17.86 | EPS next Y | 17.07% |
| PEG | 1.08 | EPS past 5Y | 29.60% |
| P/S | 0.56 | EPS next 5Y | 22.00% |
| P/B | 1.44 | EPS Q/Q | 10.77% |
| Dividend | 1.52% | Sales Q/Q | -2.75% |
| Insider Own | 2.59% | Inst Own | 95.29% |
| Insider Trans | -3.89% | Inst Trans | 0.44% |
| Short Float | 2.32% | Earnings | May 01/a |
| Analyst Recom | 2.00 | Target Price | 35.75 |
| Avg Volume | 340.97K | 52W Range | 22.66 - 43.34 |
|
|
|
|
Benchmark Electronics, Inc. engages in the provision of integrated electronic manufacturing services, engineering and design services, and technology solutions. It operates through the following geographical segments: Americas, Asia, and Europe. The firm offers services to original equipment manufacturers of industrial control telecommunication equipment, computers, and related products for business enterprises, medical devices, and testing and instrumentation products. Its services include comprehensive and integrated design and manufacturing services and solutions from initial product concept to volume production, including direct order fulfillment and aftermarket services. The company was founded by Cary T. Fu, Steven A. Barton, and Donald E. Nigbor in 1979 and is headquartered in Tempe, AZ. |
| Insider Trading |
Relationship |
Date |
Transaction |
Cost |
#Shares |
Value ($) |
#Shares Total |
SEC Form 4 |
| McCreary Jeffrey Stephen | Director | May 08 '24 | Sale | 39.49 | 10,000 | 394,900 | 45,062 | May 08 05:09 PM | | JANICK JAN M | SVP, Chief Technology Officer | May 07 '24 | Sale | 38.87 | 6,777 | 263,422 | 67,774 | May 08 05:06 PM | | Kamal Arvind | Interim CFO | May 07 '24 | Sale | 38.38 | 783 | 30,052 | 20,735 | May 08 05:04 PM | | Benck Jeff | President and CEO | Feb 20 '24 | Option Exercise | 29.22 | 68,305 | 1,995,872 | 442,749 | Feb 22 09:33 PM | | Beaver Stephen J | SVP, General Counsel and CLO | Feb 20 '24 | Option Exercise | 0.00 | 13,213 | 0 | 86,779 | Feb 22 09:35 PM |
|
|
|
 |
| Market Cap | 3.17B | EPS (ttm) | - |
| P/E | - | EPS this Y | 103.14% |
| Forward P/E | 63.87 | EPS next Y | 206.66% |
| PEG | - | EPS past 5Y | - |
| P/S | - | EPS next 5Y | - |
| P/B | - | EPS Q/Q | - |
| Dividend | - | Sales Q/Q | - |
| Insider Own | 66.32% | Inst Own | 29.70% |
| Insider Trans | 0.00% | Inst Trans | - |
| Short Float | 5.03% | Earnings | May 22/a |
| Analyst Recom | 2.14 | Target Price | 27.37 |
| Avg Volume | 872.54K | 52W Range | 18.71 - 28.55 |
|
|
|
|
BBB Foods, Inc. engages in the provision of a limited assortment of products that cover the daily grocery needs. It offers the grocery hard discount model where products offered are generally value for money. The company was founded by K. Anthony Hatoum on July 9, 2004 and is headquartered in Mexico City. |
|
|
