 |
| Market Cap | 4.18B | EPS (ttm) | 5.21 |
| P/E | 9.43 | EPS this Y | -1.91% |
| Forward P/E | 12.48 | EPS next Y | -3.03% |
| PEG | 1.18 | EPS past 5Y | 13.35% |
| P/S | 10.39 | EPS next 5Y | 8.00% |
| P/B | 1.68 | EPS Q/Q | 20.53% |
| Dividend | 7.43% | Sales Q/Q | 8.53% |
| Insider Own | 4.33% | Inst Own | 20.82% |
| Insider Trans | -0.33% | Inst Trans | 3.86% |
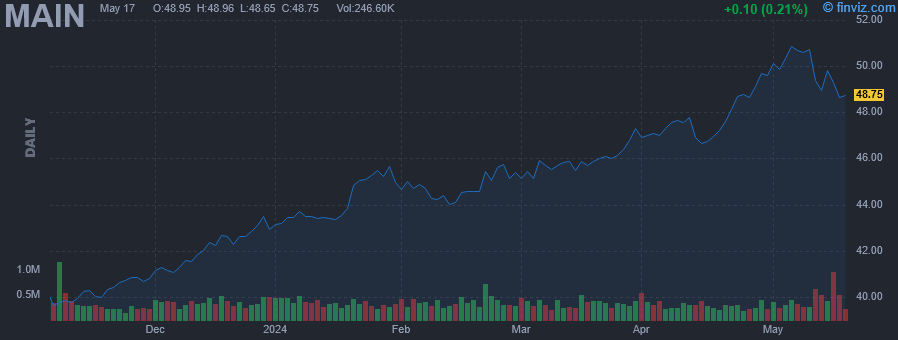
| Short Float | 4.05% | Earnings | May 09/a |
| Analyst Recom | 2.43 | Target Price | 45.67 |
| Avg Volume | 347.23K | 52W Range | 37.18 - 48.86 |
|
|
|
|
Main Street Capital is a principal investment firm that provides long-term debt and equity capital to lower middle market companies. Main Street's investments are primarily made to support management buyouts, recapitalizations, growth financings and acquisitions of companies that operate in diverse industry sectors and generally have annual revenues ranging from $10 million to $100 million. Main Street seeks to partner with entrepreneurs, business owners and management teams and generally provides ''one-stop'' financing alternatives to its portfolio companies. |
| Insider Trading |
Relationship |
Date |
Transaction |
Cost |
#Shares |
Value ($) |
#Shares Total |
SEC Form 4 |
| Meserve Nicholas | MANAGING DIRECTOR | Mar 07 '24 | Sale | 45.96 | 6,000 | 275,761 | 83,291 | Mar 11 04:30 PM | | Meserve Nicholas | MANAGING DIRECTOR | Dec 20 '23 | Sale | 43.01 | 6,000 | 258,084 | 89,210 | Jan 25 04:30 PM |
|
|
 |
 |
| Market Cap | 6.16B | EPS (ttm) | 3.65 |
| P/E | 8.79 | EPS this Y | 49.90% |
| Forward P/E | 9.56 | EPS next Y | -6.96% |
| PEG | - | EPS past 5Y | 190.80% |
| P/S | 5.38 | EPS next 5Y | - |
| P/B | 1.16 | EPS Q/Q | 15.70% |
| Dividend | 9.38% | Sales Q/Q | 21.30% |
| Insider Own | 0.10% | Inst Own | 39.80% |
| Insider Trans | 0.00% | Inst Trans | 21.85% |
| Short Float | 1.00% | Earnings | May 08/b |
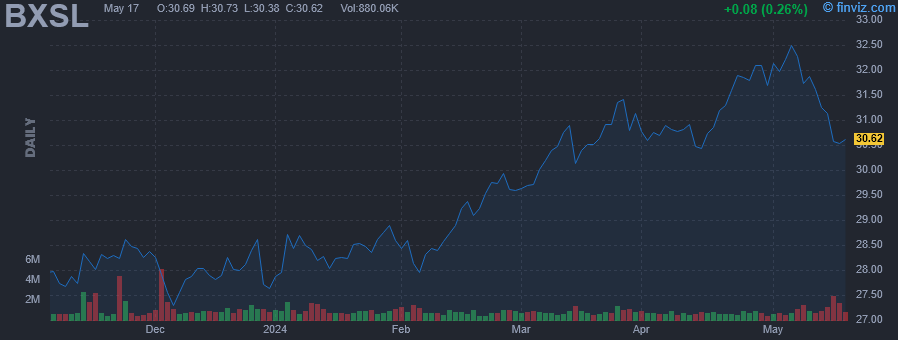
| Analyst Recom | 1.90 | Target Price | 31.18 |
| Avg Volume | 888.10K | 52W Range | 24.83 - 32.02 |
|
|
|
|
Blackstone Secured Lending Fund is business development company and a Delaware statutory trust formed on March 26, 2018, and structured as an externally managed, non-diversified closed-end investment Fund. On October 26, 2018, the fund elected to be regulated as a business development company (BDC) under the Investment Company Act of 1940, as amended (the 1940 Act). In addition, the Fund elected to be treated for U.S. federal income tax purposes, as a regulated investment company (RIC), as defined under Subchapter M of the Internal Revenue Code of 1986, as amended (the Code). The fund also intends to continue to comply with the requirements prescribed by the Code in order to maintain tax treatment as a RIC. The fund's investment objectives are to generate current income and, to a lesser extent, long-term capital appreciation. The Fund seeks to achieve its investment objective primarily through originated loans, equity and other securities, including syndicated loans, of private U.S. companies, specifically small and middle market companies, typically in the form of first lien senior secured and unitranche loans (including first out/last out loans), and to a lesser extent, second lien, third lien, unsecured and subordinated loans and other debt and equity securities. |
| Insider Trading |
Relationship |
Date |
Transaction |
Cost |
#Shares |
Value ($) |
#Shares Total |
SEC Form 4 |
| Whitaker Carlos | President | May 26 '23 | Buy | 25.68 | 3,895 | 100,024 | 3,895 | May 30 04:14 PM |
|
|
|
 |
| Market Cap | 8.28B | EPS (ttm) | 0.34 |
| P/E | 20.02 | EPS this Y | -2.49% |
| Forward P/E | 13.75 | EPS next Y | 14.21% |
| PEG | - | EPS past 5Y | - |
| P/S | 1.95 | EPS next 5Y | - |
| P/B | 1.36 | EPS Q/Q | 161.48% |
| Dividend | 1.78% | Sales Q/Q | 3.67% |
| Insider Own | 0.86% | Inst Own | 60.06% |
| Insider Trans | 0.00% | Inst Trans | 44.96% |
| Short Float | 0.94% | Earnings | May 07/a |
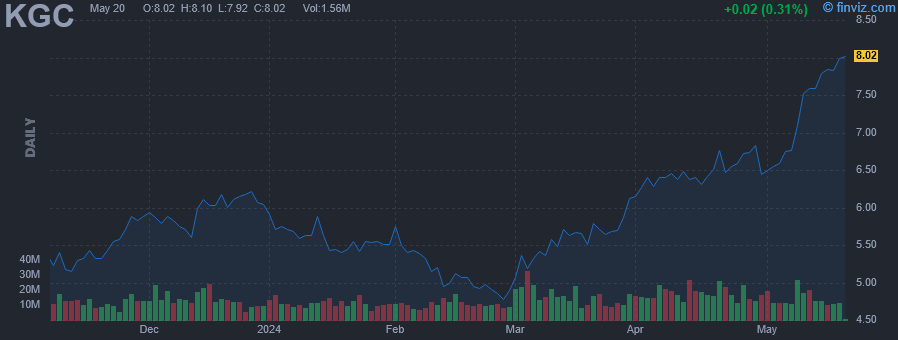
| Analyst Recom | 2.05 | Target Price | 7.97 |
| Avg Volume | 15.17M | 52W Range | 4.32 - 6.82 |
|
|
|
|
Kinross Gold Corp. engages in the production, acquisition, exploration, and development of gold properties. Its mining operations are in the United States, the Russian Federation, Brazil, Chile, Ghana, and Mauritania. The firm operates through the following business segments: Fort Knox, Round Mountain, Bald Mountain, Kupol, Paracatu, Tasiast, Chirano, and Corporate & Other. The Kupol segment consists of the Kupol and Dvoinoye mines. The Corporate & Other segment includes corporate, shutdown, and other non-operating assets and non-mining, and other operations. The company was founded by Robert MacKay Buchan on May 31, 1993 and is headquartered in Toronto, Canada. |
|
| |
 |
| Market Cap | 2.98B | EPS (ttm) | 1.82 |
| P/E | 9.58 | EPS this Y | 68.90% |
| Forward P/E | 9.84 | EPS next Y | -7.09% |
| PEG | 0.96 | EPS past 5Y | 2.50% |
| P/S | 4.73 | EPS next 5Y | 10.00% |
| P/B | 1.15 | EPS Q/Q | 198.40% |
| Dividend | 8.34% | Sales Q/Q | 20.40% |
| Insider Own | 2.71% | Inst Own | 45.20% |
| Insider Trans | 0.00% | Inst Trans | 1.66% |
| Short Float | 2.60% | Earnings | May 06/a |
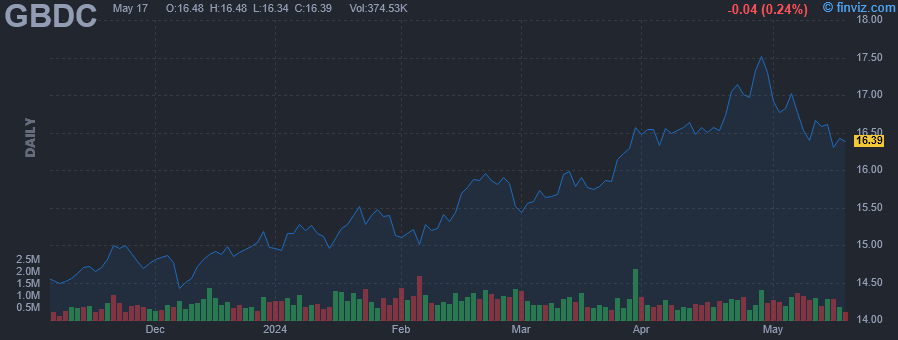
| Analyst Recom | 1.80 | Target Price | 16.70 |
| Avg Volume | 860.95K | 52W Range | 12.62 - 17.29 |
|
|
|
|
Golub Capital BDC, Inc. (GBDC) is a business development company and operates as an externally managed closed-end non-diversified management investment company. It invests in debt and minority equity investments in middle-market companies that are, in most cases, sponsored by private equity investors. It typically invests in diversified consumer services, automobiles, healthcare technology, insurance, health care equipment and supplies, hotels, restaurants and leisure, healthcare providers and services, IT services and specialty retails. It seeks to invest in the United States. It primarily invests in first lien traditional senior debt, first lien one stop, junior debt and equity, senior secured, one stop, unitranche, second lien, subordinated and mezzanine loans of middle-market companies, and warrants. |
| Insider Trading |
Relationship |
Date |
Transaction |
Cost |
#Shares |
Value ($) |
#Shares Total |
SEC Form 4 |
| Rival Anita J. | Director | May 25 '23 | Buy | 13.02 | 8,000 | 104,160 | 69,000 | May 30 04:16 PM |
|
|
|
 |
| Market Cap | 1.62B | EPS (ttm) | 4.57 |
| P/E | 7.45 | EPS this Y | 6.60% |
| Forward P/E | 7.32 | EPS next Y | 5.44% |
| PEG | 1.24 | EPS past 5Y | 5.50% |
| P/S | 2.97 | EPS next 5Y | 6.00% |
| P/B | 1.59 | EPS Q/Q | 15.50% |
| Dividend | 5.17% | Sales Q/Q | 6.90% |
| Insider Own | 1.14% | Inst Own | 72.50% |
| Insider Trans | 0.00% | Inst Trans | 0.24% |
| Short Float | 0.54% | Earnings | Apr 23/a |
| Analyst Recom | 2.00 | Target Price | 37.80 |
| Avg Volume | 214.78K | 52W Range | 22.93 - 34.29 |
|
|
|
|
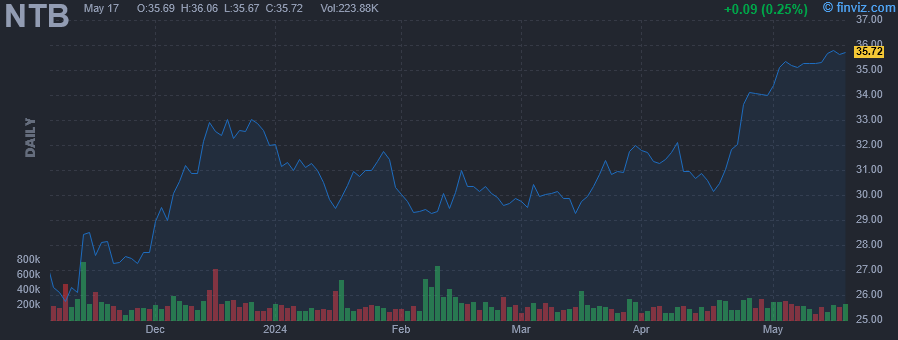
The Bank of N.T. Butterfield & Son Limited provides a range of community, commercial, and private banking services to individuals and small to medium-sized businesses. It accepts retail and corporate checking, savings, term, and interest bearing and non-interest bearing deposits. The company's lending portfolio includes residential mortgage lending, automobile lending, consumer financing, credit cards, overdraft facilities, commercial real estate lending, and commercial and industrial loans, as well as overdraft facilities to commercial and corporate customers. It also offers investment products and services; and cash and liquidity management, foreign exchange, custody administration, and settlement services. In addition, the company provides personal and property/auto insurance products; letters of credit; and cash management, payroll, remote banking, money market, advisory, brokerage, trust, estate, company management, wealth management, and fiduciary services. Further, it offers debit and credit cards; automated teller machines; and personal and business deposit, merchant acquiring, residential and commercial mortgages, and mobile and internet banking services. The company operates through offices in the Cayman Islands, Guernsey, Jersey, the United Kingdom, The Bahamas, Switzerland, Singapore, Mauritius, and Canada. It also operates in Bermuda and the Cayman Islands. The company was founded in 1784 and is headquartered in Hamilton, Bermuda. |
|
| |
 |
| Market Cap | 12.04B | EPS (ttm) | 16.84 |
| P/E | 5.47 | EPS this Y | -58.41% |
| Forward P/E | 11.79 | EPS next Y | 282.55% |
| PEG | 0.21 | EPS past 5Y | -10.38% |
| P/S | 2.05 | EPS next 5Y | 26.50% |
| P/B | 1.12 | EPS Q/Q | -83.25% |
| Dividend | 3.02% | Sales Q/Q | -65.24% |
| Insider Own | 17.03% | Inst Own | 90.86% |
| Insider Trans | 0.00% | Inst Trans | -2.81% |
| Short Float | 14.62% | Earnings | Apr 30/a |
| Analyst Recom | 1.95 | Target Price | 105.44 |
| Avg Volume | 1.87M | 52W Range | 72.84 - 91.54 |
|
|
|
|
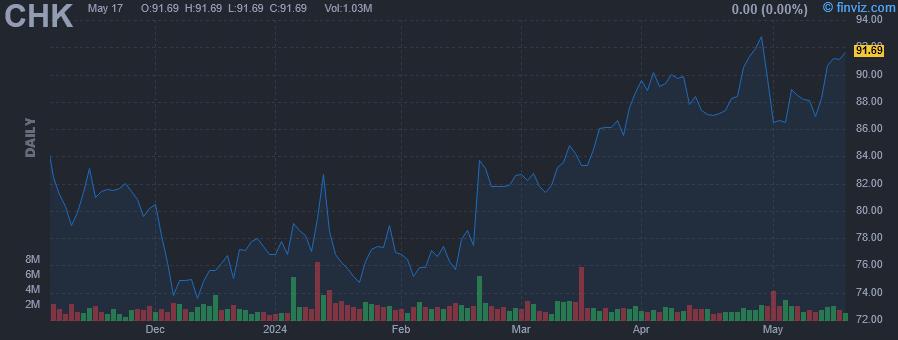
Chesapeake Energy Corp. engages in the acquisition, exploration, and development of properties for the production of oil, natural gas and natural gas liquids from underground reservoirs. It operates through the following areas: Marcellus, Haynesville, and Eagle Ford. The company was founded on May 18, 1989 and is headquartered in Oklahoma City, OK. |
|
|
 |
| Market Cap | 138.76B | EPS (ttm) | 25.61 |
| P/E | 16.69 | EPS this Y | 60.51% |
| Forward P/E | 10.55 | EPS next Y | 10.40% |
| PEG | 0.92 | EPS past 5Y | -1.98% |
| P/S | 1.19 | EPS next 5Y | 18.15% |
| P/B | 1.34 | EPS Q/Q | 31.78% |
| Dividend | 2.66% | Sales Q/Q | 26.32% |
| Insider Own | 0.54% | Inst Own | 72.78% |
| Insider Trans | -2.60% | Inst Trans | -0.22% |
| Short Float | 1.56% | Earnings | Apr 15/b |
| Analyst Recom | 1.77 | Target Price | 442.87 |
| Avg Volume | 2.39M | 52W Range | 289.36 - 425.35 |
|
|
|
|
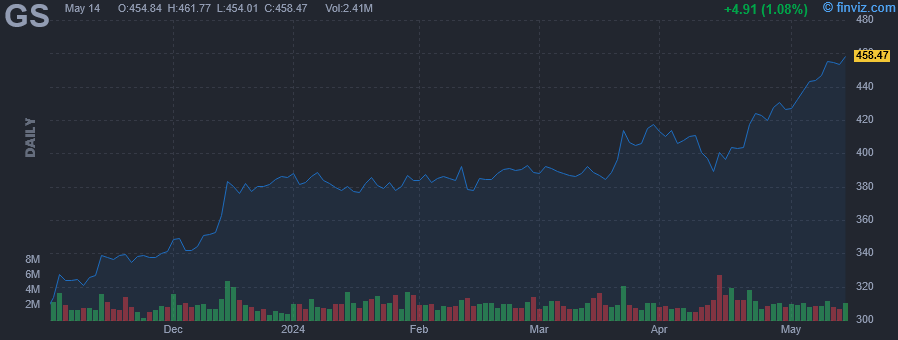
Provides investment banking, securities and asset management services |
| Insider Trading |
Relationship |
Date |
Transaction |
Cost |
#Shares |
Value ($) |
#Shares Total |
SEC Form 4 |
| COLEMAN DENIS P. | Chief Financial Officer | Feb 23 '24 | Sale | 394.43 | 12,680 | 5,001,372 | 29,417 | Feb 26 04:07 PM | | BERLINSKI PHILIP R. | Global Treasurer | Feb 22 '24 | Sale | 390.64 | 11,650 | 4,550,948 | 18,408 | Feb 26 04:09 PM | | Ruemmler Kathryn H. | Chief Legal Officer, GC | Jan 23 '24 | Sale | 379.81 | 7,277 | 2,763,877 | 6,501 | Jan 25 04:07 PM | | FREDMAN SHEARA J | Chief Accounting Officer | Jan 23 '24 | Sale | 380.15 | 4,300 | 1,634,645 | 11,463 | Jan 25 04:12 PM | | LEE BRIAN J | Chief Risk Officer | Jan 17 '24 | Sale | 375.72 | 6,500 | 2,442,195 | 14,308 | Jan 19 04:13 PM |
|
|
| |
 |
| Market Cap | 7.09B | EPS (ttm) | 2.19 |
| P/E | 32.29 | EPS this Y | 3.11% |
| Forward P/E | 23.14 | EPS next Y | 40.56% |
| PEG | - | EPS past 5Y | 97.48% |
| P/S | 5.83 | EPS next 5Y | - |
| P/B | 40.09 | EPS Q/Q | 38.45% |
| Dividend | 1.70% | Sales Q/Q | 10.11% |
| Insider Own | 1.21% | Inst Own | 89.74% |
| Insider Trans | 0.00% | Inst Trans | -1.59% |
| Short Float | 4.48% | Earnings | Apr 25/a |
| Analyst Recom | 1.36 | Target Price | 79.64 |
| Avg Volume | 916.38K | 52W Range | 26.79 - 74.44 |
|
|
|
|
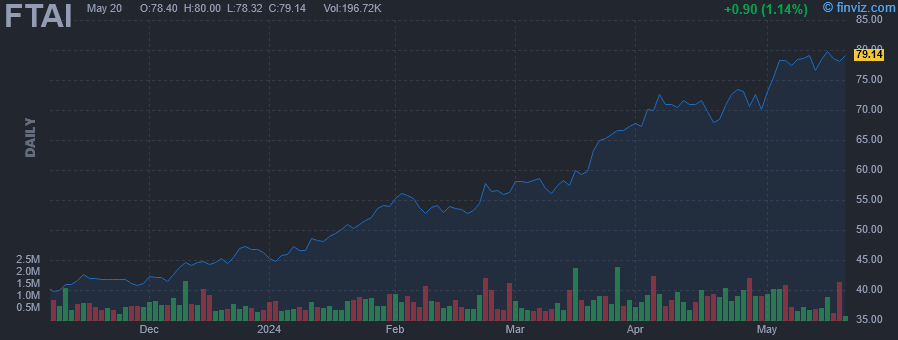
FTAI Aviation Ltd. manufactures, sells, and leases aerospace products. It operates through the Aviation Leasing and Aerospace Products segments. The Aviation Leasing segment owns and manages aviation assets, including aircraft and aircraft engines, which it leases and sells to customers. The Aerospace Products segment develops, manufactures, repairs, and sells aircraft engines and aftermarket components for aircraft engines. The company was founded on October 23, 2013 and is headquartered in New York, NY. |
| Insider Trading |
Relationship |
Date |
Transaction |
Cost |
#Shares |
Value ($) |
#Shares Total |
SEC Form 4 |
| Adams Joseph P. Jr. | CEO and Chairman | Aug 22 '23 | Option Exercise | 13.99 | 12,999 | 181,824 | 79,884 | Aug 24 07:23 AM | | Nicholson Kenneth J. | Director | Aug 22 '23 | Option Exercise | 13.99 | 12,999 | 181,824 | 122,782 | Aug 24 07:17 AM | | GOODWIN PAUL R | Director | Jul 31 '23 | Option Exercise | 14.77 | 5,000 | 73,850 | 117,527 | Aug 02 04:15 PM | | HANNAWAY JUDITH A | Director | May 16 '23 | Option Exercise | 17.39 | 5,000 | 86,950 | 5,000 | May 17 04:17 PM |
|
|
|
 |
| Market Cap | 9.03B | EPS (ttm) | 17.32 |
| P/E | 23.38 | EPS this Y | 8.01% |
| Forward P/E | 17.70 | EPS next Y | 12.49% |
| PEG | 3.49 | EPS past 5Y | 6.61% |
| P/S | 1.23 | EPS next 5Y | 6.70% |
| P/B | 2.68 | EPS Q/Q | 18.57% |
| Dividend | - | Sales Q/Q | 11.08% |
| Insider Own | 1.32% | Inst Own | 88.51% |
| Insider Trans | -0.43% | Inst Trans | -0.50% |
| Short Float | 1.16% | Earnings | Apr 24/a |
| Analyst Recom | 1.73 | Target Price | 411.98 |
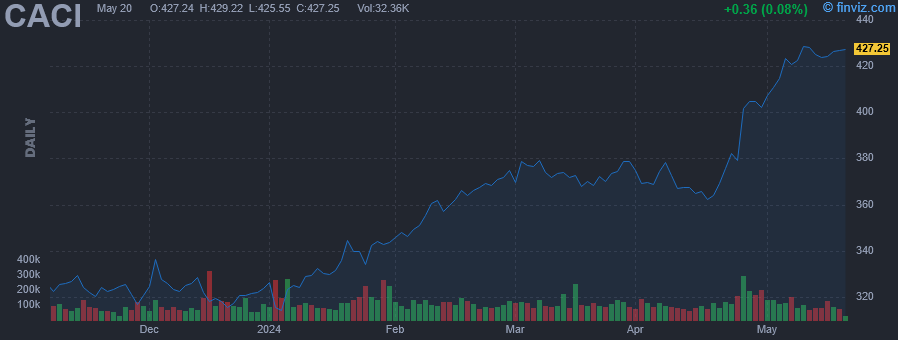
| Avg Volume | 120.77K | 52W Range | 293.69 - 403.85 |
|
|
|
|
CACI International, Inc. operates as holding company, which engages in the provision of information solutions and services in support of national security missions and government transformation for intelligence, defense, and federal civilian customers. It operates through the Domestic Operations and International Operations segment. The Domestic Operations segment offers information solutions and services to U.S. federal government agencies, state and local governments, and commercial enterprises to different market areas, including business systems, command and control, communications, cyber security, enterprise information technology (IT), health, intelligence services, investigation and litigation support, logistics and material readiness, and surveillance and reconnaissance. The International Operations segment includes the provision of IT services and proprietary data and software products, serving commercial and government customers. The company was founded by Herb Karr and Harry Markowitz in July 1962 and is headquartered in Reston, VA. |
| Insider Trading |
Relationship |
Date |
Transaction |
Cost |
#Shares |
Value ($) |
#Shares Total |
SEC Form 4 |
| Plunkett Debora A | Director | Mar 13 '24 | Sale | 373.82 | 270 | 100,931 | 2,146 | Mar 15 04:55 PM | | Koegel J William JR | EVP, General Counsel | Mar 06 '24 | Sale | 377.48 | 500 | 188,740 | 23,385 | Mar 08 01:51 PM | | Johnson Gregory G | Director | Feb 12 '24 | Sale | 361.69 | 150 | 54,254 | 6,446 | Feb 13 04:38 PM | | Plunkett Debora A | Director | Dec 13 '23 | Sale | 327.72 | 350 | 114,702 | 2,284 | Dec 19 05:35 PM | | Johnson Gregory G | Director | Sep 14 '23 | Sale | 319.82 | 125 | 39,978 | 5,998 | Sep 15 03:37 PM |
|
|
|
 |
| Market Cap | 6.21B | EPS (ttm) | 2.03 |
| P/E | 7.83 | EPS this Y | -0.92% |
| Forward P/E | 8.95 | EPS next Y | -6.91% |
| PEG | - | EPS past 5Y | 31.00% |
| P/S | 4.06 | EPS next 5Y | - |
| P/B | 1.03 | EPS Q/Q | -0.82% |
| Dividend | 9.29% | Sales Q/Q | 17.25% |
| Insider Own | 7.65% | Inst Own | 42.73% |
| Insider Trans | 0.01% | Inst Trans | -4.42% |
| Short Float | 2.20% | Earnings | May 08/a |
| Analyst Recom | 1.58 | Target Price | 15.88 |
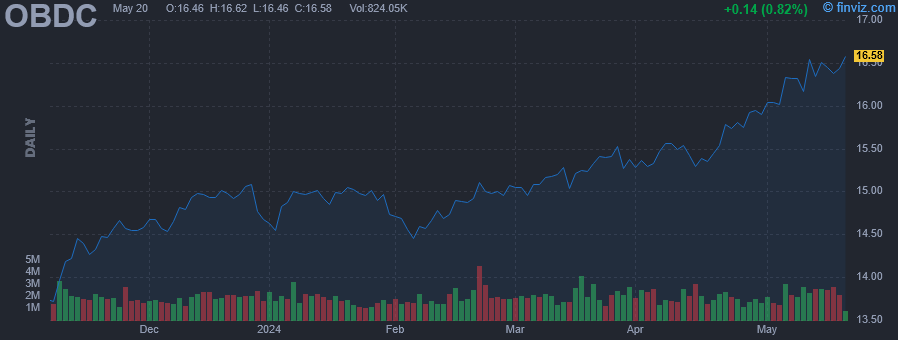
| Avg Volume | 2.04M | 52W Range | 11.95 - 15.85 |
|
|
|
|
Blue Owl Capital Cor seeks investment opportunities in middle market companies located in the United States with an EBITDA of USD 10 - 250 million and annual revenue of USD 50 million - 2.5 billion. The fund focuses on broad range of sectors including business services, healthcare services, pharma & healthcare technology, aerospace & defense, software & technology and manufacturing & industrials. it provides financing in the form of senior secured or unsecured loans, subordinated loans or mezzanine loans and a lesser extent, equity-related securities and warrants for growth, acquisitions, market or product expansion, re-financings and recapitalizations with an investment size ranging from $20 to $250 million and it also acts as a lead investor. |
| Insider Trading |
Relationship |
Date |
Transaction |
Cost |
#Shares |
Value ($) |
#Shares Total |
SEC Form 4 |
| DAlelio Edward H | Director | Mar 05 '24 | Buy | 15.07 | 3,000 | 45,210 | 6,217 | Mar 07 05:37 PM | | Temple Chris | Director | May 26 '23 | Buy | 13.30 | 5,900 | 78,470 | 36,000 | May 31 04:30 PM | | Swatt Matthew | Co-Treasurer and Co-Controller | May 25 '23 | Buy | 13.15 | 65 | 855 | 2,379 | May 26 04:31 PM | | Kaye Eric A. | Director | May 23 '23 | Buy | 13.34 | 3,749 | 50,012 | 19,144 | May 24 04:31 PM | | Packer Craig | President and CEO | May 19 '23 | Buy | 13.23 | 75,600 | 1,000,188 | 300,716 | May 22 04:30 PM |
|
|
|
