 |
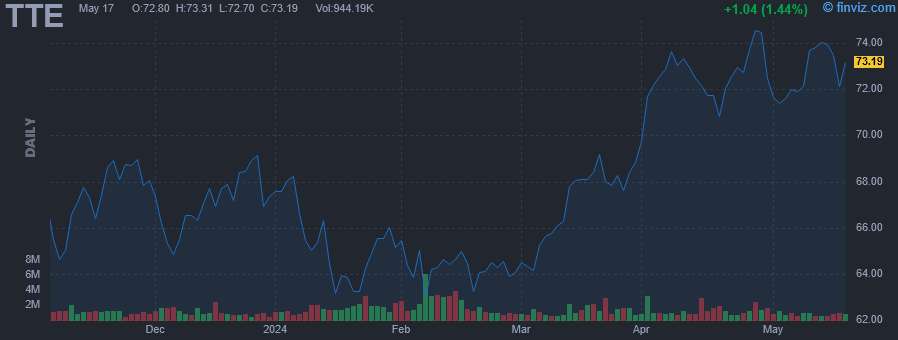
| Market Cap | 175.30B | EPS (ttm) | 8.97 |
| P/E | 8.32 | EPS this Y | -2.43% |
| Forward P/E | 8.09 | EPS next Y | 0.53% |
| PEG | - | EPS past 5Y | 15.04% |
| P/S | 0.82 | EPS next 5Y | -7.10% |
| P/B | 1.55 | EPS Q/Q | 7.96% |
| Dividend | 4.52% | Sales Q/Q | -10.90% |
| Insider Own | 0.00% | Inst Own | 6.58% |
| Insider Trans | - | Inst Trans | -5.44% |
| Short Float | 0.25% | Earnings | Apr 26/b |
| Analyst Recom | 1.96 | Target Price | 78.71 |
| Avg Volume | 1.70M | 52W Range | 54.94 - 74.06 |
|
|
|
|
TotalEnergies SE engages in the exploration and production of fuels, natural gas and low carbon electricity. It operates through the following business segments: Exploration & Production; Integrated Gas, Renewables & Power; Refining & Chemicals and Marketing & Services. The Exploration & Production segment encompasses oil and natural gas exploration and production activities. The Integrated Gas, Renewables & Power segment comprises integrated gas and low carbon electricity businesses. It also includes the upstream and midstream LNG activities. The Refining & Chemicals segment engages in the activities of refining, petrochemicals and specialty chemicals. This segment also includes the activities of oil supply, trading and marine shipping. The Marketing & Services segment includes the global activities of supply and marketing in the field of petroleum products. The company was founded on March 28, 1924 and is headquartered in Courbevoie, France. |
| Insider Trading |
Relationship |
Date |
Transaction |
Cost |
#Shares |
Value ($) |
#Shares Total |
SEC Form 4 |
| TotalEnergies SE | Director | Mar 28 '24 | Buy | 22.86 | 196,964 | 4,502,833 | 295,235 | Apr 01 04:45 PM | | TotalEnergies SE | Director | Mar 05 '24 | Option Exercise | 0.01 | 35,077,905 | 350,779 | 123,033,361 | Mar 07 04:16 PM |
|
|
 |
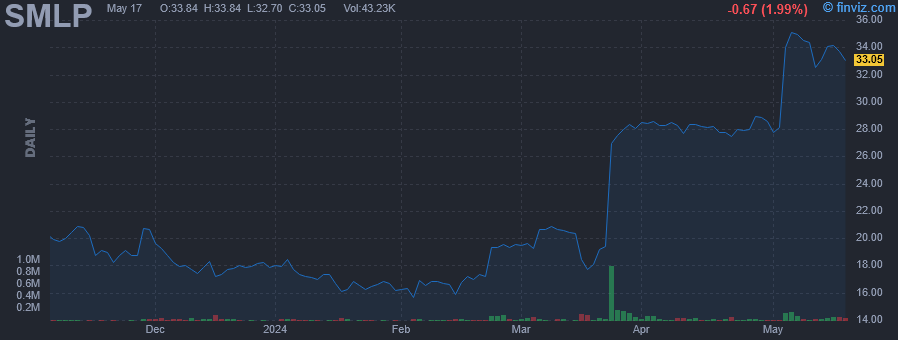 |
| Market Cap | 302.08M | EPS (ttm) | -6.11 |
| P/E | - | EPS this Y | - |
| Forward P/E | - | EPS next Y | - |
| PEG | - | EPS past 5Y | - |
| P/S | 0.66 | EPS next 5Y | - |
| P/B | 0.48 | EPS Q/Q | 30.18% |
| Dividend | - | Sales Q/Q | 48.52% |
| Insider Own | 13.90% | Inst Own | 45.14% |
| Insider Trans | -0.75% | Inst Trans | -2.68% |
| Short Float | 0.47% | Earnings | May 03/b |
| Analyst Recom | 3.00 | Target Price | 22.00 |
| Avg Volume | 53.58K | 52W Range | 13.00 - 29.18 |
|
|
|
|
Summit Midstream Partners LP develops, owns, and operates midstream energy infrastructure assets strategically located in unconventional resource basins, mainly shale formations. It operates through the following segments: Northeast, Rockies, Permian, Piceance, and Barnett. The Northeast segment is involved in Utica and Marcellus shale plays and the equity method investment in Ohio gathering that is the Utica Shale. The Rockies segment includes the wholly owned midstream assets in the Williston Basin and DJ Basin. The Permian segment covers equity method investment in double E. The Piceance segment offers midstream assets located in the Piceance Basin. The Barnett segment provides wholly owned midstream assets located in the Barnett Shale. The company was founded by Steven J. Newby in May 2012 and is headquartered in Houston, TX. |
| Insider Trading |
Relationship |
Date |
Transaction |
Cost |
#Shares |
Value ($) |
#Shares Total |
SEC Form 4 |
| Johnston James David | See remarks below. | Mar 22 '24 | Sale | 25.21 | 3,400 | 85,714 | 48,201 | Mar 22 07:59 PM | | Johnston James David | See remarks below. | Mar 15 '24 | Sale | 20.25 | 600 | 12,150 | 22,250 | Mar 19 08:19 PM | | Johnston James David | See remarks below. | Mar 06 '24 | Sale | 20.25 | 3,300 | 66,825 | 22,850 | Mar 06 07:07 PM | | Johnston James David | See remarks below. | Feb 29 '24 | Sale | 21.10 | 700 | 14,770 | 26,150 | Mar 01 05:49 PM | | Johnston James David | See remarks below. | Nov 08 '23 | Sale | 20.03 | 260 | 5,208 | 29,376 | Nov 08 06:15 PM |
|
|
|
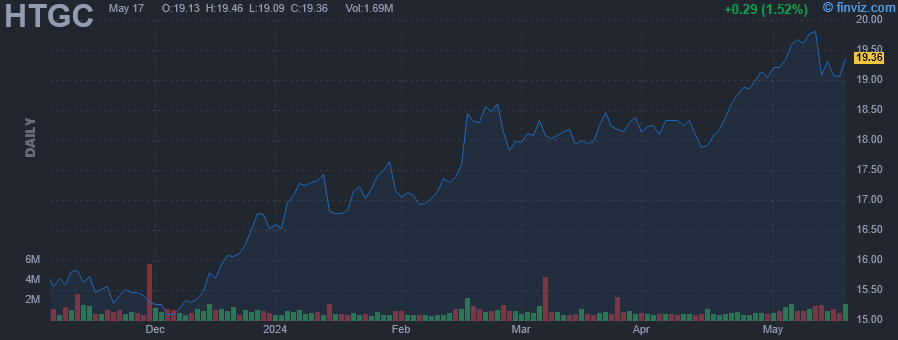 |
| Market Cap | 3.09B | EPS (ttm) | 2.28 |
| P/E | 8.35 | EPS this Y | -2.71% |
| Forward P/E | 9.55 | EPS next Y | -1.83% |
| PEG | 1.67 | EPS past 5Y | 22.58% |
| P/S | 6.59 | EPS next 5Y | 5.00% |
| P/B | 1.67 | EPS Q/Q | 60.98% |
| Dividend | 8.39% | Sales Q/Q | 27.38% |
| Insider Own | 1.97% | Inst Own | 25.84% |
| Insider Trans | 0.00% | Inst Trans | 1.00% |
| Short Float | 3.67% | Earnings | May 02/a |
| Analyst Recom | 1.89 | Target Price | 18.67 |
| Avg Volume | 927.93K | 52W Range | 12.15 - 19.03 |
|
|
|
|
Hercules is a non-bank lender to venture capital-backed companies at all stages of development in a broadly diversified variety of technology, life sciences, and sustainable and renewable technology industries. With over a decade of experience in venture debt, Hercules is uniquely positioned to create innovative financing solutions that perfectly fit within a company's existing capital structure and map to its business objectives. Recognized as the industry leader, Hercules understands the flexibility these types of companies need and has the experience to work closely with them, even through challenging times, to help them reach critical milestones. Hercules' deep sector expertise, geographic presence, and strong capital base have made Hercules the lender of choice for more than 480 innovative companies. |
| Insider Trading |
Relationship |
Date |
Transaction |
Cost |
#Shares |
Value ($) |
#Shares Total |
SEC Form 4 |
| Follmann Christian | Chief Operating Officer | May 24 '23 | Buy | 13.73 | 455 | 6,247 | 72,634 | May 25 04:18 PM | | Follmann Christian | Chief Operating Officer | May 24 '23 | Sale | 13.72 | 455 | 6,243 | 72,179 | May 25 04:18 PM | | CROWELL GAYLE A | Director | May 08 '23 | Buy | 13.66 | 7,200 | 98,352 | 38,845 | May 09 04:17 PM |
|
|
| |
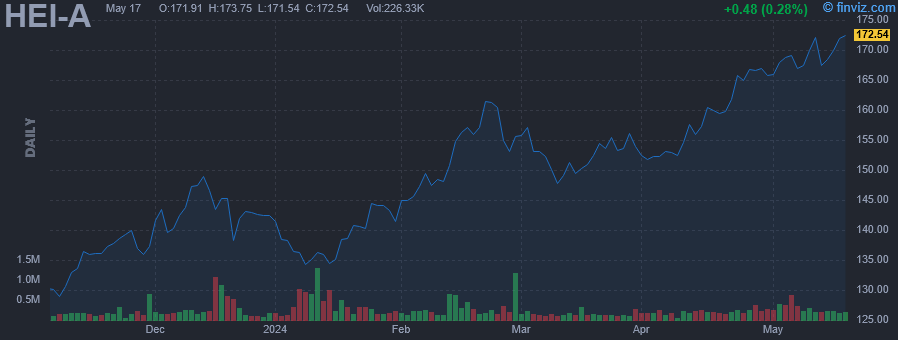 |
| Market Cap | 23.07B | EPS (ttm) | 3.05 |
| P/E | 54.59 | EPS this Y | 20.89% |
| Forward P/E | 39.38 | EPS next Y | 20.35% |
| PEG | - | EPS past 5Y | 8.91% |
| P/S | 7.11 | EPS next 5Y | - |
| P/B | 7.06 | EPS Q/Q | 22.14% |
| Dividend | 0.15% | Sales Q/Q | 44.36% |
| Insider Own | 45.26% | Inst Own | 51.32% |
| Insider Trans | -0.05% | Inst Trans | - |
| Short Float | 0.49% | Earnings | Feb 26/b |
| Analyst Recom | 1.89 | Target Price | 214.99 |
| Avg Volume | 238.22K | 52W Range | 121.43 - 167.28 |
|
|
|
|
HEICO Corp. engages in the manufacturing of electronic equipment for the aviation, defense, space, medical, telecommunications, and electronics industries. It operates through the Flight Support Group and Electronic Technologies Group segments. The Flight Support Group segment designs, manufactures, repairs, overhauls, and distributes jet engine and aircraft component replacement parts. The Electronic Technologies Group segment focuses on designing and manufacturing electronic, data and microwave, and electro-optical products, including infrared simulation and test equipment, laser rangefinder receivers, electrical power supplies, back-up power supplies, power conversion products, underwater locator beacons, emergency locator transmission beacons, flight deck annunciators, panels and indicators, electromagnetic and radio frequency interference shielding and filters, high power capacitor charging power supplies, amplifiers, traveling wave tube amplifiers, photo detectors, amplifier modules, microwave power modules, flash lamp drivers, laser diode drivers, arc lamp power supplies, custom power supply designs, cable assemblies, high voltage power supplies, high voltage interconnection devices and wire, high voltage energy generators, high frequency power delivery systems, and memory products. The company was founded in 1957 and is headquartered in Hollywood, FL. |
| Insider Trading |
Relationship |
Date |
Transaction |
Cost |
#Shares |
Value ($) |
#Shares Total |
SEC Form 4 |
| Schwitter Frank J | Director | Mar 28 '24 | Sale | 193.70 | 400 | 77,480 | 1,255 | Apr 01 04:11 PM | | SCHRIESHEIM ALAN | Director | Mar 22 '24 | Option Exercise | 0.57 | 35,000 | 19,996 | 181,966 | Mar 25 04:29 PM | | SCHRIESHEIM ALAN | Director | Mar 22 '24 | Sale | 192.18 | 26,000 | 4,996,784 | 155,862 | Mar 25 04:29 PM | | SCHRIESHEIM ALAN | Director | Jan 04 '24 | Option Exercise | 0.57 | 44,000 | 25,137 | 147,111 | Jan 05 06:47 PM | | Schwitter Frank J | Director | Jan 02 '24 | Sale | 178.06 | 550 | 97,930 | 1,655 | Jan 04 02:09 PM |
|
|
|
 |
| Market Cap | 4.39B | EPS (ttm) | 2.11 |
| P/E | 45.39 | EPS this Y | 7.25% |
| Forward P/E | 21.98 | EPS next Y | 20.89% |
| PEG | 1.82 | EPS past 5Y | - |
| P/S | 2.02 | EPS next 5Y | 25.00% |
| P/B | 3.32 | EPS Q/Q | 97.16% |
| Dividend | - | Sales Q/Q | 23.46% |
| Insider Own | 0.93% | Inst Own | 97.37% |
| Insider Trans | -8.64% | Inst Trans | 1.47% |
| Short Float | 3.29% | Earnings | May 02/b |
| Analyst Recom | 1.87 | Target Price | 102.82 |
| Avg Volume | 434.17K | 52W Range | 50.60 - 96.73 |
|
|
|
|
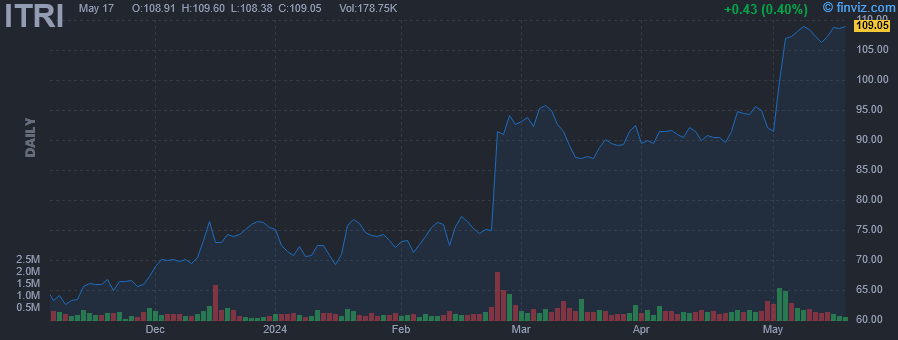
Itron, Inc. is a technology and services company, which engages in the provision of solutions that measure, manage, and analyze energy and water use. It operates through the following segments: Device Solutions, Networked Solutions, and Outcomes. The Device Solutions segment includes hardware products used for measurement, control, or sensing that do not have communications capability embedded for use with its broader Itron systems. The Networked Solutions segment offers a combination of communicating devices, network infrastructure, and associated application software designed and sold as a complete solution for acquiring and transporting robust application-specific data. The Outcomes segment consist of the firm's value-added, enhanced software and services operating segment in which it manage, organize, analyze, and interpret data to improve decision making, maximize operational profitability, drive resource efficiency, and deliver results for consumers, utilities, and smart cities. The company was founded in 1977 and is headquartered in Liberty Lake, WA. |
| Insider Trading |
Relationship |
Date |
Transaction |
Cost |
#Shares |
Value ($) |
#Shares Total |
SEC Form 4 |
| Deitrich Thomas | President & CEO | Mar 25 '24 | Option Exercise | 35.13 | 8,538 | 299,940 | 207,036 | Mar 26 03:32 PM | | Lande Jerome J. | Director | Mar 07 '24 | Sale | 95.25 | 14,896 | 1,418,895 | 5,750 | Mar 07 06:47 PM | | Deitrich Thomas | President & CEO | Feb 28 '24 | Sale | 91.02 | 3,353 | 305,198 | 198,498 | Feb 29 02:17 PM | | Hooper Joan S | SVP & CFO | Feb 28 '24 | Sale | 91.02 | 1,790 | 162,930 | 73,348 | Feb 29 02:54 PM | | Marcolini John F. | SVP, Networked Solutions | Feb 28 '24 | Sale | 91.02 | 636 | 57,890 | 15,803 | Feb 29 02:58 PM |
|
|
| |
 |
| Market Cap | 4.82B | EPS (ttm) | 1.97 |
| P/E | 48.33 | EPS this Y | -0.40% |
| Forward P/E | 46.61 | EPS next Y | 5.72% |
| PEG | 3.22 | EPS past 5Y | 7.81% |
| P/S | 8.91 | EPS next 5Y | 15.00% |
| P/B | 13.52 | EPS Q/Q | 4.70% |
| Dividend | 1.18% | Sales Q/Q | 3.30% |
| Insider Own | 1.48% | Inst Own | 93.46% |
| Insider Trans | -1.41% | Inst Trans | -0.42% |
| Short Float | 2.87% | Earnings | Apr 25/a |
| Analyst Recom | 2.33 | Target Price | 94.00 |
| Avg Volume | 301.77K | 52W Range | 64.61 - 101.65 |
|
|
|
|
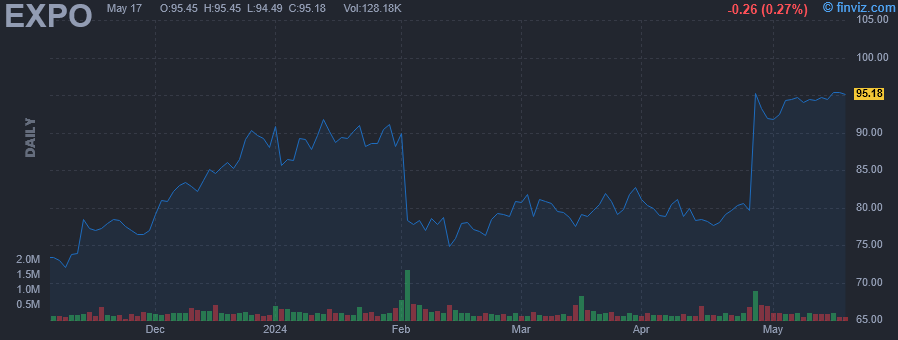
Exponent, Inc. is an engineering and scientific consulting company, which provides engineering, scientific, environmental, and health consulting services. It operates through the Engineering and Other Scientific, and Environmental and Health segments. The Engineering and Other Scientific segment includes technical consulting in different practices primarily in engineering. The Environmental and Health segment offers services in environmental, epidemiology, and health risk analysis. The company was founded by Bernard Ross in 1967 and is headquartered in Menlo Park, CA. |
| Insider Trading |
Relationship |
Date |
Transaction |
Cost |
#Shares |
Value ($) |
#Shares Total |
SEC Form 4 |
| Guyer Eric | Group Vice Presient | Feb 09 '24 | Sale | 78.49 | 3,367 | 264,289 | 0 | Feb 09 04:18 PM | | SCHLENKER RICHARD L JR | EVP & Chief Financial Officer | Feb 06 '24 | Option Exercise | 17.70 | 5,648 | 99,970 | 288,990 | Feb 08 03:00 PM | | Reitman Maureen T. F. | Group Vice President | Nov 24 '23 | Sale | 78.25 | 2,000 | 156,500 | 28,729 | Nov 27 08:10 PM | | James Bradley A | Group Vice President | Nov 22 '23 | Sale | 78.98 | 600 | 47,388 | 6,984 | Nov 24 12:48 PM | | Murray Steven J | Group Vice President | Aug 21 '23 | Sale | 89.50 | 1,000 | 89,500 | 27,412 | Aug 22 11:46 AM |
|
|
|
 |
| Market Cap | 5.75B | EPS (ttm) | 5.15 |
| P/E | 10.04 | EPS this Y | -11.15% |
| Forward P/E | 9.56 | EPS next Y | 18.35% |
| PEG | 0.38 | EPS past 5Y | 2.32% |
| P/S | 2.28 | EPS next 5Y | 26.16% |
| P/B | 0.80 | EPS Q/Q | 55.80% |
| Dividend | 1.71% | Sales Q/Q | 11.82% |
| Insider Own | 7.11% | Inst Own | 90.66% |
| Insider Trans | -1.59% | Inst Trans | -2.71% |
| Short Float | 4.32% | Earnings | May 06/a |
| Analyst Recom | 1.43 | Target Price | 55.57 |
| Avg Volume | 1.52M | 52W Range | 33.33 - 51.77 |
|
|
|
|
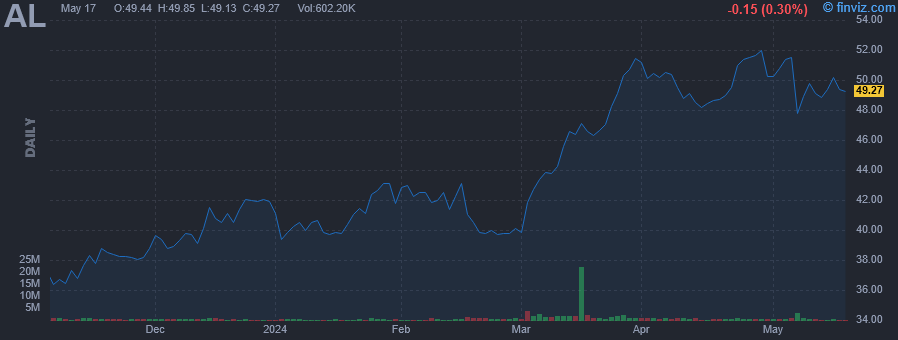
Air Lease Corp. engages in the provision of an aircraft leasing business. It focuses on purchasing new commercial jet transport aircraft directly from aircraft manufacturers and leasing those aircraft to airlines throughout the world with the intention to generate attractive returns on equity. The company was founded by Steven F. Udvar-Hazy in January 2010 and is headquartered in Los Angeles, CA. |
| Insider Trading |
Relationship |
Date |
Transaction |
Cost |
#Shares |
Value ($) |
#Shares Total |
SEC Form 4 |
| Khatibi Alex A | EVP | Mar 15 '24 | Sale | 47.37 | 11,199 | 530,447 | 76,300 | Mar 19 08:05 PM | | Levy Grant A | EVP | Mar 15 '24 | Sale | 46.82 | 7,500 | 351,165 | 150,815 | Mar 19 08:03 PM | | Khatibi Alex A | EVP | Mar 05 '24 | Sale | 43.11 | 11,198 | 482,740 | 87,499 | Mar 07 07:49 PM | | Korde Kishore | EVP | Feb 26 '24 | Sale | 39.70 | 16,593 | 658,664 | 112,375 | Feb 27 08:25 PM | | Plueger John L | CEO AND PRESIDENT | Feb 23 '24 | Sale | 40.06 | 28,515 | 1,142,391 | 808,842 | Feb 23 09:16 PM |
|
|
| |
 |
| Market Cap | 35.71B | EPS (ttm) | 1.04 |
| P/E | 89.89 | EPS this Y | 33.73% |
| Forward P/E | 30.92 | EPS next Y | 27.72% |
| PEG | 3.29 | EPS past 5Y | 82.85% |
| P/S | 5.12 | EPS next 5Y | 27.30% |
| P/B | 25.09 | EPS Q/Q | -112.91% |
| Dividend | 0.07% | Sales Q/Q | 7.76% |
| Insider Own | 4.36% | Inst Own | 88.68% |
| Insider Trans | -2.13% | Inst Trans | 3.03% |
| Short Float | 2.97% | Earnings | Apr 24/b |
| Analyst Recom | 1.21 | Target Price | 96.90 |
| Avg Volume | 8.91M | 52W Range | 13.06 - 94.39 |
|
|
|
|
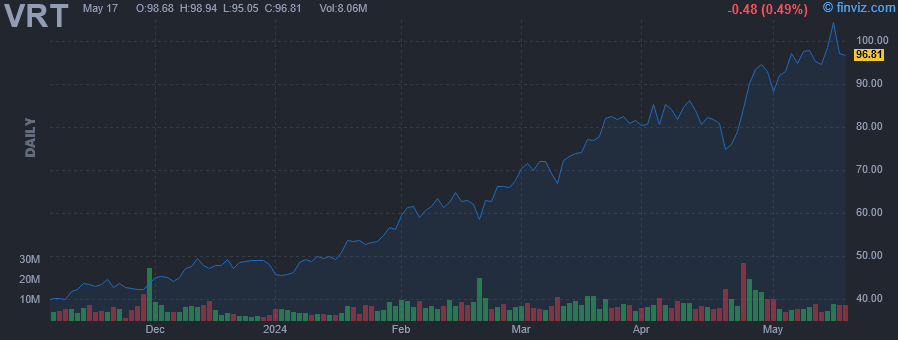
Vertiv Holdings Co. engages in the design, manufacture, and service of critical digital infrastructure technology that powers, cools, deploys, secures and maintains electronics that process, store and transmit data. It also offers power management products, thermal management products, integrated rack systems, modular solutions, and management systems for monitoring and controlling digital infrastructure. It operates through the following segments: Americas, Asia Pacific, and Europe, Middle East and Africa (EMEA). The Americas segment offers critical infrastructure and solutions, integrated rack solutions, and services and spares. The Asia Pacific segment includes products and services sold for applications within the data center, communication networks, and commercial or industrial markets throughout China, India, and the rest of Asia. The EMEA segment sells products and services for applications within the data center, communication networks and commercial/industrial markets. The company was founded on February 7, 2020 and is headquartered in Columbus, OH. |
| Insider Trading |
Relationship |
Date |
Transaction |
Cost |
#Shares |
Value ($) |
#Shares Total |
SEC Form 4 |
| Cripps Scott | Chief Accounting Officer | Mar 08 '24 | Option Exercise | 13.54 | 56,594 | 766,417 | 56,594 | Mar 11 09:13 PM | | Cripps Scott | Chief Accounting Officer | Mar 08 '24 | Sale | 70.76 | 56,594 | 4,004,869 | 0 | Mar 11 09:13 PM | | Liang Stephen | Chief Technology Officer & EVP | Mar 01 '24 | Option Exercise | 15.10 | 287,224 | 4,335,659 | 358,037 | Mar 05 09:01 PM | | Liang Stephen | Chief Technology Officer & EVP | Mar 01 '24 | Sale | 70.24 | 306,196 | 21,506,655 | 51,841 | Mar 05 09:01 PM | | VPE Holdings, LLC | Director | Sep 08 '23 | Sale | 37.50 | 10,000,000 | 375,000,000 | 7,955,215 | Sep 12 05:56 PM |
|
|
|
 |
| Market Cap | 26.09B | EPS (ttm) | 2.27 |
| P/E | 22.18 | EPS this Y | -30.33% |
| Forward P/E | 24.63 | EPS next Y | -23.03% |
| PEG | - | EPS past 5Y | -3.70% |
| P/S | 2.31 | EPS next 5Y | -12.76% |
| P/B | 1.37 | EPS Q/Q | -70.14% |
| Dividend | 0.65% | Sales Q/Q | 5.67% |
| Insider Own | 2.63% | Inst Own | 75.52% |
| Insider Trans | 0.00% | Inst Trans | -1.08% |
| Short Float | 1.26% | Earnings | Apr 25/b |
| Analyst Recom | 1.40 | Target Price | 53.15 |
| Avg Volume | 4.16M | 52W Range | 34.38 - 50.46 |
|
|
|
|
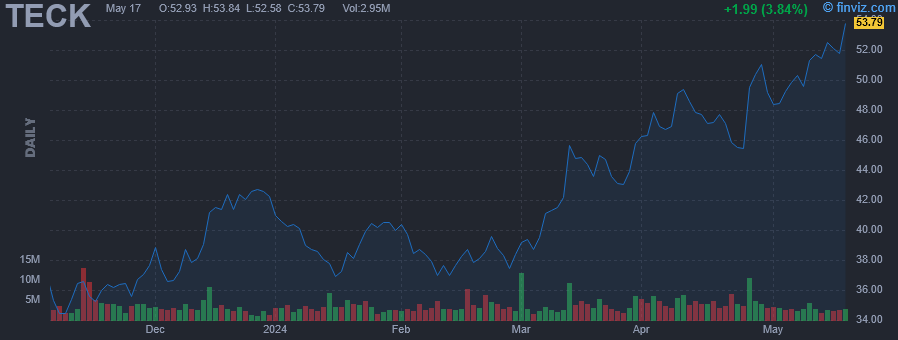
Teck Resources Limited is a resource company, which engages in the exploration, acquisition, development, production, and sale of natural resources. Its products include steelmaking coal, copper, zinc, industrial products and fertilizers, and other metals. Its project operations are located in Canada, Peru, U.S., and Chile. The company was founded on September 24, 1951 and is headquartered in Vancouver, Canada. |
|
|
 |
| Market Cap | 2.78B | EPS (ttm) | -1.27 |
| P/E | - | EPS this Y | 19.25% |
| Forward P/E | 11.26 | EPS next Y | 20.44% |
| PEG | - | EPS past 5Y | -49.28% |
| P/S | 0.50 | EPS next 5Y | - |
| P/B | 2.06 | EPS Q/Q | -20.47% |
| Dividend | 2.58% | Sales Q/Q | -13.69% |
| Insider Own | 78.71% | Inst Own | 22.51% |
| Insider Trans | 0.00% | Inst Trans | -0.40% |
| Short Float | 2.41% | Earnings | May 02/a |
| Analyst Recom | 1.57 | Target Price | 16.86 |
| Avg Volume | 381.80K | 52W Range | 6.85 - 15.51 |
|
|
|
|
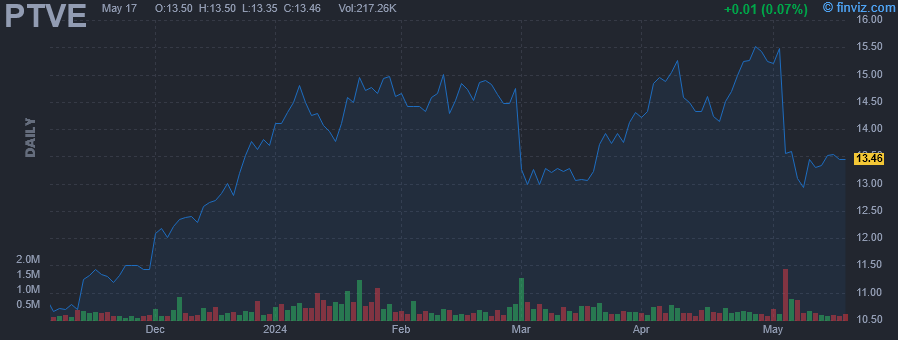
Pactiv Evergreen Inc. engages in the manufacture, distribution, and merchandising of fresh food and beverages services. It operates through the following segments: Foodservice, Food Merchandising, and Beverages Merchandising. The Foodservice segment manufactures ready to eat products. The Food Merchandising segment includes protecting and attractively displaying food while preserving freshness. The Beverage Merchandising segment includes production of cartons for refrigerated beverage products. The company was founded on May 30, 2006 and is headquartered in Lake Forest, IL. |
|
|
