 |
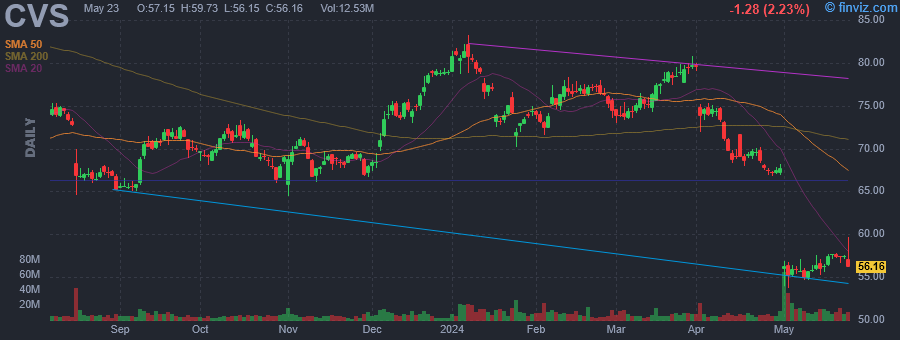
| Market Cap | 70.35B | EPS (ttm) | 5.69 |
| P/E | 9.82 | EPS this Y | -16.24% |
| Forward P/E | 6.86 | EPS next Y | 11.29% |
| PEG | 4.76 | EPS past 5Y | - |
| P/S | 0.19 | EPS next 5Y | 2.06% |
| P/B | 0.95 | EPS Q/Q | -46.91% |
| Dividend | 4.49% | Sales Q/Q | 3.60% |
| Insider Own | 0.17% | Inst Own | 82.00% |
| Insider Trans | -0.80% | Inst Trans | 0.60% |
| Short Float | 1.43% | Earnings | May 01/b |
| Analyst Recom | 1.90 | Target Price | 72.87 |
| Avg Volume | 10.75M | 52W Range | 53.70 - 83.25 |
|
|
|
|
CVS Health Corp. is a health solutions company, which engages in the provision of healthcare services. It operates through the following segments: Health Care Benefits, Health Services, Pharmacy and Consumer Wellness, and Corporate and Other. The Health Care Benefits segment operates as a health care benefits provider. The Health Services segment offers a full range of PBM solutions, delivers health care services in its medical clinics, virtually, and in the home. The Pharmacy & Consumer Wellness segment dispenses prescriptions in its retail pharmacies and through its infusion operations. The Corporate and Other Segment is involved in management and administrative expenses. The company was founded by Stanley P. Goldstein and Ralph Hoagland in 1963 and is headquartered in Woonsocket, RI. |
| Insider Trading |
Relationship |
Date |
Transaction |
Cost |
#Shares |
Value ($) |
#Shares Total |
SEC Form 4 |
| Mahoney Michael F | Director | May 02 '24 | Buy | 54.49 | 9,181 | 500,294 | 9,356 | May 02 04:30 PM | | LUDWIG EDWARD J | Director | May 02 '24 | Buy | 53.88 | 1,000 | 53,879 | 21,630 | May 02 04:31 PM | | Shah Prem S | EVP and Pres-Pharm, Consumer W | Feb 16 '24 | Sale | 76.95 | 29,473 | 2,267,947 | 39,765 | Feb 16 06:46 PM | | LUDWIG EDWARD J | Director | Nov 03 '23 | Buy | 70.47 | 2,000 | 140,930 | 20,630 | Nov 06 10:59 AM | | Clark James David | SVP, Cont & Chief Acct Officer | Aug 03 '23 | Sale | 74.92 | 25,759 | 1,930,004 | 4,698 | Aug 04 05:41 PM |
|
|
 |
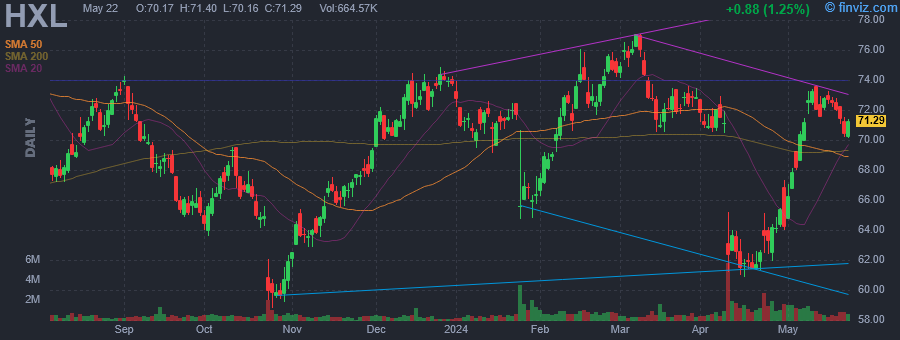 |
| Market Cap | 5.66B | EPS (ttm) | 1.16 |
| P/E | 58.59 | EPS this Y | 22.96% |
| Forward P/E | 23.27 | EPS next Y | 31.61% |
| PEG | 2.66 | EPS past 5Y | -16.84% |
| P/S | 3.15 | EPS next 5Y | 22.00% |
| P/B | 3.47 | EPS Q/Q | -13.82% |
| Dividend | 0.88% | Sales Q/Q | 1.72% |
| Insider Own | 0.65% | Inst Own | 98.55% |
| Insider Trans | 8.79% | Inst Trans | 1.71% |
| Short Float | 1.29% | Earnings | Apr 22/a |
| Analyst Recom | 2.55 | Target Price | 76.29 |
| Avg Volume | 994.70K | 52W Range | 58.81 - 79.08 |
|
|
|
May-02-24 04:50PM
|
Hexcel Insider Bought Shares Worth $993,763, According to a Recent SEC Filing
(MT Newswires) |
|
Apr-30-24 09:03PM
|
Director Cynthia Egnotovich Acquires 4,000 Shares of Hexcel Corp (HXL)
(GuruFocus.com) |
|
04:29PM
|
Hexcel Insider Bought Shares Worth $257,560, According to a Recent SEC Filing
(MT Newswires) |
|
09:42AM
|
Deutsche Bank Adjusts Price Target on Hexcel to $70 From $71, Maintains Hold Rating
(MT Newswires) |
|
Apr-29-24 07:00PM
|
Hexcel Corp (HXL) Chairman and CEO Nick Stanage Acquires 15,000 Shares
(GuruFocus.com) |
|
07:00PM
|
Director Jeffrey Campbell Acquires 10,000 Shares of Hexcel Corp (HXL)
(GuruFocus.com) |
|
04:21PM
|
Hexcel Insider Bought Shares Worth $641,300, According to a Recent SEC Filing
(MT Newswires) |
|
Apr-24-24 01:44PM
|
Analyst Report: Hexcel Corporation
(Morningstar Research) |
|
11:22AM
|
Hexcel Corporation (NYSE:HXL) Q1 2024 Earnings Call Transcript
(Insider Monkey) |
|
03:08AM
|
Hexcel Corp (HXL) Q1 2024 Earnings Call Transcript Highlights: Navigating Through Aerospace and ...
(GuruFocus.com) |
|
Hexcel Corp. engages in the development, manufacture, and marketing of lightweight structural materials. It operates through the Composite Materials and Engineered Products segments. The Composite Materials segment includes carbon fiber, specialty reinforcements, resins, prepregs and other fiber-reinforced matrix materials, and honeycomb core product lines and pultruded profiles. The Engineered Products segment refers to the lightweight high strength composite structures, engineered core and honeycomb products with added functionality, and additive manufacturing. The company was founded by Roger C. Steele and Roscoe T. Hughes in 1946 and is headquartered in Stamford, CT. |
| Insider Trading |
Relationship |
Date |
Transaction |
Cost |
#Shares |
Value ($) |
#Shares Total |
SEC Form 4 |
| Gentile Tom | CEO and President | May 01 '24 | Buy | 66.25 | 15,000 | 993,763 | 15,000 | May 02 04:26 PM | | HACHEY GUY C | Director | Apr 29 '24 | Buy | 64.53 | 3,000 | 193,590 | 3,000 | Apr 30 04:04 PM | | HACHEY GUY C | Director | Apr 29 '24 | Buy | 64.31 | 2,000 | 128,620 | 5,000 | Apr 30 04:04 PM | | Stanage Nick L | Chairman, CEO and President | Apr 26 '24 | Buy | 64.29 | 15,000 | 964,350 | 392,446 | Apr 29 04:01 PM | | EGNOTOVICH CYNTHIA M | Director | Apr 26 '24 | Buy | 64.39 | 4,000 | 257,560 | 4,000 | Apr 30 04:01 PM |
|
|
|
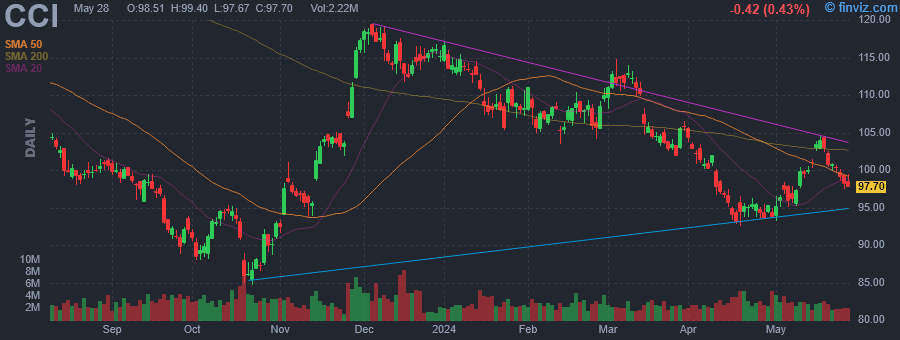 |
| Market Cap | 42.32B | EPS (ttm) | 3.21 |
| P/E | 30.38 | EPS this Y | -16.88% |
| Forward P/E | 37.95 | EPS next Y | -10.77% |
| PEG | - | EPS past 5Y | 23.06% |
| P/S | 6.18 | EPS next 5Y | -8.67% |
| P/B | 7.00 | EPS Q/Q | -25.77% |
| Dividend | 6.43% | Sales Q/Q | -7.45% |
| Insider Own | 0.42% | Inst Own | 91.86% |
| Insider Trans | -0.26% | Inst Trans | 0.38% |
| Short Float | 1.19% | Earnings | Apr 17/a |
| Analyst Recom | 2.65 | Target Price | 111.38 |
| Avg Volume | 2.89M | 52W Range | 84.72 - 120.37 |
|
|
|
|
Crown Castle, Inc. engages in the business of owning, operating, and leasing shared communications infrastructure. It operates through the following segments: Towers, Fiber, and Other. The Towers segment focuses on providing coverage and capacity for wireless carrier network deployments. The Fiber segment includes communications infrastructure offerings of small cells and fiber solutions. The Other segment is involved in corporate assets such as cash and cash equivalents. The company was founded by Ted B. Miller Jr. and Edward C. Hutcheson Jr. in 1994 and is headquartered in Houston, TX. |
| Insider Trading |
Relationship |
Date |
Transaction |
Cost |
#Shares |
Value ($) |
#Shares Total |
SEC Form 4 |
| Chan Edmond | EVP and CIO | Apr 10 '24 | Option Exercise | 0.00 | 2,260 | 0 | 2,260 | Apr 11 04:24 PM | | Collins Robert Sean | Vice President and Controller | Mar 05 '24 | Sale | 113.49 | 3,250 | 368,842 | 8,275 | Mar 06 04:36 PM | | Collins Robert Sean | Vice President and Controller | Feb 19 '24 | Option Exercise | 0.00 | 2,181 | 0 | 12,216 | Feb 21 04:45 PM | | Adams Edward B JR | EVP and General Counsel | Feb 19 '24 | Option Exercise | 0.00 | 3,345 | 0 | 22,532 | Feb 21 04:42 PM | | SCHLANGER DANIEL K | EVP & Chief Financial Officer | Feb 19 '24 | Option Exercise | 0.00 | 8,206 | 0 | 111,467 | Feb 21 04:47 PM |
|
|
| |
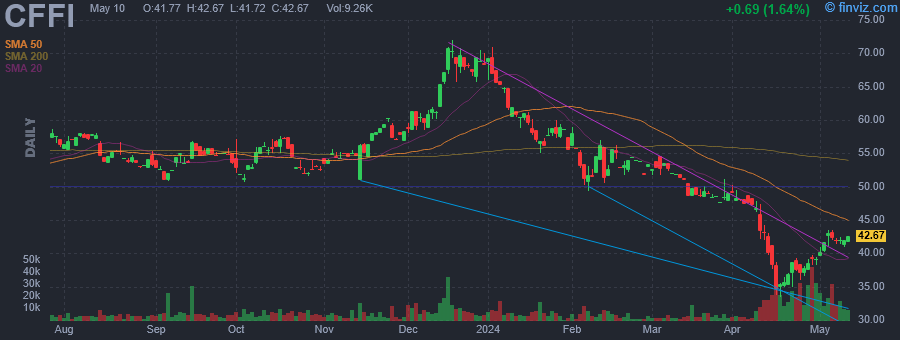 |
| Market Cap | 145.31M | EPS (ttm) | 6.06 |
| P/E | 7.11 | EPS this Y | - |
| Forward P/E | - | EPS next Y | - |
| PEG | - | EPS past 5Y | 6.09% |
| P/S | 0.92 | EPS next 5Y | - |
| P/B | 0.67 | EPS Q/Q | -45.73% |
| Dividend | 4.08% | Sales Q/Q | 9.39% |
| Insider Own | 6.68% | Inst Own | 37.34% |
| Insider Trans | 0.24% | Inst Trans | 3.87% |
| Short Float | 0.80% | Earnings | - |
| Analyst Recom | - | Target Price | - |
| Avg Volume | 9.41K | 52W Range | 33.51 - 72.00 |
|
|
|
|
C&F Financial Corp. is a bank holding company, which engages in the provision of banking services to individuals and businesses. It operates through the following segments: Community Banking, Mortgage Banking and Consumer Finance. The Community Banking segment provides checking and savings deposit accounts, business, real estate, development, mortgage, home equity, and installment loans. The Mortgage Banking segment offers ancillary mortgage loan origination services for loan settlement and residential appraisals. The Consumer Finance segment consists of automobile financing through lending programs that are designed to serve customers in the non-prime market who have limited access to traditional automobile financing. The company was founded on March 8, 1994 and is headquartered in Toano, VA. |
| Insider Trading |
Relationship |
Date |
Transaction |
Cost |
#Shares |
Value ($) |
#Shares Total |
SEC Form 4 |
| Sisson George R III | Director | Apr 30 '24 | Buy | 39.47 | 1,000 | 39,465 | 5,635 | May 02 04:19 PM | | Long Jason E | EVP, CHIEF FINANCIAL OFFICER | Apr 24 '24 | Buy | 38.47 | 500 | 19,235 | 10,200 | Apr 25 01:05 PM | | PEAY D ANTHONY | Director | Feb 29 '24 | Sale | 51.78 | 455 | 23,560 | 1,800 | Mar 04 03:46 PM | | Seaman John A III | EVP, CHIEF CREDIT OFFICER | Dec 13 '23 | Sale | 63.22 | 500 | 31,610 | 6,941 | Dec 14 03:38 PM | | Crone S Dustin | Pres and CEO of C&F Finance | Jun 08 '23 | Sale | 56.87 | 1,000 | 56,870 | 9,631 | Jun 12 12:58 PM |
|
|
|
 |
| Market Cap | 11.75M | EPS (ttm) | - |
| P/E | - | EPS this Y | - |
| Forward P/E | - | EPS next Y | - |
| PEG | - | EPS past 5Y | - |
| P/S | - | EPS next 5Y | - |
| P/B | - | EPS Q/Q | - |
| Dividend | - | Sales Q/Q | - |
| Insider Own | - | Inst Own | 64.87% |
| Insider Trans | - | Inst Trans | 0.11% |
| Short Float | 0.67% | Earnings | - |
| Analyst Recom | - | Target Price | - |
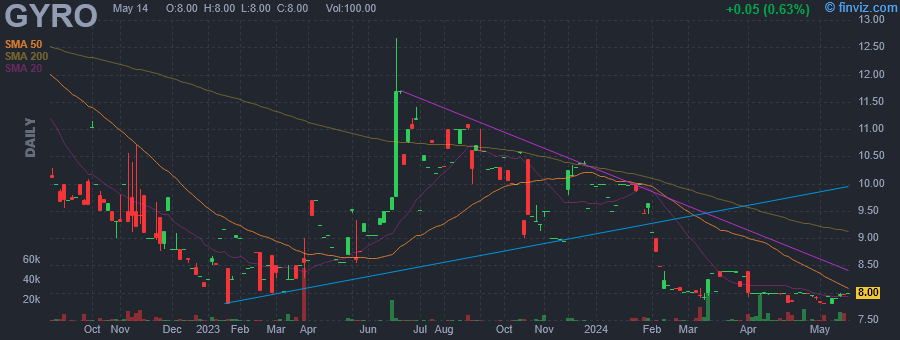
| Avg Volume | 3.83K | 52W Range | 7.79 - 12.66 |
|
|
|
|
Gyrodyne LLC engages in the management of a portfolio of medical office and industrial properties. Its properties include Flowerfield, Port Jefferson Professional Park, Courtland Medical Center, and Grove. The company was founded by Peter James Papadakos in 1946 and is headquartered in St. James, NY. |
| Insider Trading |
Relationship |
Date |
Transaction |
Cost |
#Shares |
Value ($) |
#Shares Total |
SEC Form 4 |
| TOWERVIEW LLC | 10% Owner | May 02 '24 | Buy | 7.80 | 1,846 | 14,399 | 347,000 | May 02 04:18 PM | | TOWERVIEW LLC | 10% Owner | May 01 '24 | Buy | 7.83 | 424 | 3,320 | 345,154 | May 02 04:18 PM | | TOWERVIEW LLC | 10% Owner | Apr 16 '24 | Buy | 7.84 | 2,434 | 19,083 | 344,730 | Apr 18 08:54 AM | | LAMB PAUL L | Director | Apr 01 '24 | Sale | 7.99 | 4,368 | 34,916 | 111,328 | Apr 04 01:03 PM |
|
|
| |
 |
| Market Cap | 2.97B | EPS (ttm) | 4.23 |
| P/E | 28.49 | EPS this Y | 34.01% |
| Forward P/E | 20.36 | EPS next Y | 18.86% |
| PEG | 1.45 | EPS past 5Y | - |
| P/S | 2.55 | EPS next 5Y | 19.60% |
| P/B | 1.81 | EPS Q/Q | 1525.52% |
| Dividend | 1.99% | Sales Q/Q | 13.11% |
| Insider Own | 3.25% | Inst Own | 93.01% |
| Insider Trans | -1.56% | Inst Trans | -6.12% |
| Short Float | 1.68% | Earnings | Apr 25/b |
| Analyst Recom | 1.00 | Target Price | 136.25 |
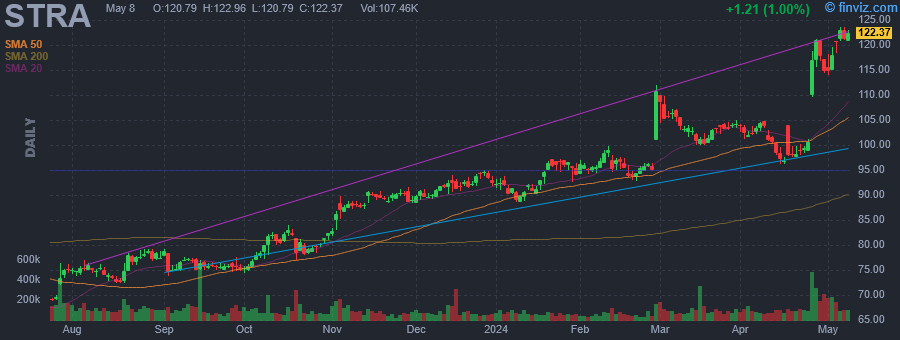
| Avg Volume | 115.97K | 52W Range | 64.53 - 121.29 |
|
|
|
|
Strategic Education, Inc. engages in the provision of educational services. It provides access to education through campus-based and online post-secondary education offerings, as well as through programs to develop job-ready skills. The firm operates through three segments: U.S. Higher Education, Education Technology Services and Australia/New Zealand. The U.S. Higher Education segment primarily consists of Strayer University and Capella University and focuses on providing flexible and affordable certificate and degree programs to working adults. The Education Technology Services segment focuses on developing and maintaining relationships with employers to build employee education benefits programs. The Australia/New Zealand segment through Torrens University and associated assets, provides certificate and degree programs in Australia and New Zealand. The company was founded in 1892 and is headquartered in Herndon, VA. |
| Insider Trading |
Relationship |
Date |
Transaction |
Cost |
#Shares |
Value ($) |
#Shares Total |
SEC Form 4 |
| GILLIGAN J KEVIN | Vice Chairman | May 04 '29 | Sale | 148.88 | 739 | 110,022 | 6,293 | May 05 04:36 PM | | DINH VIET D | Director | Apr 30 '24 | Buy | 114.83 | 4,300 | 493,769 | 15,020 | May 02 04:14 PM | | GRUSKY ROBERT R | Director | Apr 29 '24 | Sale | 120.99 | 462 | 55,897 | 11,945 | May 01 04:39 PM | | MCDONNELL RAYMOND KARL | CHIEF EXECUTIVE OFFICER | Feb 27 '24 | Sale | 95.99 | 12,820 | 1,230,592 | 161,359 | Feb 29 04:46 PM | | JACKSON DANIEL WAYNE | CHIEF FINANCIAL OFFICER | Feb 27 '24 | Sale | 95.95 | 3,713 | 356,262 | 71,770 | Feb 29 04:48 PM |
|
|
|
 |
| Market Cap | 126.02M | EPS (ttm) | 2.60 |
| P/E | 6.37 | EPS this Y | -59.54% |
| Forward P/E | 11.42 | EPS next Y | 10.27% |
| PEG | - | EPS past 5Y | 18.59% |
| P/S | 0.96 | EPS next 5Y | - |
| P/B | 0.64 | EPS Q/Q | -64.11% |
| Dividend | 2.42% | Sales Q/Q | 12.20% |
| Insider Own | 9.81% | Inst Own | 55.48% |
| Insider Trans | 0.65% | Inst Trans | -2.06% |
| Short Float | 2.14% | Earnings | Apr 22/b |
| Analyst Recom | 2.00 | Target Price | 20.75 |
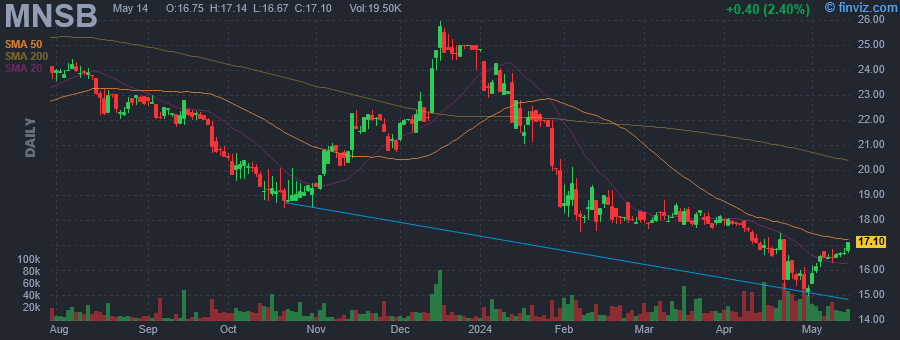
| Avg Volume | 25.28K | 52W Range | 14.97 - 25.97 |
|
|
|
|
MainStreet Bancshares, Inc. is a holding company, which engages in the provision of banking solutions through MainStreet Bank. It offers products and services such as checking, deposits, loans, credit cards, mortgages, and savings. The company was founded on March 28, 2003 and is headquartered in Fairfax, VA. |
| Insider Trading |
Relationship |
Date |
Transaction |
Cost |
#Shares |
Value ($) |
#Shares Total |
SEC Form 4 |
| ECHLOV RUSSELL | Director | May 02 '24 | Buy | 16.02 | 200 | 3,204 | 4,003 | May 02 04:14 PM | | DICK JEFF W | Chairman, President and CEO | Apr 29 '24 | Buy | 16.12 | 1,056 | 17,018 | 191,133 | Apr 29 11:28 AM | | ECHLOV RUSSELL | Director | Apr 26 '24 | Buy | 15.62 | 200 | 3,124 | 3,803 | Apr 26 08:44 AM | | Brockett Charles C. | Director | Apr 24 '24 | Buy | 16.40 | 710 | 11,644 | 92,318 | Apr 25 07:35 AM | | Brockett Charles C. | Director | Apr 24 '24 | Buy | 16.40 | 450 | 7,380 | 852 | Apr 25 07:35 AM |
|
|
| |
 |
| Market Cap | 131.54B | EPS (ttm) | 0.96 |
| P/E | 32.19 | EPS this Y | 9.94% |
| Forward P/E | 15.53 | EPS next Y | 72.40% |
| PEG | 0.81 | EPS past 5Y | -38.29% |
| P/S | 2.38 | EPS next 5Y | 39.84% |
| P/B | 1.24 | EPS Q/Q | 86.47% |
| Dividend | 1.68% | Sales Q/Q | 8.61% |
| Insider Own | 0.05% | Inst Own | 65.85% |
| Insider Trans | 0.66% | Inst Trans | -1.78% |
| Short Float | 1.79% | Earnings | Apr 25/a |
| Analyst Recom | 2.84 | Target Price | 40.09 |
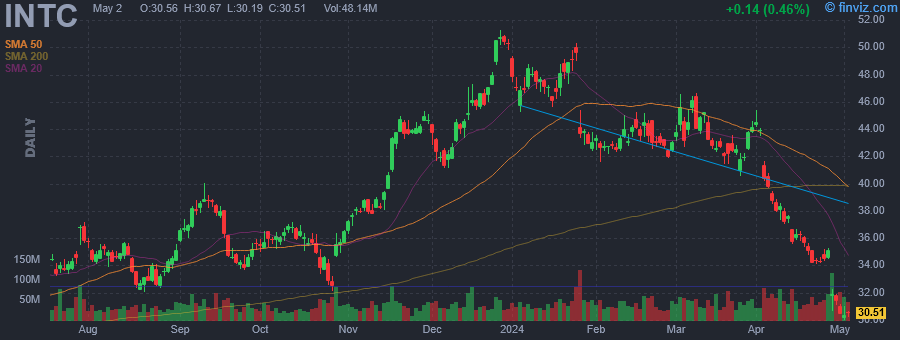
| Avg Volume | 49.15M | 52W Range | 26.85 - 51.28 |
|
|
|
|
Intel Corp. engages in the design, manufacture, and sale of computer products and technologies. It delivers computer, networking, data storage, and communications platforms. The firm operates through the following segments: Client Computing Group (CCG), Data Center and AI (DCAI), Network and Edge (NEX), Mobileye, Accelerated Computing Systems and Graphics (AXG), Intel Foundry Services (IFS), and All Other. The CCG segment consists of platforms designed for notebooks, 2-in-1 systems, desktops, tablets, phones, wireless and wired connectivity products, and mobile communication components. The DCAI segment delivers solutions to cloud service providers and enterprise customers, along with silicon devices for communications service providers and high-performance computing customers. The NEX segment offers computing system solutions from inflexible fixed-function hardware to general-purpose compute, acceleration, and networking devices running cloud native software on programmable hardware. The Mobileye segment develops driving assistance and self-driving solutions. The AXG segment provides products and technologies designed to help customers solve the toughest computational problems. Its products include CPUs for high-performance computing and GPUs targeted for a range of workloads and platforms, from gaming and content creation on client devices to delivering media and gaming in the cloud, and the most demanding high-performance computing and AI workloads on supercomputers. The IFS segment refers to full stack solutions created from the foundry industry ecosystem. The All Other segment represents results from other non-reportable segments and corporate-related charges. The company was founded by Robert Norton Noyce and Gordon Earle Moore on July 18, 1968, and is headquartered in Santa Clara, CA. |
| Insider Trading |
Relationship |
Date |
Transaction |
Cost |
#Shares |
Value ($) |
#Shares Total |
SEC Form 4 |
| GELSINGER PATRICK P | CEO | May 01 '24 | Buy | 30.29 | 4,100 | 124,173 | 39,375 | May 02 04:12 PM | | GELSINGER PATRICK P | CEO | Apr 29 '24 | Buy | 31.42 | 4,000 | 125,674 | 35,275 | May 01 04:05 PM | | GELSINGER PATRICK P | CEO | Feb 01 '24 | Buy | 42.74 | 2,800 | 119,671 | 31,275 | Feb 02 04:27 PM | | GELSINGER PATRICK P | CEO | Jan 29 '24 | Buy | 43.36 | 3,000 | 130,083 | 28,475 | Jan 30 04:56 PM | | GELSINGER PATRICK P | CEO | Nov 01 '23 | Buy | 36.80 | 6,775 | 249,333 | 25,475 | Nov 02 05:40 PM |
|
|
|
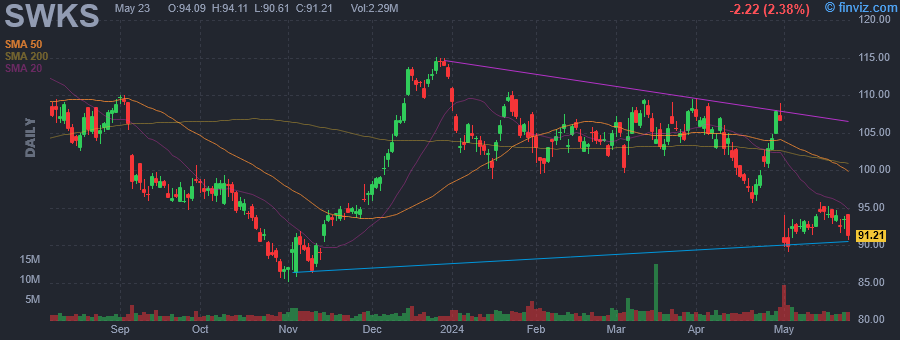 |
| Market Cap | 14.84B | EPS (ttm) | 5.32 |
| P/E | 17.38 | EPS this Y | -26.56% |
| Forward P/E | 14.01 | EPS next Y | 5.52% |
| PEG | 1.16 | EPS past 5Y | 4.11% |
| P/S | 3.27 | EPS next 5Y | 15.00% |
| P/B | 2.33 | EPS Q/Q | -21.99% |
| Dividend | 2.96% | Sales Q/Q | -9.29% |
| Insider Own | 0.36% | Inst Own | 86.68% |
| Insider Trans | -3.60% | Inst Trans | 1.45% |
| Short Float | 4.48% | Earnings | Apr 30/a |
| Analyst Recom | 2.67 | Target Price | 102.32 |
| Avg Volume | 2.47M | 52W Range | 85.06 - 115.69 |
|
|
|
May-03-24 06:21PM
|
Why Skyworks Solutions Stock Sank This Week
(Motley Fool) |
|
May-02-24 04:43PM
|
Skyworks Solutions Insider Bought Shares Worth $1,002,780, According to a Recent SEC Filing
(MT Newswires) |
|
04:13PM
|
Qualcomm Stock Breaks Out On Beat-And-Raise Report
(Investor's Business Daily) |
|
02:19PM
|
3 5G Technology Stocks With the Potential to Make You an Overnight Millionaire
(InvestorPlace) |
|
May-01-24 07:52PM
|
Analyst Report: Skyworks Solutions, Inc.
(Morningstar Research) -15.28% |
|
05:04PM
|
Qualcomm Delivers Beat-And-Raise Report As Diversification Efforts Pay Off
(Investor's Business Daily) |
|
04:54PM
|
S&P 500 Gains and Losses Today: CVS Falls as Health Care Costs Pressure Profits
(Investopedia) |
|
04:52PM
|
Nvidia Stock Drops After Rival AMD Gives Uninspiring Outlook
(Investor's Business Daily) |
|
04:30PM
|
These Stocks Moved the Most Today: CVS, AMD, Super Micro, Amazon, Starbucks, Pfizer, Norwegian, Pinterest, DuPont, and More
(Barrons.com) |
|
02:54PM
|
These Stocks Are Moving the Most Today: CVS, AMD, Super Micro, Amazon, Starbucks, Pfizer, Norwegian, Pinterest, DuPont, and More
(Barrons.com) |
|
Skyworks Solutions, Inc. engages in the design, development, and manufacture of proprietary semiconductor products. Its products include amplifiers, attenuators, circulators, demodulators, detectors, diodes, directional couplers, front-end modules, hybrids, isolators, lighting and display solutions, mixers, modulators, optocouplers, opt isolators, phase shifters, synthesizers, power dividers and combiners, receivers, switches, and technical ceramics. The company was founded in 1962 and is headquartered in Irvine, CA. |
| Insider Trading |
Relationship |
Date |
Transaction |
Cost |
#Shares |
Value ($) |
#Shares Total |
SEC Form 4 |
| GRIFFIN LIAM | Chairman, CEO and President | May 02 '24 | Buy | 90.00 | 11,142 | 1,002,780 | 104,153 | May 02 04:03 PM | | Durham Karilee A | SVP, Human Resources | Dec 14 '23 | Sale | 110.00 | 3,189 | 350,790 | 17,323 | Dec 15 06:38 PM | | Kasnavi Reza | SVP, Tech. & Manufacturing | Nov 17 '23 | Sale | 94.04 | 5,289 | 497,378 | 19,078 | Nov 20 06:30 PM | | TERRY ROBERT JOHN | SVP, Gen. Counsel & Secretary | Nov 14 '23 | Sale | 91.65 | 4,457 | 408,497 | 14,045 | Nov 16 06:30 PM | | Kasnavi Reza | SVP, Tech. & Manufacturing | Nov 13 '23 | Sale | 89.09 | 3,873 | 345,046 | 24,367 | Nov 14 06:47 PM |
|
|
|
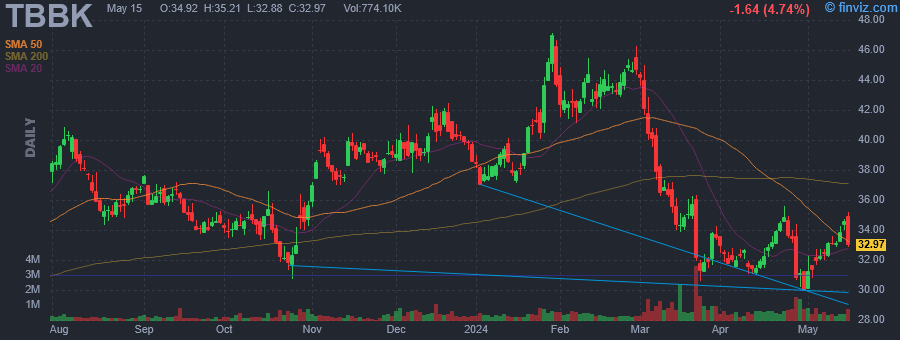 |
| Market Cap | 1.67B | EPS (ttm) | 3.67 |
| P/E | 8.69 | EPS this Y | 22.34% |
| Forward P/E | 6.08 | EPS next Y | 17.81% |
| PEG | 0.72 | EPS past 5Y | 17.59% |
| P/S | 2.79 | EPS next 5Y | 12.00% |
| P/B | 2.04 | EPS Q/Q | 20.95% |
| Dividend | - | Sales Q/Q | -18.47% |
| Insider Own | 4.80% | Inst Own | 93.27% |
| Insider Trans | 0.26% | Inst Trans | -1.36% |
| Short Float | 9.55% | Earnings | Apr 25/a |
| Analyst Recom | 1.33 | Target Price | 47.00 |
| Avg Volume | 733.31K | 52W Range | 28.04 - 47.11 |
|
|
|
|
The Bancorp, Inc. is a financial holding company, which engages in the provision of private label banking and financial services through the Bank. It operates through the following segments: Specialty Finance, Payments, and Corporate. The Specialty Finance segment includes the origination of non-SBA commercial real estate loans, SBA loans, direct lease financing, SBLOC, IBLOC, advisor financing, and deposits generated by those business lines. The Payments segment consists of prepaid and debit cards, card payments, automated clearing house processing, and healthcare accounts. The Corporate segment refers to the company's investment portfolio, corporate overhead, and non-allocated expenses. The company was founded by Betzy Z. Cohen on July 20, 1999 and is headquartered in Wilmington, DE. |
| Insider Trading |
Relationship |
Date |
Transaction |
Cost |
#Shares |
Value ($) |
#Shares Total |
SEC Form 4 |
| Cohn Matthew | Director | May 01 '24 | Buy | 30.25 | 1,000 | 30,250 | 158,627 | May 02 04:00 PM | | Cohn Matthew | Director | May 01 '24 | Buy | 30.25 | 230 | 6,958 | 52,291 | May 02 04:00 PM | | Cohn Matthew | Director | Mar 15 '24 | Buy | 34.21 | 2,485 | 85,000 | 157,627 | Mar 18 05:10 PM | | Mudick Stephanie B | Director | Mar 12 '24 | Buy | 37.11 | 2,000 | 74,222 | 31,584 | Mar 12 04:01 PM | | Cohn Matthew | Director | Mar 12 '24 | Buy | 36.62 | 1,928 | 70,603 | 155,142 | Mar 13 04:00 PM |
|
|
|
