 |
| Market Cap | 33.80B | EPS (ttm) | 7.79 |
| P/E | 6.73 | EPS this Y | 5.36% |
| Forward P/E | 6.91 | EPS next Y | 15.05% |
| PEG | 0.70 | EPS past 5Y | 4.80% |
| P/S | 0.57 | EPS next 5Y | 9.62% |
| P/B | 3.03 | EPS Q/Q | 110.10% |
| Dividend | 0.72% | Sales Q/Q | 7.75% |
| Insider Own | 0.38% | Inst Own | 69.77% |
| Insider Trans | -9.68% | Inst Trans | -1.80% |
| Short Float | 2.93% | Earnings | Apr 10/b |
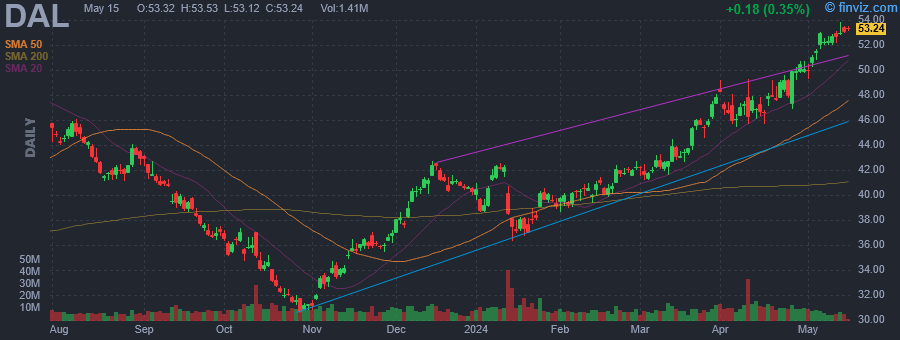
| Analyst Recom | 1.29 | Target Price | 59.10 |
| Avg Volume | 10.01M | 52W Range | 30.60 - 53.00 |
|
|
|
|
Delta Air Lines, Inc. engages in the provision of scheduled air transportation for passengers and cargo. It operates through the Airline and Refinery segments. The Airline segment provides scheduled air transportation for passengers and cargo. The Refinery segment provides jet fuel to the airline segment. The company was founded by Collett Everman Woolman in 1928 and is headquartered in Atlanta, GA. |
| Insider Trading |
Relationship |
Date |
Transaction |
Cost |
#Shares |
Value ($) |
#Shares Total |
SEC Form 4 |
| Chiang Willie CW | Director | May 01 '24 | Buy | 49.50 | 10,000 | 494,955 | 10,000 | May 03 04:32 PM | | Carter Peter W | EVP - External Affairs | Apr 29 '24 | Sale | 50.00 | 50,000 | 2,500,000 | 143,328 | Apr 30 05:30 PM | | Sear Steven M | EVP - Global Sales | Apr 24 '24 | Sale | 47.90 | 15,806 | 757,028 | 88,738 | Apr 25 04:30 PM | | BELLEMARE ALAIN | EVP & Pres. - International | Apr 23 '24 | Sale | 48.86 | 24,073 | 1,176,183 | 141,451 | Apr 24 04:30 PM | | HAUENSTEIN GLEN W | President | Apr 22 '24 | Sale | 49.05 | 100,000 | 4,904,600 | 217,584 | Apr 23 04:30 PM |
|
|
 |
 |
| Market Cap | 11.95M | EPS (ttm) | 0.02 |
| P/E | 54.30 | EPS this Y | - |
| Forward P/E | - | EPS next Y | - |
| PEG | - | EPS past 5Y | - |
| P/S | 1.60 | EPS next 5Y | - |
| P/B | 1.89 | EPS Q/Q | -162.72% |
| Dividend | 1.51% | Sales Q/Q | 7.90% |
| Insider Own | 73.72% | Inst Own | 2.45% |
| Insider Trans | 0.14% | Inst Trans | 1.76% |
| Short Float | 0.66% | Earnings | - |
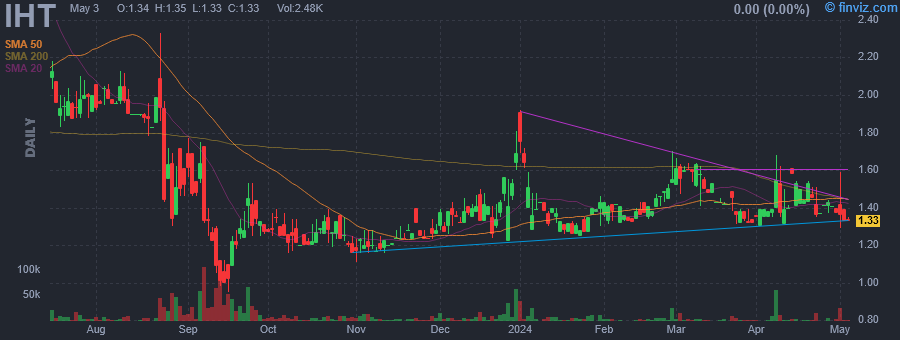
| Analyst Recom | - | Target Price | - |
| Avg Volume | 5.31K | 52W Range | 0.95 - 3.82 |
|
|
|
|
InnSuites Hospitality Trust engages in the ownership and operation of hotel properties. It also offers management services, which focus on trademark and licensing. The company was founded by James F. Wirth on June 21, 1971 and is headquartered in Phoenix, AZ. |
| Insider Trading |
Relationship |
Date |
Transaction |
Cost |
#Shares |
Value ($) |
#Shares Total |
SEC Form 4 |
| WIRTH JAMES F | President & CEO | May 01 '24 | Buy | 288.39 | 200 | 57,678 | 6,251,296 | May 03 04:30 PM | | WIRTH JAMES F | President & CEO | Apr 22 '24 | Buy | 583.45 | 400 | 233,380 | 6,251,096 | Apr 25 05:25 PM | | WIRTH JAMES F | President & CEO | Apr 16 '24 | Buy | 308.99 | 200 | 61,798 | 6,250,696 | Apr 19 06:16 AM | | WIRTH JAMES F | President & CEO | Apr 10 '24 | Buy | 301.50 | 200 | 60,300 | 6,250,496 | Apr 12 04:25 PM | | WIRTH JAMES F | President & CEO | Feb 26 '24 | Buy | 971.16 | 660 | 640,966 | 5,949,322 | Feb 29 06:25 AM |
|
|
|
 |
| Market Cap | 458.96M | EPS (ttm) | -0.97 |
| P/E | - | EPS this Y | 35.20% |
| Forward P/E | - | EPS next Y | 38.27% |
| PEG | - | EPS past 5Y | 24.22% |
| P/S | 7.99 | EPS next 5Y | - |
| P/B | 2.15 | EPS Q/Q | -11.96% |
| Dividend | - | Sales Q/Q | 19.91% |
| Insider Own | 9.32% | Inst Own | 101.51% |
| Insider Trans | 49.89% | Inst Trans | -0.40% |
| Short Float | 14.72% | Earnings | May 13/a |
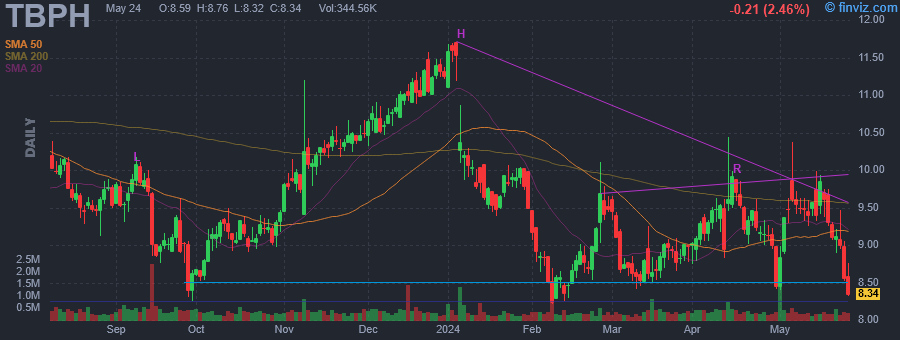
| Analyst Recom | 1.80 | Target Price | 15.40 |
| Avg Volume | 407.88K | 52W Range | 8.21 - 11.98 |
|
|
|
|
Theravance Biopharma, Inc. is a biopharmaceutical company, which engages in the discovery, research, development, and commercialization of respiratory medicines. It operates through the U.S. and Europe geographical segments. Its products include telavancin under the VIBATIV brand, revefenacin under the TD 4208 brand, and neprilysin. The company was founded in July 2013 and is headquartered in George Town, Cayman Islands. |
| Insider Trading |
Relationship |
Date |
Transaction |
Cost |
#Shares |
Value ($) |
#Shares Total |
SEC Form 4 |
| Samaha Eli | 10% Owner | May 01 '24 | Buy | 8.75 | 1,499,124 | 13,117,335 | 8,511,350 | May 03 04:19 PM | | Farnum Rhonda | SVP, COMM & MEDICAL AFFAIRS | Feb 22 '24 | Sale | 8.71 | 1,254 | 10,922 | 311,733 | Feb 22 08:04 PM | | Farnum Rhonda | SVP, COMM & MEDICAL AFFAIRS | Nov 21 '23 | Sale | 10.29 | 1,378 | 14,180 | 331,206 | Nov 22 06:07 PM | | GRAHAM RICHARD A | SVP, RESEARCH & DEVELOPMENT | Nov 14 '23 | Sale | 10.22 | 2,482 | 25,366 | 346,839 | Nov 16 06:16 PM | | GRAHAM RICHARD A | SVP, RESEARCH & DEVELOPMENT | Oct 16 '23 | Sale | 9.03 | 2,482 | 22,412 | 334,321 | Oct 18 06:54 PM |
|
|
| |
 |
| Market Cap | 441.12M | EPS (ttm) | -1.78 |
| P/E | - | EPS this Y | 13.88% |
| Forward P/E | - | EPS next Y | -7.79% |
| PEG | - | EPS past 5Y | -29.69% |
| P/S | - | EPS next 5Y | 38.60% |
| P/B | 1.51 | EPS Q/Q | 24.94% |
| Dividend | - | Sales Q/Q | - |
| Insider Own | 23.69% | Inst Own | 76.70% |
| Insider Trans | 1.48% | Inst Trans | 11.11% |
| Short Float | 5.96% | Earnings | Mar 26/a |
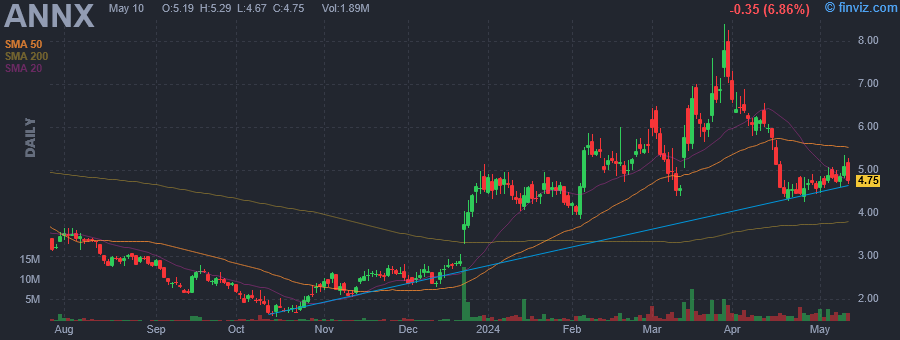
| Analyst Recom | 1.00 | Target Price | 15.17 |
| Avg Volume | 1.77M | 52W Range | 1.57 - 8.40 |
|
|
|
|
Annexon, Inc. is a clinical-stage biopharmaceutical company, which develops a pipeline of novel therapies for patients with classical complement-mediated disorders of the body, eye and brain. It offers drugs that control or target huntington's and alzheimer's disease, multiple sclerosis, glaucoma, parkinson's disease, and spinal muscular atrophy. The company was founded by Ben Barres and Arnon Rosenthal on March 3, 2011 and is headquartered in Brisbane, CA. |
| Insider Trading |
Relationship |
Date |
Transaction |
Cost |
#Shares |
Value ($) |
#Shares Total |
SEC Form 4 |
| Carson William H. | Director | May 01 '24 | Buy | 4.68 | 3,200 | 14,982 | 6,400 | May 03 04:15 PM | | Carson William H. | Director | Apr 08 '24 | Buy | 6.07 | 3,200 | 19,411 | 3,200 | Apr 10 07:17 PM | | Yednock Ted | EVP & CHIEF INNOVATION OFFICER | Feb 20 '24 | Sale | 5.51 | 2,604 | 14,348 | 72,471 | Feb 21 04:31 PM | | Lew Jennifer | EVP & CHIEF FINANCIAL OFFICER | Feb 20 '24 | Sale | 5.53 | 2,593 | 14,339 | 82,058 | Feb 21 04:31 PM | | Overdorf Michael | EVP & CHIEF BUSINESS OFFICER | Feb 20 '24 | Sale | 5.48 | 1,951 | 10,691 | 85,641 | Feb 21 04:31 PM |
|
|
|
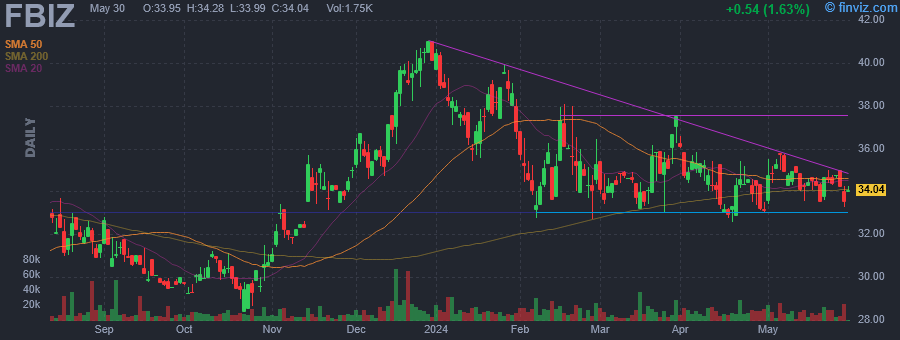 |
| Market Cap | 291.39M | EPS (ttm) | 4.36 |
| P/E | 8.06 | EPS this Y | 4.53% |
| Forward P/E | 6.78 | EPS next Y | 14.49% |
| PEG | 1.01 | EPS past 5Y | 18.43% |
| P/S | 1.22 | EPS next 5Y | 8.00% |
| P/B | 1.02 | EPS Q/Q | -0.98% |
| Dividend | 2.84% | Sales Q/Q | 23.91% |
| Insider Own | 6.98% | Inst Own | 64.19% |
| Insider Trans | 0.09% | Inst Trans | -1.68% |
| Short Float | 0.28% | Earnings | Apr 25/a |
| Analyst Recom | 1.60 | Target Price | 42.80 |
| Avg Volume | 13.33K | 52W Range | 24.57 - 41.03 |
|
|
|
|
First Business Financial Services, Inc. operates as a bank holding company, which engages in the provision of commercial banking services. It offers treasury and investment management, commercial lending, equipment finance, retirement plans, trust and estate administration, private banking and asset-based lending. The company was founded in 1986 and is headquartered in Madison, WI. |
| Insider Trading |
Relationship |
Date |
Transaction |
Cost |
#Shares |
Value ($) |
#Shares Total |
SEC Form 4 |
| Sanders Carol P | Director | May 01 '24 | Buy | 34.40 | 175 | 6,019 | 10,218 | May 03 04:13 PM | | Sanders Carol P | Director | Jan 30 '24 | Buy | 38.37 | 156 | 5,986 | 10,043 | Jan 31 04:49 PM | | Sanders Carol P | Director | Oct 31 '23 | Buy | 31.08 | 193 | 5,998 | 9,887 | Nov 07 04:29 PM | | Chandler Jodi A | Chief Human Resources Officer | Aug 30 '23 | Sale | 31.41 | 1,596 | 50,133 | 17,854 | Aug 31 05:18 PM | | Chandler Jodi A | Chief Human Resources Officer | Aug 29 '23 | Sale | 31.83 | 6,604 | 210,229 | 19,450 | Aug 31 05:18 PM |
|
|
| |
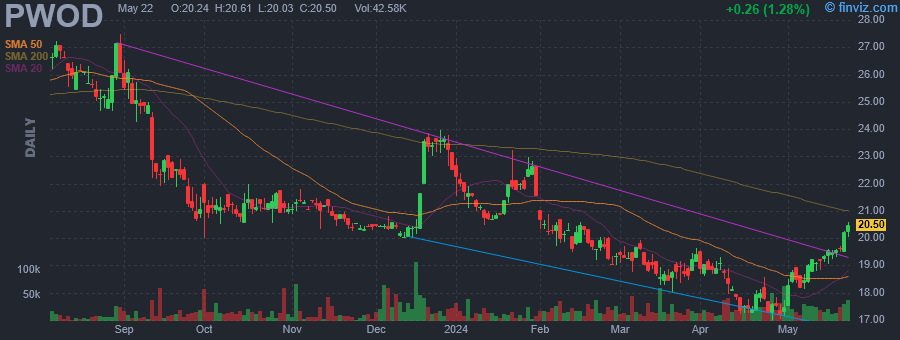 |
| Market Cap | 138.97M | EPS (ttm) | 2.17 |
| P/E | 8.52 | EPS this Y | - |
| Forward P/E | - | EPS next Y | - |
| PEG | - | EPS past 5Y | 2.24% |
| P/S | 1.30 | EPS next 5Y | - |
| P/B | 0.72 | EPS Q/Q | -20.19% |
| Dividend | 6.92% | Sales Q/Q | 29.70% |
| Insider Own | 5.56% | Inst Own | 27.94% |
| Insider Trans | 3.89% | Inst Trans | -0.98% |
| Short Float | 2.46% | Earnings | - |
| Analyst Recom | - | Target Price | - |
| Avg Volume | 24.88K | 52W Range | 17.01 - 27.59 |
|
|
|
|
Penns Woods Bancorp, Inc. engages in the business of commercial and retail banking. Its services include acceptance of time, savings, and demand deposits, the funding of commercial, consumer, and mortgage loans, and safe deposit services. The company was founded on January 7, 1983 and is headquartered in Williamsport, PA. |
| Insider Trading |
Relationship |
Date |
Transaction |
Cost |
#Shares |
Value ($) |
#Shares Total |
SEC Form 4 |
| Kranich Charles E. | Director | May 03 '24 | Buy | 18.68 | 500 | 9,339 | 35,552 | May 03 03:41 PM | | Carter Aron M | Senior Vice President | May 02 '24 | Buy | 18.66 | 535 | 9,980 | 1,555 | May 02 04:12 PM | | Kranich Charles E. | Director | Apr 30 '24 | Buy | 17.55 | 3,000 | 52,658 | 35,052 | Apr 30 02:42 PM | | Grafmyre Richard A | Chief Executive Officer | Apr 30 '24 | Buy | 17.30 | 3,000 | 51,900 | 21,725 | Apr 30 02:42 PM | | CASALE MICHAEL J JR | Director | Apr 30 '24 | Buy | 17.29 | 3,000 | 51,870 | 34,602 | Apr 30 02:41 PM |
|
|
|
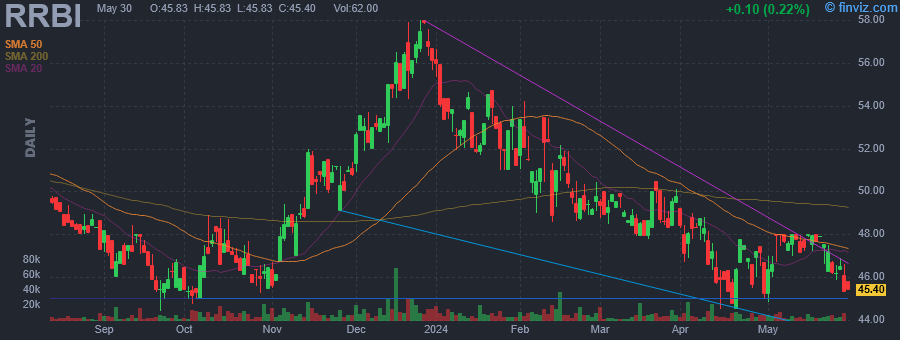 |
| Market Cap | 338.48M | EPS (ttm) | 4.68 |
| P/E | 10.19 | EPS this Y | -5.25% |
| Forward P/E | 9.70 | EPS next Y | 6.84% |
| PEG | - | EPS past 5Y | 8.99% |
| P/S | 2.33 | EPS next 5Y | - |
| P/B | 1.10 | EPS Q/Q | -13.02% |
| Dividend | 0.74% | Sales Q/Q | 18.32% |
| Insider Own | 37.38% | Inst Own | 21.38% |
| Insider Trans | -0.17% | Inst Trans | -1.50% |
| Short Float | 0.31% | Earnings | Apr 25/a |
| Analyst Recom | 1.00 | Target Price | 62.00 |
| Avg Volume | 9.35K | 52W Range | 44.00 - 58.00 |
|
|
|
|
Red River Bancshares, Inc. is a bank holding company, which engages in the provision of banking products and services for commercial and retail customers through its subsidiary. It offers real estate and commercial loans, treasury management, retail banking networks, private banking, residential mortgage lending, and investment services. The company was founded on March 16, 1998 and is headquartered in Alexandria, LA. |
| Insider Trading |
Relationship |
Date |
Transaction |
Cost |
#Shares |
Value ($) |
#Shares Total |
SEC Form 4 |
| Price Teddy Ray | Director | May 03 '24 | Buy | 47.08 | 738 | 34,742 | 367,478 | May 03 02:22 PM | | Price Teddy Ray | Director | May 03 '24 | Buy | 47.99 | 131 | 6,287 | 64,785 | May 03 02:22 PM | | Salazar Tammi R. | See Remarks | Mar 28 '24 | Sale | 50.05 | 781 | 39,089 | 39,901 | Apr 01 02:50 PM | | Salazar Bryon C. | See Remarks | Mar 28 '24 | Sale | 50.05 | 781 | 39,089 | 3,776 | Apr 01 03:24 PM | | Salazar Tammi R. | See Remarks | Mar 28 '24 | Sale | 50.05 | 256 | 12,813 | 3,200 | Apr 01 02:50 PM |
|
|
| |
 |
| Market Cap | 242.82M | EPS (ttm) | -0.19 |
| P/E | - | EPS this Y | - |
| Forward P/E | - | EPS next Y | - |
| PEG | - | EPS past 5Y | - |
| P/S | 13.19 | EPS next 5Y | - |
| P/B | 0.90 | EPS Q/Q | - |
| Dividend | 3.61% | Sales Q/Q | 3.60% |
| Insider Own | - | Inst Own | 31.22% |
| Insider Trans | - | Inst Trans | - |
| Short Float | 0.11% | Earnings | - |
| Analyst Recom | - | Target Price | - |
| Avg Volume | 31.39K | 52W Range | 8.58 - 10.28 |
|
|
|
|
Invesco Pennsylvania Value Municipal Income Trust is a closed-ended fixed income mutual fund launched by Invesco Ltd. The fund is co-managed by Invesco Advisers, Inc., INVESCO Asset Management (Japan) Limited, INVESCO Asset Management Deutschland GmbH, INVESCO Asset Management Limited, Invesco Canada Ltd., Invesco Hong Kong Limited, and INVESCO Senior Secured Management, Inc. It invests in the fixed income markets of the United States. The fund primarily invests in investment grade Pennsylvania municipal securities which include municipal bonds, municipal notes, municipal commercial paper, and lease obligations. It employs fundamental analysis with bottom-up security selection approach to create its portfolio. The fund was formerly known as Invesco Van Kampen Pennsylvania Value Municipal Income Trust. Invesco Pennsylvania Value Municipal Income Trust was formed on April 30, 1993 and is domiciled in the United States. |
| Insider Trading |
Relationship |
Date |
Transaction |
Cost |
#Shares |
Value ($) |
#Shares Total |
SEC Form 4 |
| Saba Capital Management, L.P. | 10% Owner | May 02 '24 | Buy | 9.96 | 30,935 | 308,113 | 2,873,641 | May 03 01:24 PM | | Saba Capital Management, L.P. | 10% Owner | Apr 15 '24 | Buy | 9.94 | 2,973 | 29,552 | 2,842,701 | Apr 15 05:15 PM | | Saba Capital Management, L.P. | 10% Owner | Apr 12 '24 | Buy | 10.01 | 13,333 | 133,463 | 2,839,728 | Apr 15 05:15 PM | | Saba Capital Management, L.P. | 10% Owner | Mar 19 '24 | Buy | 10.21 | 11,342 | 115,802 | 2,826,395 | Mar 20 12:14 PM | | Saba Capital Management, L.P. | 10% Owner | Mar 12 '24 | Buy | 10.23 | 6,989 | 71,497 | 2,815,053 | Mar 12 06:07 PM |
|
|
|
 |
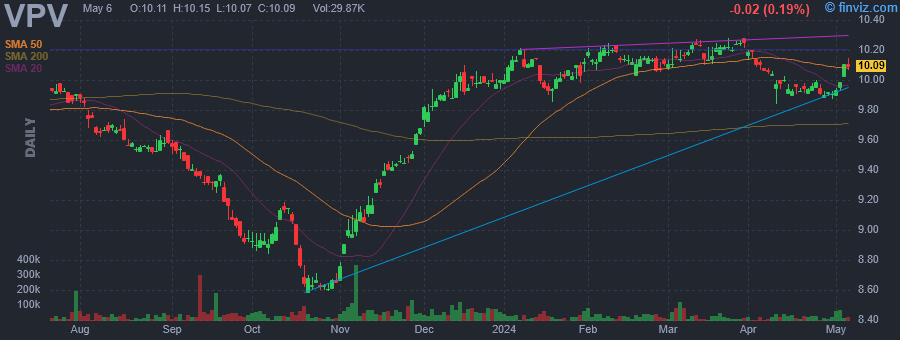
| Market Cap | 495.18M | EPS (ttm) | 0.21 |
| P/E | 57.14 | EPS this Y | - |
| Forward P/E | - | EPS next Y | - |
| PEG | - | EPS past 5Y | - |
| P/S | 13.71 | EPS next 5Y | - |
| P/B | 0.90 | EPS Q/Q | - |
| Dividend | 3.45% | Sales Q/Q | -3.10% |
| Insider Own | - | Inst Own | 31.13% |
| Insider Trans | - | Inst Trans | - |
| Short Float | 0.19% | Earnings | - |
| Analyst Recom | - | Target Price | - |
| Avg Volume | 63.50K | 52W Range | 10.06 - 12.24 |
|
|
|
|
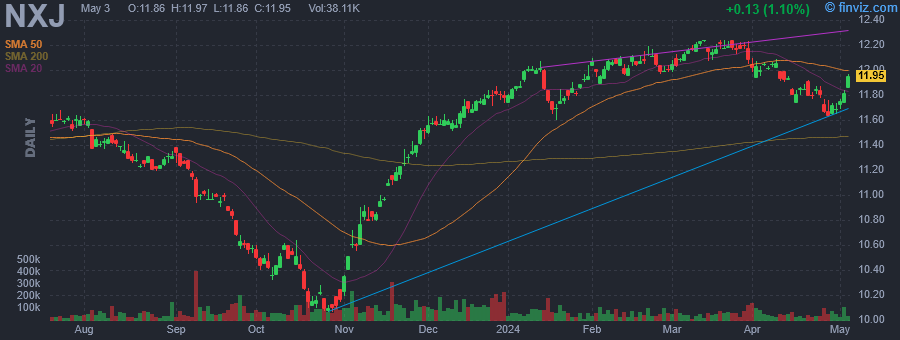
Nuveen New Jersey Quality Municipal Income Fund is a closed ended fixed income mutual fund launched by Nuveen Investments, Inc. The fund is co-managed by Nuveen Fund Advisors LLC and Nuveen Asset Management, LLC. It invests in the fixed income markets of New Jersey. The fund invests in undervalued municipal securities and other related investments that are, exempt from regular federal and New Jersey income taxes that are rated Baa or BBB or better. It employs fundamental analysis with bottom-up stock picking approach to create its portfolio. The fund benchmarks the performance of its portfolio against the Standard & Poor's (S&P) New Jersey Municipal Bond Index. The fund was formerly known as Nuveen New Jersey Dividend Advantage Municipal Fund. Nuveen New Jersey Quality Municipal Income Fund was formed on June 1, 1999 and is domiciled in the United States. |
| Insider Trading |
Relationship |
Date |
Transaction |
Cost |
#Shares |
Value ($) |
#Shares Total |
SEC Form 4 |
| Saba Capital Management, L.P. | 10% Owner | May 02 '24 | Buy | 11.79 | 50,596 | 596,527 | 5,972,471 | May 03 01:16 PM | | Saba Capital Management, L.P. | 10% Owner | Apr 29 '24 | Buy | 11.66 | 5,494 | 64,060 | 5,921,875 | May 01 10:30 AM | | Saba Capital Management, L.P. | 10% Owner | Apr 02 '24 | Buy | 11.99 | 27,925 | 334,821 | 5,916,381 | Apr 03 02:01 PM | | Saba Capital Management, L.P. | 10% Owner | Apr 01 '24 | Buy | 12.03 | 54,332 | 653,614 | 5,888,456 | Apr 03 02:01 PM | | Saba Capital Management, L.P. | 10% Owner | Mar 26 '24 | Buy | 12.18 | 6,788 | 82,678 | 5,834,124 | Mar 27 09:27 AM |
|
|
|
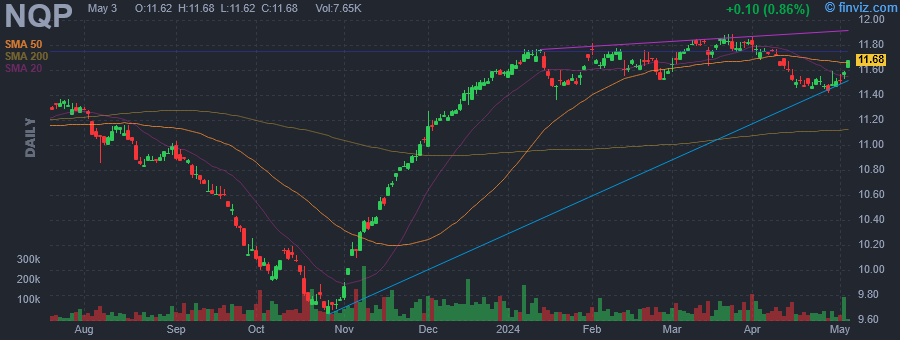 |
| Market Cap | 438.85M | EPS (ttm) | -0.24 |
| P/E | - | EPS this Y | - |
| Forward P/E | - | EPS next Y | - |
| PEG | - | EPS past 5Y | - |
| P/S | 13.89 | EPS next 5Y | - |
| P/B | 0.91 | EPS Q/Q | - |
| Dividend | 3.35% | Sales Q/Q | 5.80% |
| Insider Own | - | Inst Own | 33.09% |
| Insider Trans | - | Inst Trans | - |
| Short Float | 0.13% | Earnings | - |
| Analyst Recom | - | Target Price | - |
| Avg Volume | 54.24K | 52W Range | 9.65 - 11.89 |
|
|
|
|
Nuveen Pennsylvania Quality Municipal Income Fund is a closed ended fixed income mutual fund launched by Nuveen Investments, Inc. The fund is co-managed by Nuveen Fund Advisors LLC and Nuveen Asset Management, LLC. It invests in the fixed income markets of Pennsylvania. The fund invests in tax exempt municipal bonds, with a rating of Baa/BBB or higher. It employs fundamental analysis, with bottom-up stock picking approach, to create its portfolio. The fund benchmarks the performance of its portfolio against the Standard & Poor's Pennsylvania Municipal Bond Index and Standard & Poor's National Municipal Bond Index. The fund was formerly known a Nuveen Pennsylvania Investment Quality Municipal Fund. Nuveen Pennsylvania Quality Municipal Income Fund was formed on December 20, 1990 and is domiciled in the United States. |
| Insider Trading |
Relationship |
Date |
Transaction |
Cost |
#Shares |
Value ($) |
#Shares Total |
SEC Form 4 |
| Saba Capital Management, L.P. | 10% Owner | May 02 '24 | Buy | 11.55 | 65,807 | 760,071 | 5,161,297 | May 03 01:14 PM | | Saba Capital Management, L.P. | 10% Owner | Apr 29 '24 | Buy | 11.49 | 7,796 | 89,576 | 5,095,490 | May 01 10:28 AM | | Saba Capital Management, L.P. | 10% Owner | Apr 25 '24 | Buy | 11.46 | 31,908 | 365,666 | 5,087,694 | Apr 26 11:51 AM | | Saba Capital Management, L.P. | 10% Owner | Apr 02 '24 | Buy | 11.76 | 49,402 | 580,968 | 5,055,786 | Apr 03 01:55 PM | | Saba Capital Management, L.P. | 10% Owner | Apr 01 '24 | Buy | 11.77 | 35,421 | 416,905 | 5,006,384 | Apr 03 01:55 PM |
|
|
|
