 |
| Market Cap | 18.53B | EPS (ttm) | 15.03 |
| P/E | 7.88 | EPS this Y | 5.88% |
| Forward P/E | 16.80 | EPS next Y | 10.34% |
| PEG | 0.43 | EPS past 5Y | 46.21% |
| P/S | 1.73 | EPS next 5Y | 18.20% |
| P/B | 1.46 | EPS Q/Q | 236.82% |
| Dividend | 2.74% | Sales Q/Q | 30.97% |
| Insider Own | 1.81% | Inst Own | 66.22% |
| Insider Trans | 0.11% | Inst Trans | 2.21% |
| Short Float | 1.35% | Earnings | Apr 25/a |
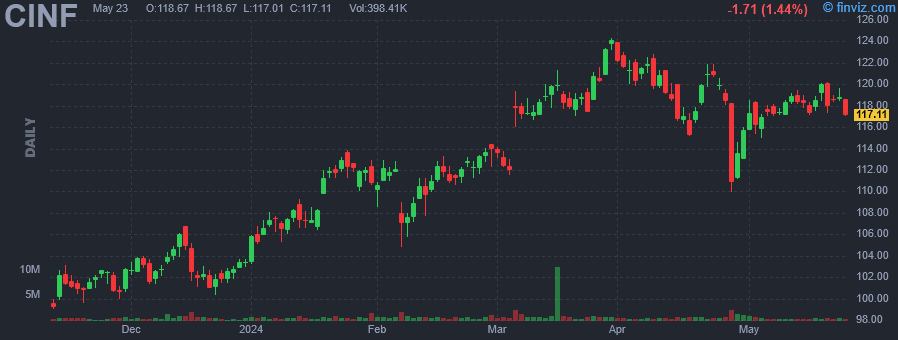
| Analyst Recom | 2.18 | Target Price | 130.00 |
| Avg Volume | 967.90K | 52W Range | 95.01 - 124.35 |
|
|
|
|
Cincinnati Financial Corp. engages in providing property casualty and life insurance services. It operates through the following segments: Commercial Lines Insurance, Personal Lines Insurance, Excess and Surplus Lines Insurance, Life Insurance, and Investments. The Commercial Lines Insurance segment includes commercial casualty, commercial property, commercial auto, worker's compensation, and other commercial lines insurance. The Personal Lines Insurance segment manages personal auto, homeowner, and other personal lines insurance. The Excess and Surplus Lines Insurance segment covers business risks such as the nature of the business or its claim history, that are difficult to profitably insure in the standard commercial lines market. The Life Insurance segment offers term life insurance, universal life insurance, worksite products, and whole life insurance services. The Investment segment generates revenue from the fixed-maturity investment and equity investment. The company was founded by John Jack Schiff Sr., Robert Cleveland Schiff, and Harry M. Turner in 1968 and is headquartered in Fairfield, OH. |
| Insider Trading |
Relationship |
Date |
Transaction |
Cost |
#Shares |
Value ($) |
#Shares Total |
SEC Form 4 |
| Debbink Dirk J | Director | Apr 29 '24 | Buy | 113.47 | 1,000 | 113,470 | 53,988 | May 01 03:19 PM | | Soloria Steven Anthony | EVP, Chief Investment Officer | Mar 12 '24 | Option Exercise | 71.19 | 831 | 59,159 | 14,421 | Mar 14 03:29 PM | | Givler Sean Michael | Sr Vice President - Subsidiary | Mar 01 '24 | Option Exercise | 0.00 | 1,301 | 0 | 23,338 | Mar 05 03:27 PM | | Brown Roger A | Sr VP, COO - Subsidiary | Mar 01 '24 | Option Exercise | 0.00 | 885 | 0 | 54,727 | Mar 05 03:26 PM | | Cracas Teresa C | EVP, Chief Risk Off. - Sub | Mar 01 '24 | Option Exercise | 0.00 | 1,332 | 0 | 42,462 | Mar 05 03:26 PM |
|
|
 |
 |
| Market Cap | 132.19M | EPS (ttm) | 0.30 |
| P/E | 62.54 | EPS this Y | - |
| Forward P/E | - | EPS next Y | - |
| PEG | - | EPS past 5Y | -37.81% |
| P/S | 1.27 | EPS next 5Y | - |
| P/B | 0.97 | EPS Q/Q | 35.57% |
| Dividend | 2.63% | Sales Q/Q | 12.26% |
| Insider Own | 9.43% | Inst Own | 32.07% |
| Insider Trans | 7.06% | Inst Trans | -0.31% |
| Short Float | 2.28% | Earnings | Apr 24/a |
| Analyst Recom | - | Target Price | - |
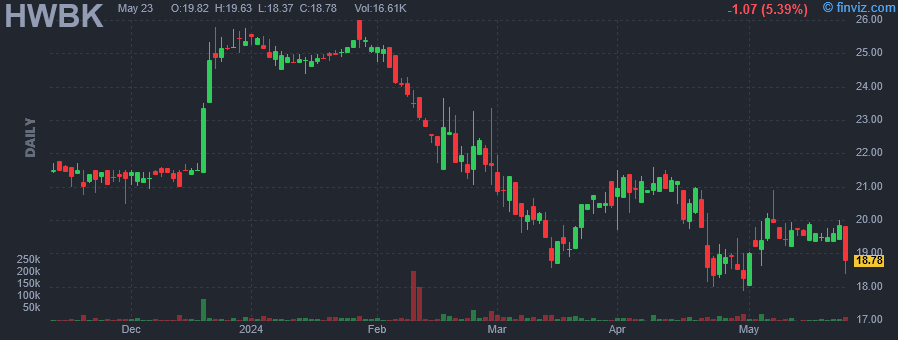
| Avg Volume | 18.91K | 52W Range | 15.02 - 26.00 |
|
|
|
|
Hawthorn Bancshares, Inc. operates as a bank holding company, which provides banking services to individual and corporate customers through its subsidiary, Hawthorn Bank. It offers checking and savings accounts, internet banking, debit cards, certificates of deposit, brokerage services, personal loans, installment loans, trust services, credit related insurance, and safe deposit boxes. The company was founded in 1865 and is headquartered in Jefferson City, MO. |
| Insider Trading |
Relationship |
Date |
Transaction |
Cost |
#Shares |
Value ($) |
#Shares Total |
SEC Form 4 |
| Holtaway Jonathan | Director | Apr 30 '24 | Buy | 18.76 | 5,500 | 103,180 | 26,500 | May 01 11:26 AM | | Holtaway Jonathan | Director | Apr 29 '24 | Buy | 19.19 | 5,500 | 105,545 | 21,000 | May 01 11:26 AM | | Burkhead Frank E. | Director | Apr 29 '24 | Buy | 19.10 | 500 | 9,548 | 14,134 | May 01 02:36 PM | | Holtaway Jonathan | Director | Mar 14 '24 | Buy | 19.12 | 5,500 | 105,160 | 15,500 | Mar 14 05:46 PM | | GILES BRENT M | CHIEF EXECUTIVE OFFICER | Mar 14 '24 | Buy | 19.51 | 1,224 | 23,875 | 5,527 | Mar 15 05:21 PM |
|
|
|
 |
| Market Cap | 390.60M | EPS (ttm) | 2.70 |
| P/E | 19.42 | EPS this Y | - |
| Forward P/E | - | EPS next Y | - |
| PEG | - | EPS past 5Y | -7.81% |
| P/S | 2.29 | EPS next 5Y | - |
| P/B | 1.24 | EPS Q/Q | -31.18% |
| Dividend | 4.04% | Sales Q/Q | 9.92% |
| Insider Own | 14.95% | Inst Own | 25.93% |
| Insider Trans | 2.06% | Inst Trans | - |
| Short Float | 2.60% | Earnings | Apr 26/b |
| Analyst Recom | - | Target Price | - |
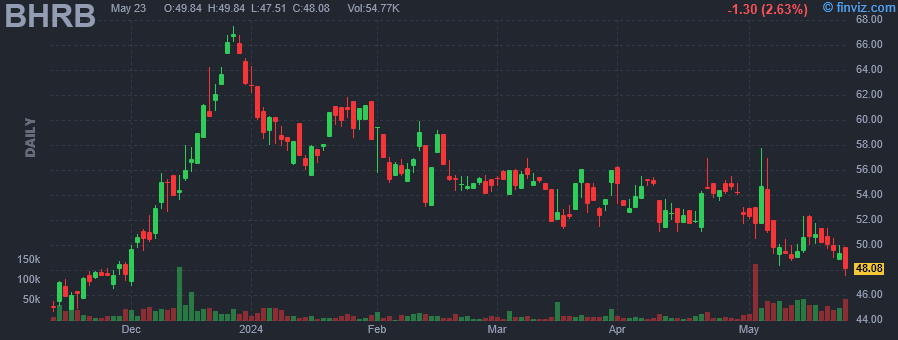
| Avg Volume | 11.85K | 52W Range | 42.91 - 85.00 |
|
|
|
Apr-26-24 01:53PM
|
BHRB Stock Earnings: Burke & Herbert Financial Reported Results for Q1 2024
(InvestorPlace) |
|
08:30AM
|
Burke & Herbert Financial Services Corp. Announces First Quarter 2024 Results and Declares Common Stock Dividend
(PR Newswire) |
|
Apr-19-24 08:30AM
|
Burke & Herbert Financial Services Corp. and Summit Financial Group, Inc. Announce Receipt of Regulatory Approvals and Closing Date for Merger of Equals
(PR Newswire) |
|
Feb-01-24 12:02PM
|
Hedge Fund and Insider Trading News: David Einhorn, Crispin Odey, Bill Ackman, Stanley Druckenmiller, Ken Griffin, Burke Herbert Financial Services (BHRB), KalVista Pharmaceuticals, Inc. (KALV), and More
(Insider Monkey) |
|
Jan-26-24 08:00AM
|
Burke & Herbert Financial Services Corp. Announces Fourth Quarter and Full Year 2023 Results and Declares Common Stock Dividend
(PR Newswire) |
|
Dec-06-23 02:07PM
|
Burke & Herbert Financial Services Corp. and Summit Financial Group, Inc. Announce Receipt of Shareholder Approval for Merger
(PR Newswire) |
|
Oct-27-23 07:30AM
|
Burke & Herbert Financial Services Corp. Announces Third Quarter 2023 Results and Declares Common Stock Dividend
(PR Newswire) |
|
Oct-13-23 02:52PM
|
Burke & Herbert Bank Launches Goals for Good
(PR Newswire) |
|
Oct-02-23 12:00PM
|
Burke & Herbert Financial Services Corp. and Summit Financial Group, Inc. Submit Filings Related to Merger Agreement
(PR Newswire) |
|
Sep-15-23 03:07AM
|
Director Barnwell Julian Forrest Jr. Buys 5000 Shares of Burke & Herbert Financial Services ...
(GuruFocus.com) |
|
Burke Herbert Financial Services Corp. is a bank holding company, which engages in the provision of banking products and financial services to small to medium-sized businesses, their owners and employees, professional corporations, non-profits, and individuals. It operates through the following loan portfolio segments: Commercial Real Estate, Owner-Occupied Commercial Real Estate, Acquisition, Construction, and Development, Commercial and Industrial, Single Family Residential (1-4 Units), and Consumer Non-Real Estate and Other. The Commercial Real Estate segment includes leasing of the real estate collateral or income generated from the sale of the collateral. The Owner-Occupied Commercial Real Estate segment focuses on the operations of the business that occupies the property and the value of the collateral. The Acquisition, Construction, and Development segment offers creditworthiness of the borrower, project completion within budget, sale after completion, and the value of the collateral. The Commercial and Industrial segment is involved in the operations of the business and the value of the collateral. The Single Family Residential (1-4 Units) segment provides loans for investment purpose carry risk associated with the continued creditworthiness of the borrower, the value of the collateral, and either the net operating income generated from the lease of the real estate collateral or income generated from the sale of the collateral. The Consumer Non-Real Estate and Other segment covers loans carry risk associated with the creditworthiness of the borrower and the value of the collateral. The company was founded on September 14, 2022 and is headquartered in Alexandria, VA. |
| Insider Trading |
Relationship |
Date |
Transaction |
Cost |
#Shares |
Value ($) |
#Shares Total |
SEC Form 4 |
| McLaughlin Shawn Patrick | Director | May 01 '24 | Buy | 52.51 | 850 | 44,634 | 51,850 | May 01 02:33 PM | | Riojas Jose David | Director | Apr 30 '24 | Buy | 52.50 | 400 | 21,000 | 14,000 | Apr 30 03:13 PM | | Barnwell Julian Forrest Jr. | Director | Mar 15 '24 | Buy | 52.00 | 3,000 | 156,000 | 174,939 | Mar 15 10:54 AM | | McLaughlin Shawn Patrick | Director | Mar 04 '24 | Buy | 55.65 | 500 | 27,827 | 51,000 | Mar 04 03:43 PM | | Anderson Mark Guthrie | Director | Feb 21 '24 | Buy | 55.35 | 2,400 | 132,840 | 11,200 | Feb 21 11:28 AM |
|
|
| |
 |
| Market Cap | 347.64M | EPS (ttm) | 2.32 |
| P/E | 9.06 | EPS this Y | -4.32% |
| Forward P/E | 7.11 | EPS next Y | 14.19% |
| PEG | - | EPS past 5Y | 9.03% |
| P/S | 1.26 | EPS next 5Y | - |
| P/B | 0.63 | EPS Q/Q | 3.92% |
| Dividend | 3.94% | Sales Q/Q | 35.75% |
| Insider Own | 13.83% | Inst Own | 42.50% |
| Insider Trans | 1.42% | Inst Trans | 0.62% |
| Short Float | 0.27% | Earnings | Apr 24/a |
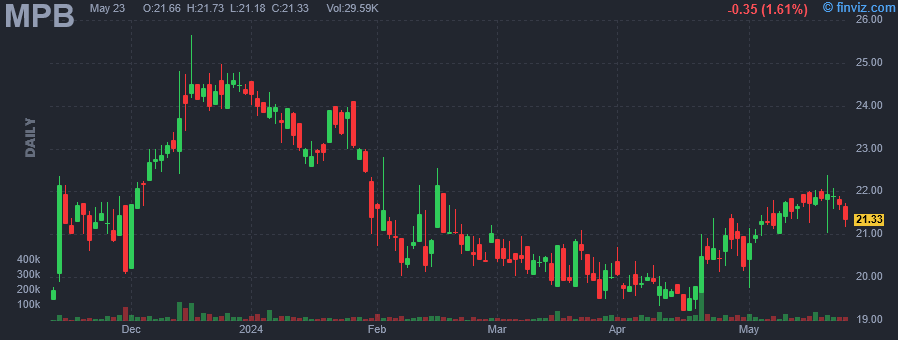
| Analyst Recom | 1.00 | Target Price | 26.00 |
| Avg Volume | 29.42K | 52W Range | 18.25 - 25.92 |
|
|
|
|
Mid Penn Bancorp, Inc. is a financial holding company, which engages in the provision of commercial banking and financial services. Its services include banking, financing, and planning to individuals, businesses, and nonprofit organizations. The company was founded in 1868 and is headquartered in Harrisburg, PA. |
| Insider Trading |
Relationship |
Date |
Transaction |
Cost |
#Shares |
Value ($) |
#Shares Total |
SEC Form 4 |
| De Soto Matthew G | Director | Apr 29 '24 | Buy | 20.76 | 9,615 | 199,563 | 79,190 | May 01 12:08 PM | | De Soto Matthew G | Director | Apr 29 '24 | Buy | 20.62 | 1,452 | 29,938 | 2,292 | May 01 12:08 PM | | Evans Albert J. | Director | Mar 28 '24 | Buy | 20.01 | 500 | 10,005 | 25,385 | Apr 01 02:27 PM | | De Soto Matthew G | Director | Mar 28 '24 | Buy | 20.01 | 400 | 8,004 | 69,575 | Apr 01 03:07 PM | | Grubic Robert C | Director | Mar 28 '24 | Buy | 20.01 | 250 | 5,002 | 61,869 | Apr 01 02:24 PM |
|
|
|
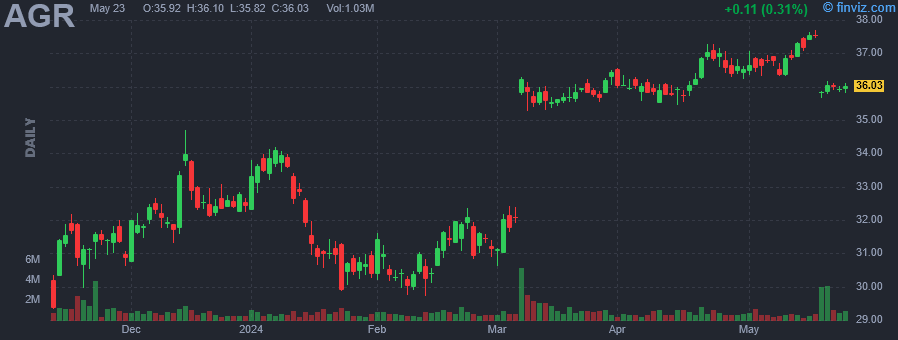 |
| Market Cap | 14.31B | EPS (ttm) | 2.30 |
| P/E | 16.06 | EPS this Y | 7.87% |
| Forward P/E | 15.25 | EPS next Y | 7.63% |
| PEG | 40.15 | EPS past 5Y | 1.11% |
| P/S | 1.69 | EPS next 5Y | 0.40% |
| P/B | 0.72 | EPS Q/Q | 43.19% |
| Dividend | 4.80% | Sales Q/Q | -3.83% |
| Insider Own | 82.28% | Inst Own | 13.27% |
| Insider Trans | 0.00% | Inst Trans | -2.73% |
| Short Float | 5.25% | Earnings | Apr 23/a |
| Analyst Recom | 3.22 | Target Price | 35.91 |
| Avg Volume | 958.13K | 52W Range | 27.46 - 41.22 |
|
|
|
|
Avangrid, Inc. engages in the energy transmission and gas distribution. It operates through the following segments: Networks, Renewables, and Other. The Networks segment includes energy transmission and distribution, electric transmission, and gas distribution activities. The Renewables segment relates to renewable energy, mainly wind energy generation and trading related to such activities. The Other segment covers miscellaneous corporate revenues including intersegment eliminations. The company was founded in 1852 and is headquartered in Orange, CT. |
| Insider Trading |
Relationship |
Date |
Transaction |
Cost |
#Shares |
Value ($) |
#Shares Total |
SEC Form 4 |
| Solomont Alan D | Director | May 01 '24 | Buy | 36.48 | 137 | 4,998 | 10,742 | May 01 12:05 PM | | Solomont Alan D | Director | Apr 01 '24 | Buy | 36.52 | 138 | 5,040 | 10,605 | Apr 01 01:09 PM | | Miranda Soto Jose Antonio | See below | Mar 01 '24 | Option Exercise | 0.00 | 4,940 | 0 | 8,331 | Mar 04 06:17 PM | | Mahoney R. Scott | SVP - General Counsel & Sec. | Mar 01 '24 | Option Exercise | 0.00 | 9,100 | 0 | 15,032 | Mar 04 06:20 PM | | Azagra Blazquez Pedro | Chief Executive Officer | Mar 01 '24 | Option Exercise | 0.00 | 10,532 | 0 | 33,908 | Mar 04 06:23 PM |
|
|
| |
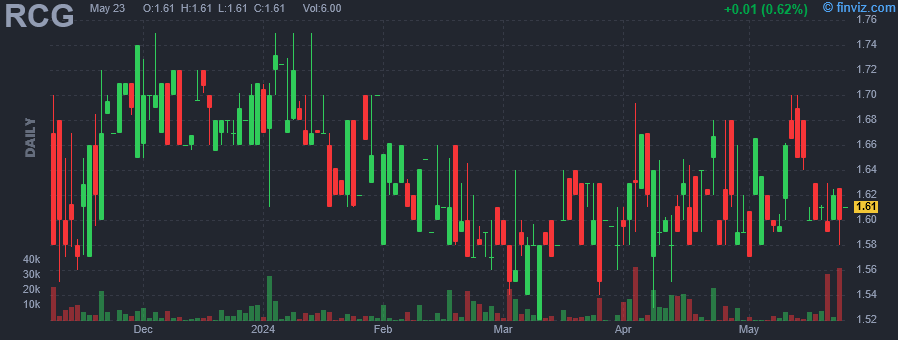 |
| Market Cap | 11.16M | EPS (ttm) | -0.12 |
| P/E | - | EPS this Y | - |
| Forward P/E | - | EPS next Y | - |
| PEG | - | EPS past 5Y | - |
| P/S | 39.03 | EPS next 5Y | - |
| P/B | 0.81 | EPS Q/Q | - |
| Dividend | 0.95% | Sales Q/Q | 26.30% |
| Insider Own | 14.93% | Inst Own | 16.58% |
| Insider Trans | 1.43% | Inst Trans | - |
| Short Float | 0.01% | Earnings | - |
| Analyst Recom | - | Target Price | - |
| Avg Volume | 7.60K | 52W Range | 1.52 - 1.90 |
|
|
|
|
RENN Fund, Inc. is a closed ended equity mutual fund launched by RENN Capital Group, Inc. The fund is co-managed by Horizon Kinetics Asset Management LLC. It invests in the public equity markets of the United States. The fund seeks to invest in stocks of companies operating across diversified sectors. It seeks to invest in stocks of small-cap and mid-cap companies. The fund employs a fundamental analysis with a bottom-up stock picking approach to create its portfolio. It was formerly known as RENN Global Entrepreneurs Fund, Inc. RENN Fund, Inc. was formed on January 20, 1994 and is domiciled in the United States. |
| Insider Trading |
Relationship |
Date |
Transaction |
Cost |
#Shares |
Value ($) |
#Shares Total |
SEC Form 4 |
| STAHL MURRAY | President and CEO | Apr 30 '24 | Buy | 1.65 | 55 | 91 | 247,594 | May 01 11:48 AM | | STAHL MURRAY | President and CEO | Apr 30 '24 | Buy | 1.65 | 4 | 7 | 5,029 | May 01 11:48 AM | | STAHL MURRAY | President and CEO | Apr 29 '24 | Buy | 1.66 | 55 | 91 | 247,570 | Apr 30 10:31 AM | | STAHL MURRAY | President and CEO | Apr 29 '24 | Buy | 1.66 | 4 | 7 | 5,025 | Apr 30 10:31 AM | | STAHL MURRAY | President and CEO | Apr 26 '24 | Buy | 1.60 | 55 | 88 | 247,546 | Apr 29 11:40 AM |
|
|
|
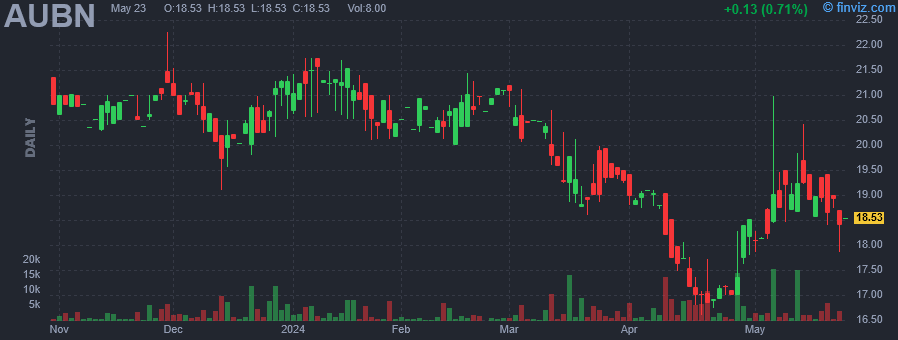 |
| Market Cap | 62.47M | EPS (ttm) | 0.23 |
| P/E | 78.44 | EPS this Y | - |
| Forward P/E | - | EPS next Y | - |
| PEG | - | EPS past 5Y | -30.30% |
| P/S | 2.09 | EPS next 5Y | - |
| P/B | 0.84 | EPS Q/Q | -30.03% |
| Dividend | 6.03% | Sales Q/Q | -16.43% |
| Insider Own | 55.90% | Inst Own | 8.65% |
| Insider Trans | 0.55% | Inst Trans | 4.63% |
| Short Float | 0.22% | Earnings | - |
| Analyst Recom | - | Target Price | - |
| Avg Volume | 3.23K | 52W Range | 16.61 - 23.20 |
|
|
|
|
Auburn National Bancorporation, Inc. is a bank holding company. It engages in the provision of banking services to commercial and retail customers. The firm operates through the following segments: Commercial and Industrial, Construction and Land Development, Commercial Real Estate, Residential Real Estate, and Consumer Installment. The Commercial and Industrial segment includes loans to finance business operations, equipment purchases, or other needs for small and medium-sized commercial customers. The Construction and Land Development segment is comprised of both loans and credit lines for the purpose of purchasing, carrying and developing land into commercial developments or residential subdivisions. The Commercial and Industrial segment provides loans disaggregated into three classes: owner occupied, multi-family and other. The Residential Real Estate segment is involved in consumer mortgage and investment property. The Consumer Installment segment encompasses loans to individuals both secured by personal property and unsecured. The company was founded in 1990 and is headquartered in Auburn, AL. |
| Insider Trading |
Relationship |
Date |
Transaction |
Cost |
#Shares |
Value ($) |
#Shares Total |
SEC Form 4 |
| HOUSEL DAVID E | Director | Apr 30 '24 | Buy | 18.16 | 100 | 1,816 | 7,445 | May 01 11:46 AM | | Hedges David A | President\CEO | Apr 26 '24 | Buy | 17.60 | 10,000 | 176,000 | 11,663 | Apr 29 12:00 PM | | Barrett J Tutt | Director | Apr 09 '24 | Buy | 19.25 | 93 | 1,791 | 8,553 | Apr 10 10:43 AM | | HAM WILLIAM F JR | Director | Apr 09 '24 | Buy | 19.21 | 72 | 1,383 | 4,841 | Apr 10 10:59 AM | | HOUSEL DAVID E | Director | Apr 09 '24 | Buy | 19.25 | 64 | 1,232 | 7,345 | Apr 10 10:27 AM |
|
|
| |
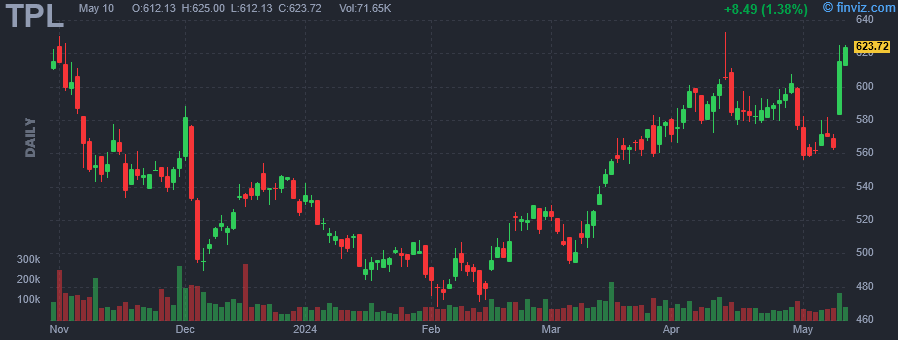 |
| Market Cap | 12.94B | EPS (ttm) | 17.59 |
| P/E | 31.96 | EPS this Y | -8.60% |
| Forward P/E | 7.69 | EPS next Y | 248.01% |
| PEG | 1.60 | EPS past 5Y | 14.40% |
| P/S | 20.48 | EPS next 5Y | 20.03% |
| P/B | 12.40 | EPS Q/Q | 13.90% |
| Dividend | 0.79% | Sales Q/Q | 9.20% |
| Insider Own | 0.82% | Inst Own | 59.40% |
| Insider Trans | 1.11% | Inst Trans | 0.69% |
| Short Float | 3.62% | Earnings | May 08/a |
| Analyst Recom | 2.70 | Target Price | 660.71 |
| Avg Volume | 76.32K | 52W Range | 422.07 - 666.67 |
|
|
|
|
Texas Pacific Land Corporation engages in the land and resource management, and water services and operations businesses. The company owns a 1/128th nonparticipating perpetual oil and gas royalty interest (NPRI) under approximately 85,000 acres of land; a 1/16th NPRI under approximately 371,000 acres of land; and approximately 4,000 additional net royalty acres, total of approximately 195,000 NRA located in the western part of Texas. The Land and Resource Management segment manages surface acres of land, and oil and gas royalty interest in West Texas. This segment also engages in easements, such as transporting oil, gas and related hydrocarbons, power line and utility, and subsurface wellbore easements. In addition, this segment leases its land for processing, storage, and compression facilities and roads; and is involved in sale of materials, such as caliche, sand, and other material, as well as sells land. The Water Services and Operations segment provides full-service water offerings, including water sourcing, produced-water treatment, infrastructure development, and disposal solutions to operators in the Permian Basin. This segment also holds produced water royalties. Texas Pacific Land Corporation was founded in 1888 and is headquartered in Dallas, Texas. |
| Insider Trading |
Relationship |
Date |
Transaction |
Cost |
#Shares |
Value ($) |
#Shares Total |
SEC Form 4 |
| HORIZON KINETICS ASSET MANAGEM | 10% Owner | Apr 30 '24 | Buy | 576.30 | 3 | 1,729 | 1,084,965 | May 01 11:33 AM | | HORIZON KINETICS ASSET MANAGEM | 10% Owner | Apr 29 '24 | Buy | 602.40 | 3 | 1,807 | 1,084,962 | Apr 30 10:53 AM | | HORIZON KINETICS ASSET MANAGEM | 10% Owner | Apr 26 '24 | Buy | 595.67 | 3 | 1,787 | 1,084,959 | Apr 29 11:48 AM | | HORIZON KINETICS ASSET MANAGEM | 10% Owner | Apr 25 '24 | Buy | 592.02 | 3 | 1,776 | 1,084,956 | Apr 26 11:51 AM | | HORIZON KINETICS ASSET MANAGEM | 10% Owner | Apr 24 '24 | Buy | 589.01 | 3 | 1,767 | 1,084,953 | Apr 25 10:12 AM |
|
|
|
 |
| Market Cap | 120.02M | EPS (ttm) | 1.94 |
| P/E | 8.56 | EPS this Y | - |
| Forward P/E | - | EPS next Y | - |
| PEG | - | EPS past 5Y | 1.51% |
| P/S | 0.90 | EPS next 5Y | - |
| P/B | 0.65 | EPS Q/Q | 27.17% |
| Dividend | 2.41% | Sales Q/Q | 34.28% |
| Insider Own | 40.11% | Inst Own | 15.00% |
| Insider Trans | 0.25% | Inst Trans | 4.04% |
| Short Float | 0.12% | Earnings | Apr 17/b |
| Analyst Recom | 1.00 | Target Price | 18.50 |
| Avg Volume | 5.88K | 52W Range | 13.62 - 18.86 |
|
|
|
|
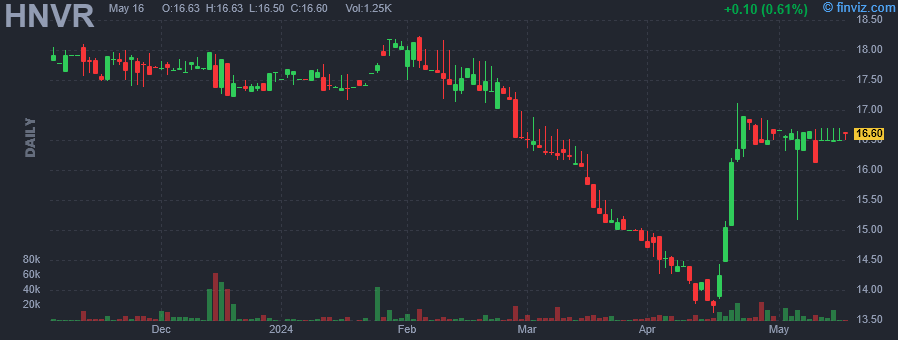
Hanover Bancorp, Inc. is a bank holding company, which engages in the provision of financial services and commercial banking products and services. It also offers multi-family and commercial mortgages, residential loans, business loans, and lines of credit. The company was founded on November 4, 2008 and is headquartered in New York, NY. |
| Insider Trading |
Relationship |
Date |
Transaction |
Cost |
#Shares |
Value ($) |
#Shares Total |
SEC Form 4 |
| PUORRO MICHAEL P | Chairman & CEO | Apr 30 '24 | Buy | 16.60 | 500 | 8,300 | 278,388 | May 01 10:49 AM | | Wilcox McClelland W | President | Apr 30 '24 | Buy | 16.60 | 250 | 4,150 | 81,537 | May 01 11:19 AM | | Burke Lance P | EVP & Chief Financial Officer | Apr 30 '24 | Buy | 16.60 | 200 | 3,320 | 21,371 | May 01 10:39 AM | | Vivona John P | FSVP & Chief Risk Officer | Apr 24 '24 | Buy | 16.79 | 200 | 3,357 | 3,200 | Apr 25 12:25 PM | | PUORRO MICHAEL P | Chairman & CEO | Apr 24 '24 | Buy | 16.78 | 200 | 3,356 | 277,888 | Apr 25 12:23 PM |
|
|
|
 |
| Market Cap | 91.10M | EPS (ttm) | 0.34 |
| P/E | 28.04 | EPS this Y | - |
| Forward P/E | - | EPS next Y | - |
| PEG | 1.87 | EPS past 5Y | 25.97% |
| P/S | 1.73 | EPS next 5Y | 15.00% |
| P/B | 2.48 | EPS Q/Q | 140.83% |
| Dividend | - | Sales Q/Q | 29.13% |
| Insider Own | 10.73% | Inst Own | 58.66% |
| Insider Trans | 1.29% | Inst Trans | -1.13% |
| Short Float | 0.45% | Earnings | Mar 14/a |
| Analyst Recom | 1.00 | Target Price | 17.00 |
| Avg Volume | 26.91K | 52W Range | 6.22 - 11.41 |
|
|
|
|
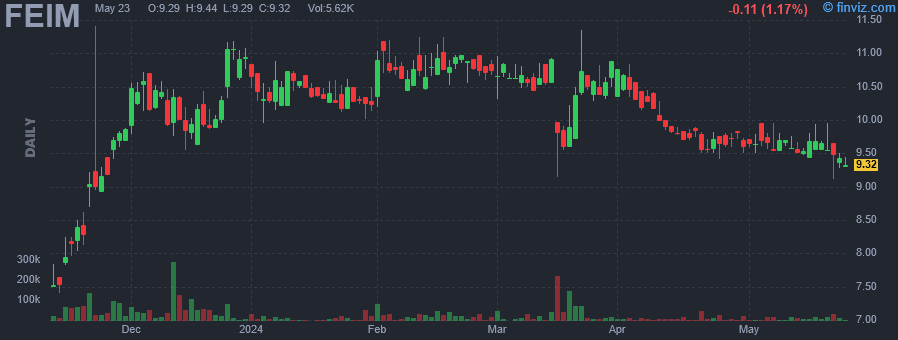
Frequency Electronics, Inc. engages in the design, development, and manufacture of precision time and frequency generation technology. It operates through the FEI-NY and FEI-Zyfer business segments. The FEI-NY segment provides precision time, frequency generation, and synchronization products and subsystems that are found on-board satellites, in ground-based communication stations, and imbedded in moving platforms. The FEI-Zyfer segment designs, develops, and manufactures products for precision time and frequency generation and synchronization, primarily incorporating GPS technology. The company was founded by Martin B. Bloch on August 25, 1961 and is headquartered in Mitchel Field, NY. |
| Insider Trading |
Relationship |
Date |
Transaction |
Cost |
#Shares |
Value ($) |
#Shares Total |
SEC Form 4 |
| Sarachek Russell M | Director | Apr 30 '24 | Buy | 9.50 | 687 | 6,526 | 436,034 | May 01 11:06 AM | | Sarachek Russell M | Director | Apr 19 '24 | Buy | 9.51 | 1,602 | 15,235 | 435,347 | Apr 25 11:07 AM | | Sarachek Russell M | Director | Apr 15 '24 | Buy | 9.77 | 658 | 6,429 | 433,745 | Apr 19 03:03 PM | | Edenbrook Capital, LLC | Director | Mar 20 '24 | Buy | 9.94 | 10,000 | 99,400 | 1,602,306 | Mar 22 04:54 PM | | Sarachek Russell M | Director | Sep 22 '23 | Buy | 6.73 | 4,928 | 33,165 | 433,087 | Sep 27 01:35 PM |
|
|
|
