 |
| Market Cap | 13.34B | EPS (ttm) | 7.16 |
| P/E | 6.98 | EPS this Y | -6.49% |
| Forward P/E | 6.78 | EPS next Y | 14.51% |
| PEG | 0.78 | EPS past 5Y | 7.25% |
| P/S | 1.26 | EPS next 5Y | 9.00% |
| P/B | 1.30 | EPS Q/Q | -36.86% |
| Dividend | 2.41% | Sales Q/Q | -3.95% |
| Insider Own | 4.09% | Inst Own | 78.09% |
| Insider Trans | -1.10% | Inst Trans | -3.27% |
| Short Float | 1.81% | Earnings | May 07/a |
| Analyst Recom | 1.88 | Target Price | 62.81 |
| Avg Volume | 3.23M | 52W Range | 32.07 - 55.95 |
|
|
|
|
Ovintiv, Inc. engages in the production and development of oil, natural gas liquids and natural gas producing plays. The firm operates through the following segments: Canadian Operations, USA Operations, and Market Optimization. The Canadian Operations segment includes the exploration for, development of, and production of oil, NGLs, natural gas and other related activities within Canada. The USA Operations segment includes the exploration for, development of, and production of oil, NGLs, natural gas and other related activities within the United States. The Market Optimization segment's activities are managed by the Midstream, Marketing & Fundamentals team, which is responsible for the sale of the company's proprietary production to third party customers. The company was founded in 1881 and is headquartered in Denver, CO. |
| Insider Trading |
Relationship |
Date |
Transaction |
Cost |
#Shares |
Value ($) |
#Shares Total |
SEC Form 4 |
| Chhina Sippy | Director | May 14 '24 | Buy | 49.50 | 1,600 | 79,200 | 1,600 | May 15 05:19 PM | | NANCE STEVEN W | Director | May 13 '24 | Sale | 50.00 | 12,000 | 600,000 | 8,929 | May 15 05:42 PM | | Zemljak Renee Ellen | EVP, Midstream, Mrktg & Fndmtl | Mar 14 '24 | Sale | 50.96 | 76,264 | 3,886,413 | 23,672 | Mar 14 04:59 PM | | Zemljak Renee Ellen | EVP, Midstream, Mrktg & Fndmtl | Mar 12 '24 | Option Exercise | 35.80 | 10,039 | 359,396 | 109,975 | Mar 14 04:59 PM | | Moore Rachel Maureen | EVP, Corporate Services | Mar 01 '24 | Sale | 50.65 | 9,300 | 471,045 | 52,557 | Mar 04 06:57 PM |
|
|
 |
 |
| Market Cap | 752.45M | EPS (ttm) | 2.71 |
| P/E | 18.72 | EPS this Y | - |
| Forward P/E | - | EPS next Y | - |
| PEG | - | EPS past 5Y | -7.81% |
| P/S | 4.41 | EPS next 5Y | - |
| P/B | 1.18 | EPS Q/Q | -30.94% |
| Dividend | 4.18% | Sales Q/Q | 9.92% |
| Insider Own | 24.18% | Inst Own | 12.78% |
| Insider Trans | 0.79% | Inst Trans | - |
| Short Float | 1.56% | Earnings | Apr 26/b |
| Analyst Recom | - | Target Price | - |
| Avg Volume | 17.88K | 52W Range | 42.91 - 85.00 |
|
|
|
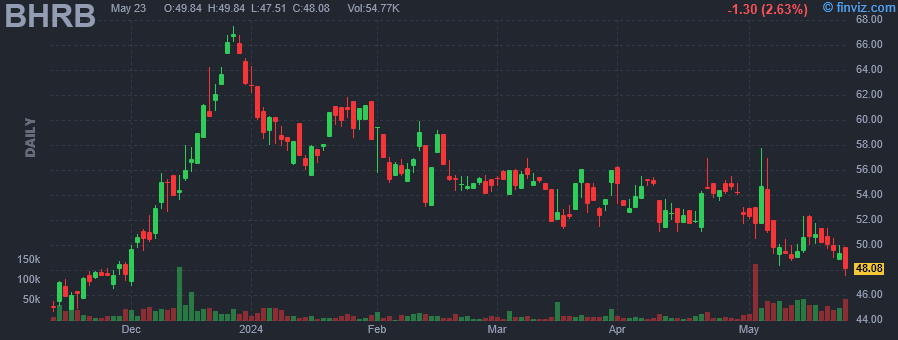
May-15-24 10:11AM
|
Is Burke & Herbert Bank & Trust Co (NASDAQ:BHRB) the Best Financial Dividend Stock Insiders are Buying in 2024?
(Insider Monkey) |
|
08:50AM
|
10 Best Financial Dividend Stocks Insiders are Buying in 2024
(Insider Monkey) |
|
May-13-24 09:54AM
|
BHRB Stock Earnings: Burke & Herbert Financial Reported Results for Q4 2023
(InvestorPlace) |
|
May-03-24 07:30AM
|
Burke & Herbert Financial Services Corp. Completes Merger of Equals with Summit Financial Group, Inc.
(PR Newswire) +5.92% |
|
Apr-26-24 01:53PM
|
BHRB Stock Earnings: Burke & Herbert Financial Reported Results for Q1 2024
(InvestorPlace) |
|
08:30AM
|
Burke & Herbert Financial Services Corp. Announces First Quarter 2024 Results and Declares Common Stock Dividend
(PR Newswire) |
|
Apr-19-24 08:30AM
|
Burke & Herbert Financial Services Corp. and Summit Financial Group, Inc. Announce Receipt of Regulatory Approvals and Closing Date for Merger of Equals
(PR Newswire) |
|
Feb-01-24 12:02PM
|
Hedge Fund and Insider Trading News: David Einhorn, Crispin Odey, Bill Ackman, Stanley Druckenmiller, Ken Griffin, Burke Herbert Financial Services (BHRB), KalVista Pharmaceuticals, Inc. (KALV), and More
(Insider Monkey) |
|
Jan-26-24 08:00AM
|
Burke & Herbert Financial Services Corp. Announces Fourth Quarter and Full Year 2023 Results and Declares Common Stock Dividend
(PR Newswire) |
|
Dec-06-23 02:07PM
|
Burke & Herbert Financial Services Corp. and Summit Financial Group, Inc. Announce Receipt of Shareholder Approval for Merger
(PR Newswire) |
|
Burke Herbert Financial Services Corp. is a bank holding company, which engages in the provision of banking products and financial services to small to medium-sized businesses, their owners and employees, professional corporations, non-profits, and individuals. It operates through the following loan portfolio segments: Commercial Real Estate, Owner-Occupied Commercial Real Estate, Acquisition, Construction, and Development, Commercial and Industrial, Single Family Residential (1-4 Units), and Consumer Non-Real Estate and Other. The Commercial Real Estate segment includes leasing of the real estate collateral or income generated from the sale of the collateral. The Owner-Occupied Commercial Real Estate segment focuses on the operations of the business that occupies the property and the value of the collateral. The Acquisition, Construction, and Development segment offers creditworthiness of the borrower, project completion within budget, sale after completion, and the value of the collateral. The Commercial and Industrial segment is involved in the operations of the business and the value of the collateral. The Single Family Residential (1-4 Units) segment provides loans for investment purpose carry risk associated with the continued creditworthiness of the borrower, the value of the collateral, and either the net operating income generated from the lease of the real estate collateral or income generated from the sale of the collateral. The Consumer Non-Real Estate and Other segment covers loans carry risk associated with the creditworthiness of the borrower and the value of the collateral. The company was founded on September 14, 2022 and is headquartered in Alexandria, VA. |
| Insider Trading |
Relationship |
Date |
Transaction |
Cost |
#Shares |
Value ($) |
#Shares Total |
SEC Form 4 |
| HINKLE GARY L | Director | May 15 '24 | Buy | 50.23 | 600 | 30,135 | 219,450 | May 15 05:17 PM | | HINKLE GARY L | Director | May 14 '24 | Buy | 49.50 | 2,779 | 137,560 | 218,850 | May 14 03:15 PM | | HINKLE GARY L | Director | May 13 '24 | Buy | 49.65 | 613 | 30,435 | 216,071 | May 14 09:33 AM | | HINKLE GARY L | Director | May 10 '24 | Buy | 49.60 | 1,608 | 79,757 | 215,458 | May 10 04:33 PM | | McLaughlin Shawn Patrick | Director | May 01 '24 | Buy | 52.51 | 850 | 44,634 | 51,850 | May 01 02:33 PM |
|
|
|
 |
| Market Cap | 207.78M | EPS (ttm) | -1.47 |
| P/E | - | EPS this Y | 25.59% |
| Forward P/E | 208.54 | EPS next Y | 112.25% |
| PEG | - | EPS past 5Y | - |
| P/S | 0.28 | EPS next 5Y | 25.00% |
| P/B | 1.32 | EPS Q/Q | -47.93% |
| Dividend | - | Sales Q/Q | 2.73% |
| Insider Own | 4.47% | Inst Own | 103.73% |
| Insider Trans | 271.69% | Inst Trans | -9.67% |
| Short Float | 14.89% | Earnings | Mar 19/b |
| Analyst Recom | 2.00 | Target Price | 30.75 |
| Avg Volume | 86.66K | 52W Range | 14.20 - 32.90 |
|
|
|
May-03-24 05:42PM
|
Harmonic, Reservoir Media, and More Stocks See Action From Activist Investors
(Barrons.com) |
|
May-02-24 01:59PM
|
Hedge Fund and Insider Trading News: Simon Sadler, John Paulson, Bill Ackman, Alden Global Capital, Greenlight Capital, Citadel LLC, Point72 Asset Management, CECO Environmental Corp. (CECO), Liberty SiriusXM Group (LSXMA), and More
(Insider Monkey) |
|
Apr-24-24 01:48PM
|
Hedge Fund and Insider Trading News: Bill Ackman, Appaloosa Management, Marshall Wace LLP, Centuri Holdings Inc (CTRI), Citi Trends, Inc. (CTRN), and More
(Insider Monkey) |
|
Mar-20-24 10:34AM
|
Citi Trends, Inc. (NASDAQ:CTRN) Q4 2023 Earnings Call Transcript
(Insider Monkey) |
|
Mar-19-24 11:23PM
|
Q4 2023 Citi Trends Inc Earnings Call
(Thomson Reuters StreetEvents) -6.32% |
|
03:45PM
|
Citi Trends (CTRN) Q4 2023 Earnings Call Transcript
(Motley Fool) |
|
10:52AM
|
CTRN Stock Earnings: Citi Trends Misses EPS, Misses Revenue for Q4 2023
(InvestorPlace) |
|
08:31AM
|
Citi Trends Inc (CTRN) Reports Mixed Fiscal 2023 Results Amidst Economic Challenges
(GuruFocus.com) |
|
07:02AM
|
Citi Trends: Fiscal Q4 Earnings Snapshot
(Associated Press Finance) |
|
06:45AM
|
Citi Trends Announces Fourth Quarter and Fiscal 2023 Results
(Business Wire) |
|
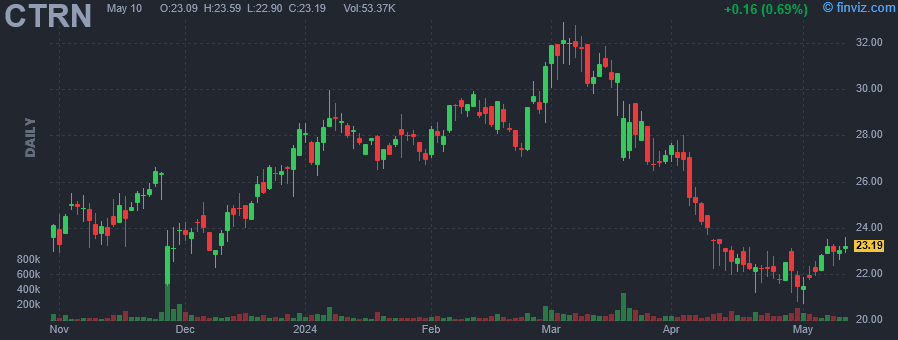
Citi Trends, Inc. engages in the retail of urban fashion apparel, accessories, and home trends. It offers products under its Citi Steps and Red Ape brands. The company was founded in 1946 and is headquartered in Savannah, GA. |
| Insider Trading |
Relationship |
Date |
Transaction |
Cost |
#Shares |
Value ($) |
#Shares Total |
SEC Form 4 |
| Fund 1 Investments, LLC | 10% Owner | May 15 '24 | Buy | 24.07 | 15,785 | 379,954 | 2,027,163 | May 15 05:03 PM | | Fund 1 Investments, LLC | 10% Owner | May 14 '24 | Buy | 24.19 | 4,000 | 96,775 | 2,011,378 | May 15 05:03 PM | | Fund 1 Investments, LLC | 10% Owner | May 13 '24 | Buy | 23.48 | 5,481 | 128,704 | 2,007,378 | May 15 05:03 PM | | Fund 1 Investments, LLC | 10% Owner | May 07 '24 | Buy | 23.18 | 9,500 | 220,168 | 2,001,897 | May 07 05:36 PM | | Fund 1 Investments, LLC | 10% Owner | May 06 '24 | Buy | 22.76 | 6,330 | 144,084 | 1,992,397 | May 07 05:36 PM |
|
|
| |
 |
| Market Cap | 1.12B | EPS (ttm) | 0.98 |
| P/E | 28.22 | EPS this Y | 16.44% |
| Forward P/E | 12.40 | EPS next Y | 9.58% |
| PEG | 3.02 | EPS past 5Y | -11.71% |
| P/S | 1.24 | EPS next 5Y | 9.34% |
| P/B | 1.67 | EPS Q/Q | 5.87% |
| Dividend | 0.58% | Sales Q/Q | 5.40% |
| Insider Own | 1.82% | Inst Own | 94.96% |
| Insider Trans | 3.59% | Inst Trans | -0.13% |
| Short Float | 5.36% | Earnings | Apr 30/b |
| Analyst Recom | 2.50 | Target Price | 40.00 |
| Avg Volume | 262.21K | 52W Range | 22.59 - 29.07 |
|
|
|
|
TriMas Corp. engages in the manufacture of industrial products for customers in the consumer products, aerospace, industrial, petrochemical, refinery, and oil and gas end markets. It operates through the following segments: Packaging, Aerospace, and Specialty Products. The Packaging segment designs and manufactures dispensing products, including foaming pumps, lotion and hand soap pumps, sanitizer pumps, beverage dispensers, perfume sprayers, nasal sprayers and trigger sprayers, polymeric and steel caps and closures, including food lids, flip-top closures, child resistant caps, drum and pail closures, and flexible spouts, polymeric jar products, and fully integrated dispensers for fill-ready bag-in-box applications, all for a variety of consumer product markets including, but not limited to, beauty and personal care, home care, food and beverage, and pharmaceutical and nutraceutical, as well as the industrial market. The Aerospace segment is involved in the design and manufacture of precision fasteners, tubular products and assemblies for fluid conveyance, and machined products and assemblies to serve the aerospace and defense market under the brand name Monogram Aerospace Fasteners, RSA Engineered Products and Martinic Engineering, Allfast Fastening Systems, and Mac Fasteners. The Specialty Products segment designs, manufactures, and distributes highly-engineered steel cylinders, wellhead engines, and compression systems for use within industrial markets and includes the Norris Cylinder and Arrow Engine brands. The company was founded by Brian P. Campbell in 1986 and is headquartered in Bloomfield Hills, MI. |
| Insider Trading |
Relationship |
Date |
Transaction |
Cost |
#Shares |
Value ($) |
#Shares Total |
SEC Form 4 |
| Tredwell Daniel P | Director | May 10 '24 | Buy | 26.80 | 81 | 2,168 | 50,842 | May 15 04:45 PM | | Parker Herbert K | Director | May 08 '24 | Buy | 26.27 | 6,000 | 157,597 | 51,157 | May 08 06:10 PM | | Parker Herbert K | Director | May 07 '24 | Buy | 26.01 | 6,000 | 156,060 | 45,157 | May 08 06:10 PM | | Parker Herbert K | Director | May 06 '24 | Buy | 26.52 | 6,100 | 161,789 | 39,157 | May 08 06:10 PM | | Parker Herbert K | Director | May 03 '24 | Buy | 26.34 | 1,500 | 39,512 | 33,057 | May 03 05:28 PM |
|
|
|
 |
| Market Cap | 5.81M | EPS (ttm) | -0.78 |
| P/E | - | EPS this Y | 64.94% |
| Forward P/E | - | EPS next Y | 14.81% |
| PEG | - | EPS past 5Y | -189.86% |
| P/S | 12.10 | EPS next 5Y | - |
| P/B | 2.10 | EPS Q/Q | 12.10% |
| Dividend | - | Sales Q/Q | 23.58% |
| Insider Own | 51.01% | Inst Own | 4.99% |
| Insider Trans | 1.70% | Inst Trans | - |
| Short Float | 0.86% | Earnings | - |
| Analyst Recom | 1.00 | Target Price | 2.00 |
| Avg Volume | 62.02K | 52W Range | 0.64 - 2.71 |
|
|
|
|
Lipella Pharmaceuticals, Inc. develops and commercializes lipid-based therapies for common bladder syndromes. It offers LP-08 which consists of Sphingomyelin Phospholipid bilayers separated by aqueous compartments, LP-09, a liposomal formulation of Botulinum toxin, and LP-10, a proprietary liposomal formulation of Tacrolimus, a potent immunosuppressant and anti-inflammatory agent. The company was founded by Jonathan Kaufman and Michael Chancellor on February 15, 2005 and is headquartered in Pittsburgh, PA. |
| Insider Trading |
Relationship |
Date |
Transaction |
Cost |
#Shares |
Value ($) |
#Shares Total |
SEC Form 4 |
| Kaufman Jonathan H | See remarks below. | May 14 '24 | Buy | 0.76 | 10,000 | 7,590 | 898,849 | May 15 04:39 PM | | Kaufman Jonathan H | See remarks below. | Mar 19 '24 | Buy | 0.87 | 25,000 | 21,802 | 888,849 | Mar 19 06:21 PM | | Kaufman Jonathan H | See remarks below. | Mar 18 '24 | Buy | 0.79 | 30,000 | 23,649 | 863,849 | Mar 19 06:21 PM |
|
|
| |
 |
| Market Cap | 165.81M | EPS (ttm) | -0.04 |
| P/E | - | EPS this Y | - |
| Forward P/E | - | EPS next Y | - |
| PEG | - | EPS past 5Y | 27.70% |
| P/S | 6.38 | EPS next 5Y | - |
| P/B | 0.72 | EPS Q/Q | -43.08% |
| Dividend | - | Sales Q/Q | 14.23% |
| Insider Own | 1.59% | Inst Own | 8.50% |
| Insider Trans | 5.77% | Inst Trans | -2.90% |
| Short Float | 6.25% | Earnings | May 09/a |
| Analyst Recom | 3.00 | Target Price | 0.44 |
| Avg Volume | 5.46M | 52W Range | 0.12 - 0.25 |
|
|
|
|
Zomedica Corp. operates as a veterinary health company, which engages in the discovery, development, and commercialization of pharmaceuticals for the companion pet. It offers products for dogs and cats by focusing on the unmet needs of clinical veterinarians. Its TRUFORMA biosensor platform is designed to assist practitioners in the diagnosis of complex conditions. The company was founded by Gerald L. Solensky. on January 7, 2013 and is headquartered in Ann Arbor, MI. |
| Insider Trading |
Relationship |
Date |
Transaction |
Cost |
#Shares |
Value ($) |
#Shares Total |
SEC Form 4 |
| POWERS JOHNNY D | Director | May 14 '24 | Buy | 0.14 | 50,000 | 6,981 | 2,100,000 | May 15 04:30 PM | | Blair Anthony K | COO | May 13 '24 | Buy | 0.14 | 150,000 | 21,000 | 150,000 | May 14 04:31 PM | | HEATON LARRY C II | CEO | May 13 '24 | Buy | 0.14 | 100,000 | 14,200 | 300,000 | May 13 05:07 PM | | POWERS JOHNNY D | Director | May 13 '24 | Buy | 0.14 | 100,000 | 14,000 | 2,050,000 | May 14 04:31 PM | | POWERS JOHNNY D | Director | Dec 15 '23 | Buy | 0.17 | 100,000 | 16,500 | 1,950 | Dec 18 09:20 AM |
|
|
|
 |
| Market Cap | 357.95M | EPS (ttm) | 1.90 |
| P/E | 8.19 | EPS this Y | -21.09% |
| Forward P/E | 9.35 | EPS next Y | 9.78% |
| PEG | - | EPS past 5Y | 3.67% |
| P/S | 2.93 | EPS next 5Y | - |
| P/B | 1.07 | EPS Q/Q | -28.13% |
| Dividend | 9.73% | Sales Q/Q | -40.19% |
| Insider Own | 1.71% | Inst Own | 9.32% |
| Insider Trans | 1.29% | Inst Trans | 1.97% |
| Short Float | 0.14% | Earnings | May 08/b |
| Analyst Recom | 1.33 | Target Price | 18.64 |
| Avg Volume | 41.80K | 52W Range | 14.44 - 17.40 |
|
|
|
|
Greystone Housing Impact Investors LP engages in the acquisition of a portfolio of mortgage revenue bonds that are issued by state and local housing authorities to provide construction and permanent financing for affordable multifamily and student housing and commercial properties. It operates through the following segments: Affordable Multifamily MRB Investment, Seniors and Skilled Nursing MRB Investments, MF Properties and Market-Rate Joint Venture Investments. The Affordable Multifamily MRB Investment segment consists of the Partnership's portfolio of MRBs, GILs and related property loans that have been issued to provide construction and/or permanent financing for multifamily residential and commercial properties in their market areas. The Seniors and Skilled Nursing MRB Investments segment consists of two MRBs and a property loan that have been issued to provide acquisition, construction and/or permanent financing for seniors housing and skilled nursing properties. The MF Properties segment consists primarily of student housing residential properties that were held by the Partnership. The Market-Rate Joint Venture Investments segment consists of the operations of ATAX Vantage Holdings, LLC, ATAX Freestone Holdings, LLC, ATAX Senior Housing Holdings I, LLC, and ATAX Great Hill Holdings LLC, which make noncontrolling investments in unconsolidated entities for the construction, stabilization, and ultimate sale of market-rate multifamily and seniors housing properties also includes the consolidated VIE of Vantage at San Marcos. The company was founded on April 2, 1998 and is headquartered in Omaha, NE. |
| Insider Trading |
Relationship |
Date |
Transaction |
Cost |
#Shares |
Value ($) |
#Shares Total |
SEC Form 4 |
| Rogozinski Kenneth | Chief Executive Officer | May 14 '24 | Buy | 15.47 | 3,600 | 55,692 | 57,164 | May 15 04:15 PM | | Rogozinski Kenneth | Chief Executive Officer | May 13 '24 | Buy | 15.56 | 400 | 6,224 | 53,564 | May 14 04:15 PM | | Rogozinski Kenneth | Chief Executive Officer | May 10 '24 | Buy | 15.67 | 1,000 | 15,670 | 53,164 | May 14 04:15 PM | | Rogozinski Kenneth | Chief Executive Officer | Aug 07 '23 | Buy | 15.92 | 2,000 | 31,840 | 51,519 | Aug 08 04:30 PM |
|
|
| |
 |
| Market Cap | 404.40M | EPS (ttm) | -15.34 |
| P/E | - | EPS this Y | 65.06% |
| Forward P/E | - | EPS next Y | 17.24% |
| PEG | - | EPS past 5Y | -483.52% |
| P/S | - | EPS next 5Y | 25.90% |
| P/B | 0.72 | EPS Q/Q | 10.50% |
| Dividend | - | Sales Q/Q | - |
| Insider Own | 30.15% | Inst Own | 41.26% |
| Insider Trans | 15.49% | Inst Trans | -2.70% |
| Short Float | 2.65% | Earnings | May 08/a |
| Analyst Recom | 1.00 | Target Price | 34.00 |
| Avg Volume | 124.16K | 52W Range | 9.91 - 24.59 |
|
|
|
|
LENZ Therapeutics, Inc. operates as a clinical stage company, which develops ophthalmic pharmaceutical products. It offers eye drop product treatment for presbyopia. The company was founded by James McCollum in July 2013 and is headquartered in Del Mar, CA. |
| Insider Trading |
Relationship |
Date |
Transaction |
Cost |
#Shares |
Value ($) |
#Shares Total |
SEC Form 4 |
| Chevallard Daniel R. | Chief Financial Officer | May 14 '24 | Buy | 15.68 | 3,188 | 49,988 | 3,188 | May 15 04:13 PM | | MCCOLLUM JAMES W | Director | May 13 '24 | Buy | 15.99 | 31,332 | 501,093 | 525,565 | May 14 05:29 PM | | RA CAPITAL MANAGEMENT, L.P. | Director | Mar 21 '24 | Buy | 15.03 | 998,009 | 15,000,075 | 3,319,339 | Mar 25 08:48 PM |
|
|
|
 |
| Market Cap | 331.13M | EPS (ttm) | 4.68 |
| P/E | 10.25 | EPS this Y | -5.25% |
| Forward P/E | 9.75 | EPS next Y | 6.84% |
| PEG | - | EPS past 5Y | 8.99% |
| P/S | 2.27 | EPS next 5Y | - |
| P/B | 1.11 | EPS Q/Q | -13.12% |
| Dividend | 0.74% | Sales Q/Q | 18.32% |
| Insider Own | 37.39% | Inst Own | 21.96% |
| Insider Trans | -0.15% | Inst Trans | -1.50% |
| Short Float | 0.50% | Earnings | Apr 25/a |
| Analyst Recom | 1.00 | Target Price | 62.00 |
| Avg Volume | 8.46K | 52W Range | 44.13 - 58.00 |
|
|
|
|
Red River Bancshares, Inc. is a bank holding company, which engages in the provision of banking products and services for commercial and retail customers through its subsidiary. It offers real estate and commercial loans, treasury management, retail banking networks, private banking, residential mortgage lending, and investment services. The company was founded on March 16, 1998 and is headquartered in Alexandria, LA. |
| Insider Trading |
Relationship |
Date |
Transaction |
Cost |
#Shares |
Value ($) |
#Shares Total |
SEC Form 4 |
| BROWN MICHAEL J | Director | May 14 '24 | Buy | 47.77 | 202 | 9,650 | 2,103 | May 15 04:08 PM | | BROWN MICHAEL J | Director | May 13 '24 | Buy | 47.75 | 401 | 19,147 | 1,901 | May 15 04:08 PM | | Price Teddy Ray | Director | May 03 '24 | Buy | 47.08 | 738 | 34,742 | 367,478 | May 03 02:22 PM | | Price Teddy Ray | Director | May 03 '24 | Buy | 47.99 | 131 | 6,287 | 64,785 | May 03 02:22 PM | | Salazar Tammi R. | See Remarks | Mar 28 '24 | Sale | 50.05 | 781 | 39,089 | 39,901 | Apr 01 02:50 PM |
|
|
|
 |
| Market Cap | 174.02M | EPS (ttm) | 0.37 |
| P/E | 33.56 | EPS this Y | 21.28% |
| Forward P/E | 18.01 | EPS next Y | 21.05% |
| PEG | - | EPS past 5Y | -9.09% |
| P/S | 4.78 | EPS next 5Y | - |
| P/B | 2.72 | EPS Q/Q | -38.89% |
| Dividend | 1.93% | Sales Q/Q | -14.59% |
| Insider Own | 60.15% | Inst Own | 11.67% |
| Insider Trans | 0.34% | Inst Trans | -7.20% |
| Short Float | 2.17% | Earnings | May 09/a |
| Analyst Recom | 1.00 | Target Price | 19.00 |
| Avg Volume | 14.15K | 52W Range | 11.40 - 29.38 |
|
|
|
|
HireQuest, Inc. engages in the provision of staffing services. It also offers temporary, permanent, and direct-hire recruiting and staffing services of entry-level and clerical or admin employees, construction and light industrial workers, semi-skilled trades, healthcare personnel, and professionals and executives. The company was founded in 1998 and is headquartered in Goose Creek, SC. |
| Insider Trading |
Relationship |
Date |
Transaction |
Cost |
#Shares |
Value ($) |
#Shares Total |
SEC Form 4 |
| Hermanns Richard | President and CEO | May 14 '24 | Buy | 12.07 | 10,000 | 120,720 | 3,049,329 | May 15 04:07 PM | | Hagenbuch Lawrence F | Director | Dec 19 '23 | Buy | 16.32 | 3,900 | 63,660 | 96,218 | Dec 20 08:27 AM | | Malhotra R. Rimmy | Director | Dec 15 '23 | Buy | 16.18 | 4,000 | 64,739 | 120,130 | Dec 18 04:05 PM | | Malhotra R. Rimmy | Director | Dec 15 '23 | Buy | 16.31 | 2,000 | 32,620 | 73,116 | Dec 18 04:05 PM | | Shanahan Kathleen M | Director | Nov 28 '23 | Buy | 15.00 | 1,866 | 27,981 | 57,532 | Nov 30 04:05 PM |
|
|
|
