 |
| Market Cap | 308.80M | EPS (ttm) | -0.59 |
| P/E | - | EPS this Y | -31.33% |
| Forward P/E | - | EPS next Y | -32.74% |
| PEG | - | EPS past 5Y | 25.04% |
| P/S | - | EPS next 5Y | - |
| P/B | 2.19 | EPS Q/Q | 11.63% |
| Dividend | - | Sales Q/Q | - |
| Insider Own | 2.24% | Inst Own | 78.61% |
| Insider Trans | 3.17% | Inst Trans | -11.39% |
| Short Float | 1.78% | Earnings | Feb 13/b |
| Analyst Recom | 1.00 | Target Price | 19.00 |
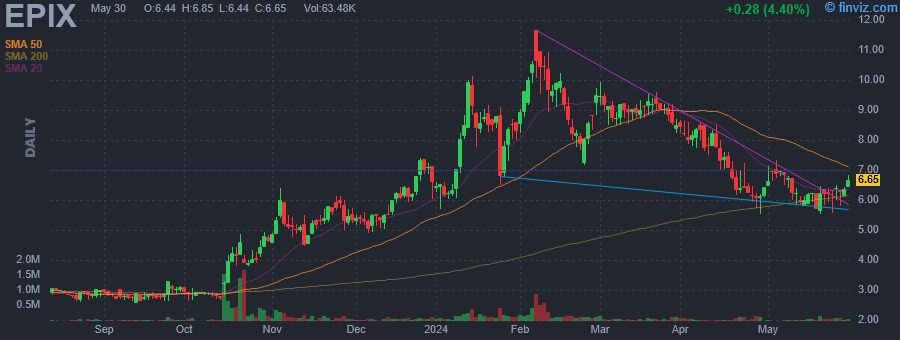
| Avg Volume | 118.09K | 52W Range | 2.58 - 11.67 |
|
|
|
|
ESSA Pharma, Inc. is a clinical stage pharmaceutical company. It engages in the business of developing small molecule drugs for the treatment of prostate cancer. The company was founded by Marianne D. Sadar and Raymond J. Andersen on January 6, 2009 and is headquartered in Vancouver, Canada. |
| Insider Trading |
Relationship |
Date |
Transaction |
Cost |
#Shares |
Value ($) |
#Shares Total |
SEC Form 4 |
| Virsik Peter | Chief Operating Officer | May 06 '24 | Sale | 6.95 | 694 | 4,823 | 11,246 | May 06 05:17 PM | | Glickman Richard M | Director | Apr 24 '24 | Option Exercise | 4.90 | 3,750 | 18,375 | 43,240 | Apr 25 10:35 AM | | Virsik Peter | Chief Operating Officer | Apr 05 '24 | Sale | 7.94 | 694 | 5,510 | 11,940 | Apr 05 06:16 PM | | Virsik Peter | Chief Operating Officer | Mar 05 '24 | Sale | 8.98 | 694 | 6,232 | 12,634 | Mar 05 06:50 PM | | Virsik Peter | Chief Operating Officer | Feb 06 '24 | Option Exercise | 3.23 | 72,782 | 235,086 | 86,110 | Feb 07 11:29 AM |
|
|
 |
 |
| Market Cap | 1.76B | EPS (ttm) | 1.57 |
| P/E | 10.01 | EPS this Y | -33.09% |
| Forward P/E | 8.43 | EPS next Y | 14.08% |
| PEG | 1.35 | EPS past 5Y | 4.38% |
| P/S | 0.36 | EPS next 5Y | 7.42% |
| P/B | 0.64 | EPS Q/Q | -24.99% |
| Dividend | 4.06% | Sales Q/Q | -0.59% |
| Insider Own | 1.91% | Inst Own | 98.95% |
| Insider Trans | -7.78% | Inst Trans | -6.57% |
| Short Float | 6.93% | Earnings | Apr 24/b |
| Analyst Recom | 3.44 | Target Price | 14.88 |
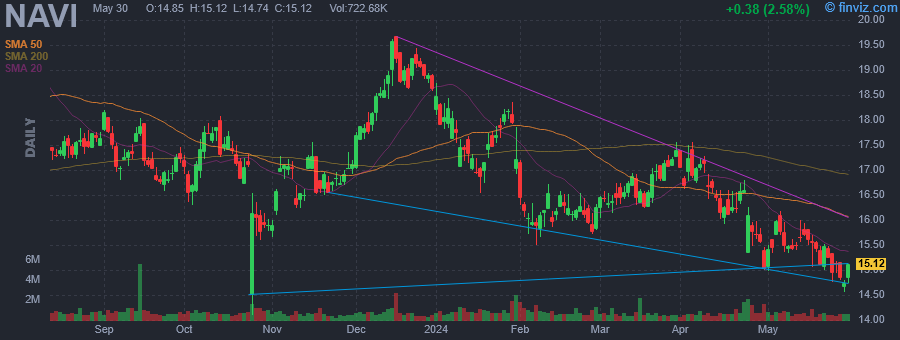
| Avg Volume | 865.25K | 52W Range | 14.10 - 19.69 |
|
|
|
|
Navient Corp. engages in the provision of asset management and business processing solutions for education, healthcare and government clients at the federal, state and local levels. It operates through the following segments: Federal Education Loans, Consumer Lending, Business Processing and Other. The Federal Education Loans segment owns FFELP Loans and performs servicing and asset recovery services on FFELP Loan portfolio. The Consumer Lending segment owns, originates, acquires and services high-quality private education loans. The Business Processing segment engages in the provision of government and healthcare services. The Other segment consists of corporate liquidity portfolio, gains and losses incurred on the repurchase of debt, unallocated expenses of shared services and restructuring/other reorganization expenses. The company was founded in 1973 and is headquartered in Herndon, VA. |
| Insider Trading |
Relationship |
Date |
Transaction |
Cost |
#Shares |
Value ($) |
#Shares Total |
SEC Form 4 |
| HELEEN MARK L | EVP, CLO & Secretary | May 03 '24 | Sale | 16.00 | 10,000 | 160,000 | 393,611 | May 06 05:16 PM | | HELEEN MARK L | EVP, CLO & Secretary | Jan 31 '24 | Sale | 17.20 | 10,000 | 171,967 | 385,577 | Feb 02 04:18 PM | | KANE JOHN M | EVP & Group President | Dec 14 '23 | Sale | 19.02 | 150,132 | 2,855,090 | 490,778 | Dec 18 05:58 PM | | HELEEN MARK L | EVP, CLO & Secretary | Nov 07 '23 | Sale | 16.99 | 10,000 | 169,863 | 395,330 | Nov 08 04:43 PM | | HELEEN MARK L | EVP, CLO & Secretary | Jul 31 '23 | Sale | 19.01 | 20,000 | 380,138 | 404,056 | Aug 02 04:46 PM |
|
|
|
 |
| Market Cap | 4.51B | EPS (ttm) | 4.32 |
| P/E | 22.72 | EPS this Y | -12.62% |
| Forward P/E | 16.34 | EPS next Y | 12.90% |
| PEG | 3.73 | EPS past 5Y | 8.66% |
| P/S | 1.03 | EPS next 5Y | 6.10% |
| P/B | 2.44 | EPS Q/Q | -18.27% |
| Dividend | - | Sales Q/Q | -7.07% |
| Insider Own | 3.65% | Inst Own | 98.06% |
| Insider Trans | -7.06% | Inst Trans | -1.60% |
| Short Float | 2.67% | Earnings | Apr 24/a |
| Analyst Recom | 2.62 | Target Price | 94.00 |
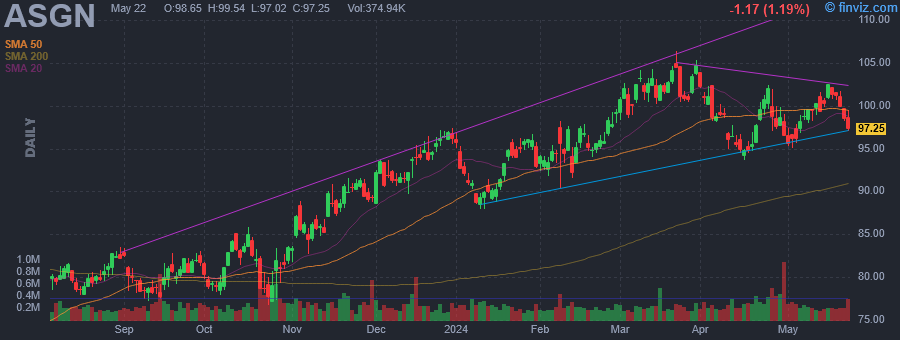
| Avg Volume | 270.81K | 52W Range | 63.27 - 106.42 |
|
|
|
|
ASGN Incorporated engages in the provision of information technology services and solutions. It operates through the Commercial and Federal Government segments. The Commercial segment involves the provision of consulting, creative digital marketing, and permanent placement services. The Federal Government segment provides mission-critical solutions. The company was founded on December 30, 1985 and is headquartered in Glen Allen, VA. |
| Insider Trading |
Relationship |
Date |
Transaction |
Cost |
#Shares |
Value ($) |
#Shares Total |
SEC Form 4 |
| BLAZER RANDOLPH C | President | May 06 '24 | Sale | 98.00 | 6,000 | 588,000 | 101,923 | May 06 05:16 PM | | Lindstrom Carol | Director | Apr 30 '24 | Sale | 97.04 | 1,000 | 97,038 | 5,639 | Apr 30 05:43 PM | | KITTRELL MARTY R | Director | Apr 26 '24 | Sale | 98.61 | 1,000 | 98,613 | 4,316 | Apr 30 04:33 PM | | Sheridan Edwin A. | Director | Mar 08 '24 | Sale | 103.78 | 13,442 | 1,395,011 | 616,972 | Mar 08 05:02 PM | | Sheridan Edwin A. | Director | Mar 07 '24 | Sale | 101.93 | 50,000 | 5,096,660 | 630,414 | Mar 08 05:02 PM |
|
|
| |
 |
| Market Cap | 1.85B | EPS (ttm) | 3.28 |
| P/E | 19.29 | EPS this Y | 14.14% |
| Forward P/E | 15.68 | EPS next Y | 7.97% |
| PEG | 1.93 | EPS past 5Y | 4.41% |
| P/S | 2.31 | EPS next 5Y | 10.00% |
| P/B | 4.54 | EPS Q/Q | 110.77% |
| Dividend | - | Sales Q/Q | 2.42% |
| Insider Own | 5.98% | Inst Own | 91.54% |
| Insider Trans | -42.20% | Inst Trans | -4.06% |
| Short Float | 4.08% | Earnings | May 01/b |
| Analyst Recom | 1.00 | Target Price | 70.50 |
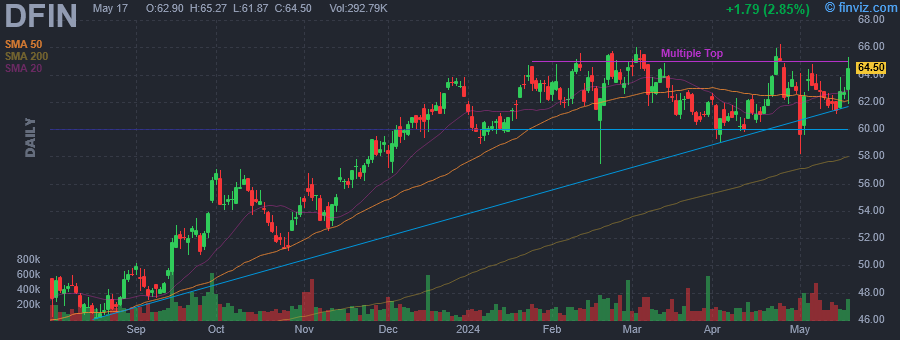
| Avg Volume | 200.43K | 52W Range | 41.45 - 66.21 |
|
|
|
|
Donnelley Financial Solutions, Inc. engages in the provision of innovative software and technology-enabled financial regulatory and compliance solutions. It operates through the following segments: Capital Markets-Software Solutions (CM-SS), Capital Markets-Compliance and Communications Management (CM-CCM), Investment Companies-Software Solutions (IC-SS), Investment Companies-Compliance and Communications Management (IC-CCM), and Corporate. The CM-SS segment provides Venue and ActiveDisclosure to public and private companies to help manage public and private transactional and compliance processes, collaborate, and tag, validate, and file SEC documents. The CM-CCM segment offers tech-enabled services and print and distribution solutions to public and private companies for deal solutions and SEC compliance requirements. The IC-SS segment focuses on clients with the Arc Suite platform that contains a comprehensive suite of cloud-based solutions including ArcDigital, ArcReporting, ArcPro, and ArcRegulatory as well as services that enable storage and management of compliance and regulatory information. The IC-CCM segment is involved in turnkey proxy services including discovery, planning and implementation, print and mail management, solicitation, tabulation services, stockholder meeting review, and expert support. The Corporate segment includes unallocated selling, general, and administrative activities and associated expenses including executive, legal, finance, and certain facility costs. The company was founded on February 22, 2016 and is headquartered in Chicago, IL. |
| Insider Trading |
Relationship |
Date |
Transaction |
Cost |
#Shares |
Value ($) |
#Shares Total |
SEC Form 4 |
| Williams Robert Kirk | Chief People & Admin Officer | May 03 '24 | Sale | 63.58 | 19,084 | 1,213,390 | 58,983 | May 06 05:12 PM | | Clay Craig | President, GCM | Apr 24 '24 | Sale | 66.02 | 5,698 | 376,203 | 148,748 | Apr 26 04:59 PM | | Jacobowitz Jeffrey | Director | Mar 07 '24 | Sale | 62.60 | 94,169 | 5,894,868 | 2,232,487 | Mar 08 04:42 PM | | Jacobowitz Jeffrey | Director | Mar 06 '24 | Sale | 64.70 | 159,607 | 10,327,195 | 2,326,656 | Mar 08 04:42 PM | | Leib Daniel | Chief Executive Officer | Mar 01 '24 | Sale | 64.63 | 6,878 | 444,535 | 517,474 | Mar 04 05:36 PM |
|
|
|
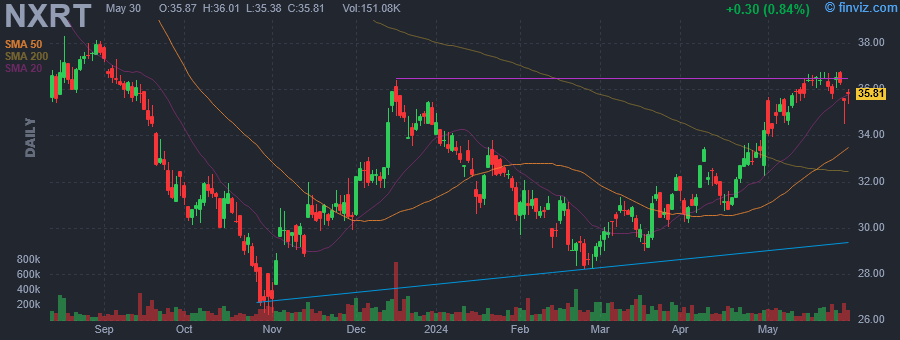 |
| Market Cap | 911.48M | EPS (ttm) | 2.82 |
| P/E | 12.52 | EPS this Y | -122.38% |
| Forward P/E | - | EPS next Y | -64.32% |
| PEG | 0.80 | EPS past 5Y | - |
| P/S | 3.30 | EPS next 5Y | 15.62% |
| P/B | 1.78 | EPS Q/Q | 757.81% |
| Dividend | 5.25% | Sales Q/Q | -2.38% |
| Insider Own | 12.03% | Inst Own | 85.71% |
| Insider Trans | -0.32% | Inst Trans | -4.28% |
| Short Float | 1.92% | Earnings | Apr 30/b |
| Analyst Recom | 2.33 | Target Price | 37.14 |
| Avg Volume | 167.69K | 52W Range | 26.21 - 49.87 |
|
|
|
|
NexPoint Residential Trust, Inc. engages in the acquisition, management, and disposition of multifamily assets. It also focuses on providing lifestyle amenities and upgraded living spaces to low and moderate income renters in the Southeastern United States and Texas. The company was founded on September 19, 2014 and is headquartered in Dallas, TX. |
| Insider Trading |
Relationship |
Date |
Transaction |
Cost |
#Shares |
Value ($) |
#Shares Total |
SEC Form 4 |
| Mitts Brian | See Remarks | May 02 '24 | Sale | 34.25 | 5,000 | 171,250 | 66,947 | May 06 05:10 PM | | Mitts Brian | CFO, EVP Finance, Secy & Treas | Jan 08 '24 | Sale | 33.74 | 5,000 | 168,700 | 62,883 | Jan 10 04:30 PM |
|
|
| |
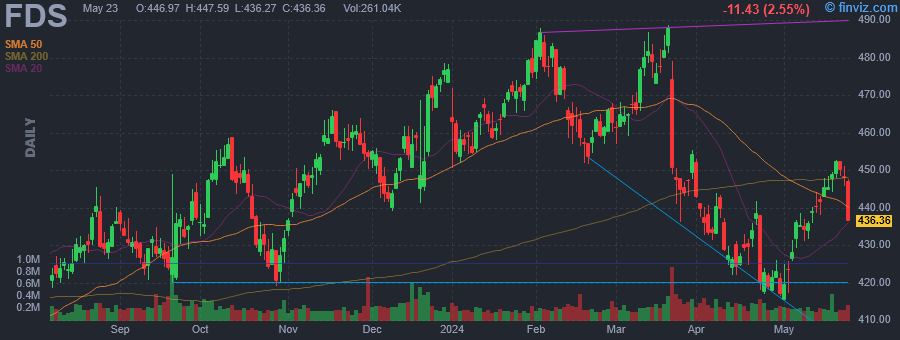 |
| Market Cap | 16.62B | EPS (ttm) | 12.63 |
| P/E | 34.53 | EPS this Y | 10.24% |
| Forward P/E | 24.76 | EPS next Y | 9.79% |
| PEG | 3.52 | EPS past 5Y | 12.16% |
| P/S | 7.72 | EPS next 5Y | 9.80% |
| P/B | 9.23 | EPS Q/Q | 8.02% |
| Dividend | 0.93% | Sales Q/Q | 5.99% |
| Insider Own | 0.22% | Inst Own | 92.85% |
| Insider Trans | -44.92% | Inst Trans | 0.94% |
| Short Float | 4.32% | Earnings | Mar 21/b |
| Analyst Recom | 3.04 | Target Price | 460.98 |
| Avg Volume | 261.06K | 52W Range | 380.96 - 488.64 |
|
|
|
|
FactSet Research Systems Inc. (the Company or FactSet) is a global provider of integrated financial information, analytical applications and services for the investment and corporate communities. Since inception, global financial professionals have utilized the Company's content and multi-asset class solutions across each stage of the investment process. FactSet's goal is to provide a seamless user experience spanning idea generation, research, portfolio construction, trade execution, performance measurement, risk management, reporting, and portfolio analysis, in which the Company serves the front, middle, and back offices to drive productivity and improved performance. FactSet's flexible, open data and technology solutions can be implemented both across the investment portfolio lifecycle or as standalone components serving different workflows in the organization. FactSet is focused on growing the business throughout each of its three segments, the Americas, EMEA (formerly known as Europe), and Asia Pacific. The Company primarily delivers insight and information through the workflow solutions of Research, Analytics and Trading, Content and Technology Solutions (CTS) and Wealth. FactSet currently serves financial professionals, which include portfolio managers, investment research professionals, investment bankers, risk and performance analysts, wealth advisors and corporate clients. FactSet provides both insights on global market trends and intelligence on companies and industries, as well as capabilities to monitor portfolio risk and performance and to execute trades. The Company combines dedicated client service with open and flexible technology offerings, such as a configurable desktop and mobile platform, comprehensive data feeds, an open marketplace and digital portals and application programming interfaces (APIs). The Company's revenue is primarily derived from subscriptions to products and services such as workstations, analytics, enterprise data, and research management. FactSet Research Systems was founded by Howard E. Wille and Charles J. Snyder in September 1978 and is headquartered in Norwalk, CT. |
| Insider Trading |
Relationship |
Date |
Transaction |
Cost |
#Shares |
Value ($) |
#Shares Total |
SEC Form 4 |
| Robie Robert J. | EVP, Institutional Buyside | May 06 '24 | Option Exercise | 234.63 | 3,466 | 813,223 | 5,821 | May 06 05:04 PM | | Robie Robert J. | EVP, Institutional Buyside | May 06 '24 | Sale | 431.48 | 4,336 | 1,870,897 | 1,485 | May 06 05:04 PM | | Skoko Goran | EVP, Dealmakers & Wealth | May 03 '24 | Option Exercise | 152.28 | 4,106 | 625,262 | 9,368 | May 06 05:03 PM | | Shan Helen L. | EVP, Chief Revenue Officer | May 03 '24 | Option Exercise | 0.00 | 1,807 | 0 | 5,084 | May 06 04:13 PM | | Skoko Goran | EVP, Dealmakers & Wealth | May 03 '24 | Sale | 428.57 | 4,106 | 1,759,710 | 5,262 | May 06 05:03 PM |
|
|
|
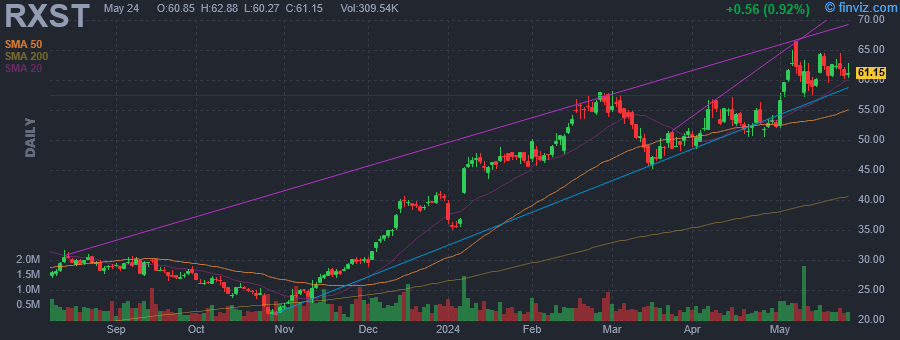 |
| Market Cap | 2.34B | EPS (ttm) | -1.42 |
| P/E | - | EPS this Y | 30.29% |
| Forward P/E | - | EPS next Y | 28.05% |
| PEG | - | EPS past 5Y | - |
| P/S | 26.22 | EPS next 5Y | 19.00% |
| P/B | 14.16 | EPS Q/Q | 54.24% |
| Dividend | - | Sales Q/Q | 77.65% |
| Insider Own | 15.95% | Inst Own | 79.40% |
| Insider Trans | -20.52% | Inst Trans | -1.01% |
| Short Float | 4.70% | Earnings | May 06/a |
| Analyst Recom | 1.00 | Target Price | 62.62 |
| Avg Volume | 404.27K | 52W Range | 18.09 - 61.85 |
|
|
|
Today 05:37PM
|
RxSight Inc (RXST) Surpasses Analyst Revenue Forecasts in Q1 2024
(GuruFocus.com) |
|
05:06PM
|
Rxsight Insider Sold Shares Worth $2,405,872, According to a Recent SEC Filing
(MT Newswires) |
|
04:05PM
|
RxSight, Inc. Reports First Quarter 2024 Financial Results
(GlobeNewswire) |
|
May-02-24 05:03PM
|
Rxsight Insider Sold Shares Worth $526,913, According to a Recent SEC Filing
(MT Newswires) +5.17% |
|
May-01-24 04:05PM
|
RxSight, Inc. to Present at the Bank of America Healthcare Conference
(GlobeNewswire) +8.77% |
|
Apr-22-24 04:05PM
|
RxSight, Inc. to Report First Quarter Financial Results on May 6, 2024
(GlobeNewswire) |
|
Apr-04-24 04:05PM
|
RxSight Announces Commercial Launch of its Newest Light Adjustable Lens , the LAL+ , and Features Multiple Doctor Presentations at the Upcoming ASCRS Annual Meeting
(GlobeNewswire) |
|
Mar-27-24 04:05PM
|
RxSight, Inc. to Participate in the 23rd Annual Needham Virtual Healthcare Conference
(GlobeNewswire) |
|
Feb-29-24 07:05PM
|
RxSight, Inc. to Participate in the 34th Annual Oppenheimer Healthcare Conference
(GlobeNewswire) |
|
11:09AM
|
RxSight, Inc. (NASDAQ:RXST) Q4 2023 Earnings Call Transcript
(Insider Monkey) |
|
RxSight, Inc. engages in the research, development, manufacture, and sale of light adjustable lenses and related capital equipment. It also commercializes adjustable intraocular lens (IOL) that is customized after cataract surgery. The company was founded on March 5, 1997 and is headquartered in Aliso Viejo, CA. |
| Insider Trading |
Relationship |
Date |
Transaction |
Cost |
#Shares |
Value ($) |
#Shares Total |
SEC Form 4 |
| Kurtz Ronald M MD | President & CEO | May 03 '24 | Sale | 60.15 | 40,000 | 2,405,872 | 764,610 | May 06 05:02 PM | | Thunen Shelley B | Chief Financial Officer | May 01 '24 | Option Exercise | 15.60 | 10,247 | 159,836 | 23,938 | May 02 04:58 PM | | Thunen Shelley B | Chief Financial Officer | May 01 '24 | Sale | 52.69 | 10,000 | 526,913 | 13,938 | May 02 04:58 PM | | Thunen Shelley B | Chief Financial Officer | Apr 01 '24 | Sale | 49.90 | 20,000 | 997,946 | 8,402 | Apr 02 04:18 PM | | Thunen Shelley B | Chief Financial Officer | Mar 01 '24 | Option Exercise | 15.60 | 10,000 | 155,983 | 23,691 | Mar 05 04:05 PM |
|
|
| |
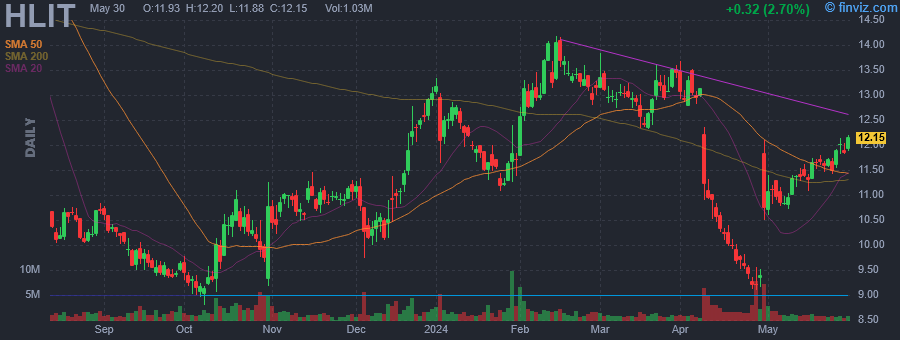 |
| Market Cap | 1.26B | EPS (ttm) | 0.61 |
| P/E | 17.83 | EPS this Y | 57.21% |
| Forward P/E | 11.27 | EPS next Y | 65.39% |
| PEG | 0.46 | EPS past 5Y | - |
| P/S | 2.21 | EPS next 5Y | 38.90% |
| P/B | 2.97 | EPS Q/Q | -266.67% |
| Dividend | - | Sales Q/Q | -22.57% |
| Insider Own | 2.69% | Inst Own | 105.55% |
| Insider Trans | -6.80% | Inst Trans | -7.33% |
| Short Float | 6.72% | Earnings | Apr 29/a |
| Analyst Recom | 1.17 | Target Price | 16.00 |
| Avg Volume | 1.91M | 52W Range | 8.80 - 18.43 |
|
|
|
|
Harmonic, Inc. engages in the development and sale of video delivery software, products, system solutions, and services. It operates through the Video and Broadband segments. The Video segment sells video processing and production and playout services to cable operators, satellite and telecommunications pay-TV service providers, and broadcast and media companies. The Broadband segment offers solutions to cable operators broadband access solutions and related services, including cOS software-based broadband access solution, to broadband operators globally. The company was founded in June 1988 and is headquartered in San Jose, CA. |
| Insider Trading |
Relationship |
Date |
Transaction |
Cost |
#Shares |
Value ($) |
#Shares Total |
SEC Form 4 |
| Graham Ian | SVP, Global Sales & Video Svcs | May 02 '24 | Sale | 10.95 | 52,730 | 577,430 | 63,616 | May 06 05:00 PM | | Haltmayer Neven | SVP, Video R&D | Feb 16 '24 | Sale | 13.68 | 14,747 | 201,676 | 156,559 | Mar 06 09:15 PM | | Ben-Natan Nimrod | SVP & GM, Broadband Business | Feb 15 '24 | Option Exercise | 0.00 | 39,058 | 0 | 402,214 | Feb 20 09:44 PM | | Graham Ian | SVP, Global Sales & Video Svcs | Feb 15 '24 | Option Exercise | 0.00 | 27,204 | 0 | 157,056 | Feb 20 09:46 PM | | Haltmayer Neven | SVP, Video R&D | Feb 15 '24 | Option Exercise | 0.00 | 34,710 | 0 | 225,472 | Feb 20 09:48 PM |
|
|
|
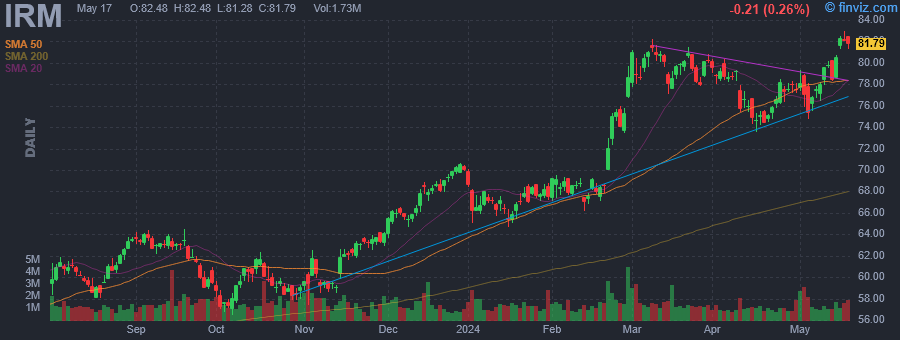 |
| Market Cap | 22.51B | EPS (ttm) | 0.66 |
| P/E | 116.86 | EPS this Y | 6.59% |
| Forward P/E | 36.51 | EPS next Y | 8.43% |
| PEG | 24.86 | EPS past 5Y | -12.68% |
| P/S | 3.99 | EPS next 5Y | 4.70% |
| P/B | 1214.42 | EPS Q/Q | 13.84% |
| Dividend | 3.45% | Sales Q/Q | 12.36% |
| Insider Own | 0.89% | Inst Own | 80.96% |
| Insider Trans | -14.23% | Inst Trans | 1.15% |
| Short Float | 3.39% | Earnings | May 02/b |
| Analyst Recom | 1.78 | Target Price | 80.00 |
| Avg Volume | 1.45M | 52W Range | 52.80 - 82.19 |
|
|
|
|
Iron Mountain, Inc. engages in the provision of storage and information management solutions. It operates through the following business segments: North American Records & Information Management Business, North American Data Management Business, Western European Business, Other International Business, Global Data Center Business and Corporate & Other Business. The North American Records & Information Management Business segment offers record management, destruction, and fulfillment services throughout the U.S. and Canada. The North American Data Management Business segment handles data protection and recovery, server and computer backup services, and safeguarding of electronic and physical media in the U.S. and Canada. The Western European Business segment offers records management, data protection and recovery services, and document management solutions throughout the United Kingdom, Ireland, Austria, Belgium, France, Germany, Netherlands, Spain, and Switzerland. The Other International Business segment offers storage and information management services throughout the remaining European countries, Latin America, the Middle East and Africa. The Global Data Center Business segment provides data center facilities to protect mission-critical assets and ensure the continued operation of its customers IT infrastructures, with secure and reliable colocation and wholesale options. The Corporate & Other Business segment consists of the storage, safeguarding and electronic or physical deliveries of physical media of all types and digital content repository systems to house, distribute, and archive key media assets, primarily for entertainment and media industry clients. The company was founded by Herman Knaust in 1951 and is headquartered in Portsmouth, NH. |
| Insider Trading |
Relationship |
Date |
Transaction |
Cost |
#Shares |
Value ($) |
#Shares Total |
SEC Form 4 |
| MARSON DEBORAH | EVP, General Counsel, Sec. | May 03 '24 | Sale | 77.80 | 2,000 | 155,600 | 63,286 | May 06 04:42 PM | | Murdock Wendy J. | Director | May 03 '24 | Sale | 75.35 | 1,500 | 113,026 | 24,491 | May 06 04:58 PM | | Meaney William L | President and CEO | Apr 16 '24 | Option Exercise | 48.54 | 15,875 | 770,541 | 311,525 | Apr 17 05:01 PM | | Meaney William L | President and CEO | Apr 16 '24 | Sale | 74.69 | 15,875 | 1,185,704 | 295,650 | Apr 17 05:01 PM | | Meaney William L | President and CEO | Apr 15 '24 | Option Exercise | 48.54 | 15,875 | 770,541 | 311,525 | Apr 16 05:14 PM |
|
|
|
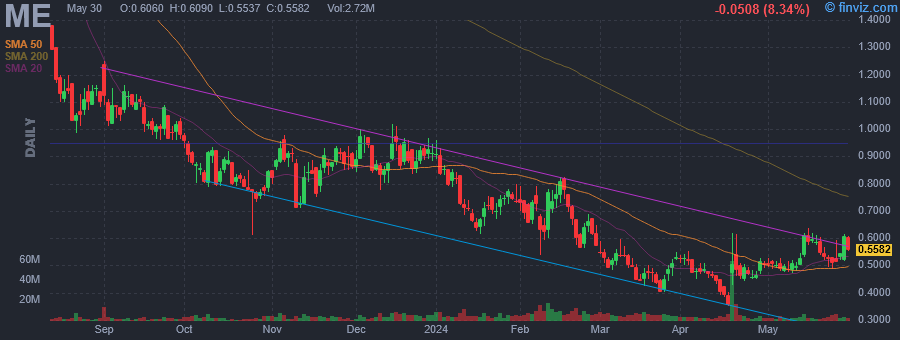 |
| Market Cap | 234.99M | EPS (ttm) | -1.10 |
| P/E | - | EPS this Y | -62.88% |
| Forward P/E | - | EPS next Y | 40.58% |
| PEG | - | EPS past 5Y | -8.86% |
| P/S | 0.95 | EPS next 5Y | - |
| P/B | 0.62 | EPS Q/Q | -185.06% |
| Dividend | - | Sales Q/Q | -33.15% |
| Insider Own | 41.89% | Inst Own | 23.04% |
| Insider Trans | -0.25% | Inst Trans | 7.13% |
| Short Float | 10.48% | Earnings | Feb 07/a |
| Analyst Recom | 2.00 | Target Price | 1.24 |
| Avg Volume | 7.35M | 52W Range | 0.35 - 2.21 |
|
|
|
|
23andMe Holding Co. is a consumer genetics and research company, which engages in assisting people to access, understand, and benefit from the human genome. It operates through the Consumer and Research Services, and Therapeutics segments. The Consumer and Research Services segment consists of Personal Genome Service, Telehealth Business, and Research Services. The Therapeutics segment focuses on the genetic insights of genetic and phenotypic information. The company was founded by Anne E. Wojcickiin 2006 and is headquartered in South San Francisco, CA. |
| Insider Trading |
Relationship |
Date |
Transaction |
Cost |
#Shares |
Value ($) |
#Shares Total |
SEC Form 4 |
| HIBBS KATHY L | Chief Administrative Officer | May 02 '24 | Option Exercise | 0.42 | 38,551 | 16,191 | 1,290,866 | May 06 04:56 PM | | HIBBS KATHY L | Chief Administrative Officer | May 02 '24 | Sale | 0.49 | 38,551 | 19,048 | 1,252,315 | May 06 04:56 PM | | HIBBS KATHY L | Chief Administrative Officer | Apr 18 '24 | Option Exercise | 0.42 | 38,548 | 16,190 | 1,290,863 | Apr 19 04:20 PM | | HIBBS KATHY L | Chief Administrative Officer | Apr 18 '24 | Sale | 0.47 | 38,548 | 18,148 | 1,252,315 | Apr 19 04:20 PM | | HIBBS KATHY L | Chief Administrative Officer | Apr 04 '24 | Option Exercise | 0.42 | 38,548 | 16,190 | 1,290,863 | Apr 05 04:14 PM |
|
|
|
