 |
| Market Cap | 30.04B | EPS (ttm) | -0.55 |
| P/E | - | EPS this Y | 19.22% |
| Forward P/E | 119.44 | EPS next Y | 27.51% |
| PEG | - | EPS past 5Y | -13.56% |
| P/S | 23.17 | EPS next 5Y | - |
| P/B | 39.36 | EPS Q/Q | 40.77% |
| Dividend | - | Sales Q/Q | 31.95% |
| Insider Own | 13.37% | Inst Own | 74.69% |
| Insider Trans | -5.90% | Inst Trans | -0.16% |
| Short Float | 3.80% | Earnings | May 02/a |
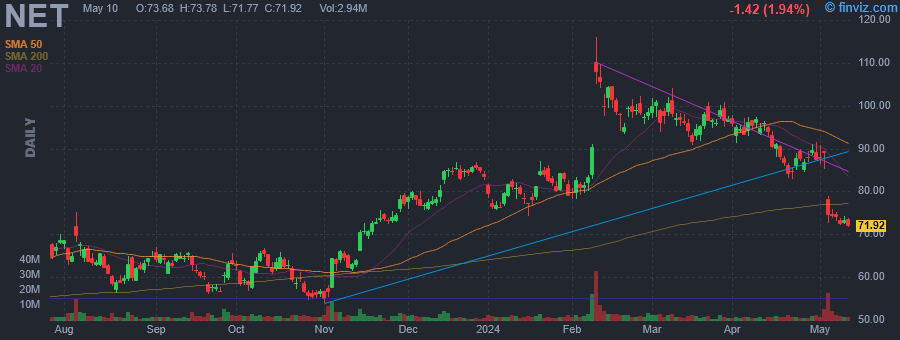
| Analyst Recom | 2.47 | Target Price | 101.35 |
| Avg Volume | 4.00M | 52W Range | 39.90 - 116.00 |
|
|
|
|
Cloudflare, Inc. engages in the provision of cloud-based services to secure websites. It offers various products for performance and reliability, video streaming and delivery, advanced security, insights, Cloudflare for developers, domain registration and Cloudflare marketplace. It operates through United States and Rest of the World geographical segments. The company was founded by Matthew Prince, Michelle Zatlyn and Lee Holloway in July 2009 and is headquartered in San Francisco, CA. |
| Insider Trading |
Relationship |
Date |
Transaction |
Cost |
#Shares |
Value ($) |
#Shares Total |
SEC Form 4 |
| Ledbetter Carl | Director | May 01 '24 | Sale | 87.49 | 8,022 | 701,860 | 1,196,793 | May 02 04:51 PM | | Eitel Maria S | Director | May 01 '24 | Sale | 88.12 | 6,875 | 605,825 | 16,638 | May 02 04:48 PM | | Ledbetter Carl | Director | Apr 24 '24 | Sale | 89.16 | 10,015 | 892,960 | 1,204,815 | Apr 25 04:49 PM | | Zatlyn Michelle | President and COO | Apr 18 '24 | Sale | 87.07 | 18,955 | 1,650,463 | 19,615 | Apr 18 08:14 PM | | SEIFERT THOMAS J | CHIEF FINANCIAL OFFICER | Apr 18 '24 | Sale | 87.02 | 15,000 | 1,305,249 | 338,469 | Apr 19 05:18 PM |
|
|
 |
 |
| Market Cap | 18.30B | EPS (ttm) | 3.26 |
| P/E | 18.77 | EPS this Y | 7.21% |
| Forward P/E | 17.03 | EPS next Y | 7.94% |
| PEG | 2.41 | EPS past 5Y | 5.32% |
| P/S | 2.49 | EPS next 5Y | 7.80% |
| P/B | 2.37 | EPS Q/Q | 38.24% |
| Dividend | 3.38% | Sales Q/Q | -4.73% |
| Insider Own | 0.59% | Inst Own | 95.29% |
| Insider Trans | -1.70% | Inst Trans | -1.57% |
| Short Float | 3.88% | Earnings | Apr 25/b |
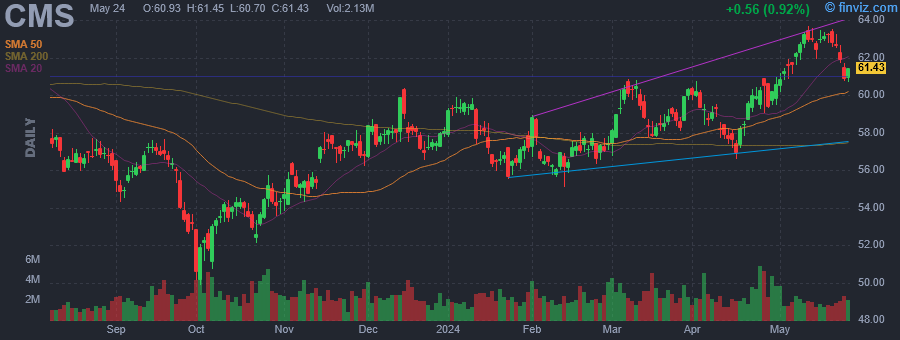
| Analyst Recom | 1.95 | Target Price | 63.87 |
| Avg Volume | 2.66M | 52W Range | 49.87 - 63.76 |
|
|
|
|
CMS Energy Corp. engages in the provision of electric and natural gas activities. It operates through the following business segments: Electric Utility, Gas Utility, and NorthStar Clean Energy. The Electric Utility segment focuses on generation, purchase, distribution, and sale of electricity. The Gas Utility segment includes purchase, transmission, storage, distribution, and sale of natural gas. The NorthStar Clean Energy segment is involved in domestic independent power production including the development and operation of renewable generation and the marketing of independent power production. The company was founded in 1987 and is headquartered in Jackson, MI. |
| Insider Trading |
Relationship |
Date |
Transaction |
Cost |
#Shares |
Value ($) |
#Shares Total |
SEC Form 4 |
| Rich Brian F | Senior Vice President | May 02 '24 | Sale | 61.10 | 2,000 | 122,207 | 97,682 | May 02 04:46 PM | | Hofmeister Brandon J. | Senior Vice President | Feb 23 '24 | Sale | 57.78 | 3,500 | 202,240 | 68,971 | Feb 26 09:59 AM | | Hofmeister Brandon J. | Senior Vice President | Dec 07 '23 | Sale | 57.90 | 1,000 | 57,900 | 61,156 | Dec 11 02:59 PM | | Rich Brian F | Senior Vice President | Nov 08 '23 | Sale | 54.90 | 5,000 | 274,500 | 88,175 | Nov 09 07:29 AM | | RUSSELL JOHN G | Director | Nov 02 '23 | Sale | 55.53 | 19,000 | 1,054,993 | 169,899 | Nov 03 11:00 AM |
|
|
|
 |
| Market Cap | 105.88B | EPS (ttm) | 1.20 |
| P/E | 60.18 | EPS this Y | 13.39% |
| Forward P/E | 27.32 | EPS next Y | 13.44% |
| PEG | 4.85 | EPS past 5Y | -2.05% |
| P/S | 7.20 | EPS next 5Y | 12.40% |
| P/B | 5.31 | EPS Q/Q | 61.01% |
| Dividend | - | Sales Q/Q | 13.78% |
| Insider Own | 0.44% | Inst Own | 93.86% |
| Insider Trans | -5.85% | Inst Trans | 0.92% |
| Short Float | 0.90% | Earnings | Apr 24/b |
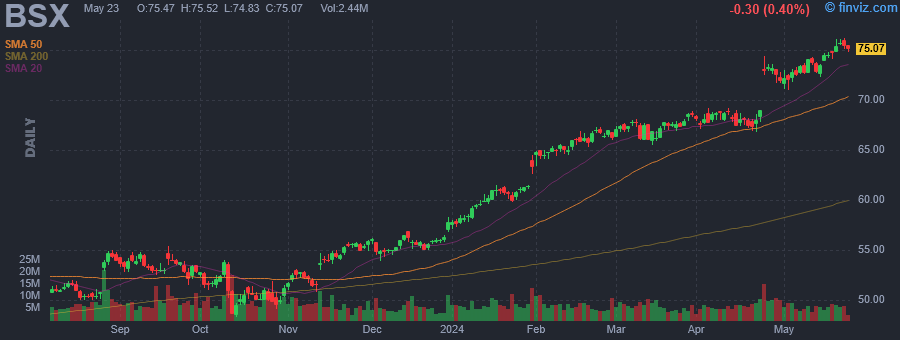
| Analyst Recom | 1.41 | Target Price | 81.46 |
| Avg Volume | 6.45M | 52W Range | 48.35 - 74.39 |
|
|
|
|
Boston Scientific Corp. engages in the development, manufacture, and marketing of medical devices that are used in interventional medical procedures. It operates through the MedSurg and Cardiovascular segments. The MedSurg segment includes Endoscopy, Urology, and Neuromodulation. The Cardiovascular segment consists of Cardiology and Peripheral Interventions. The company was founded by John E. Abele and Pete Michael Nicholas on June 29, 1979 and is headquartered in Marlborough, MA. |
| Insider Trading |
Relationship |
Date |
Transaction |
Cost |
#Shares |
Value ($) |
#Shares Total |
SEC Form 4 |
| Sorenson John Bradley | EVP, Global Operations | May 01 '24 | Option Exercise | 17.26 | 17,587 | 303,552 | 68,225 | May 02 04:46 PM | | Carruthers Wendy | EVP, Human Resources | May 01 '24 | Option Exercise | 19.31 | 4,263 | 82,306 | 55,331 | May 02 04:42 PM | | Sorenson John Bradley | EVP, Global Operations | May 01 '24 | Sale | 71.50 | 17,587 | 1,257,488 | 50,638 | May 02 04:46 PM | | Carruthers Wendy | EVP, Human Resources | May 01 '24 | Sale | 71.47 | 6,983 | 499,075 | 48,348 | May 02 04:42 PM | | LUDWIG EDWARD J | Director | Apr 26 '24 | Option Exercise | 17.37 | 9,818 | 170,539 | 51,192 | Apr 29 04:12 PM |
|
|
| |
 |
| Market Cap | 242.53M | EPS (ttm) | -0.63 |
| P/E | - | EPS this Y | 65.08% |
| Forward P/E | 22.86 | EPS next Y | 163.64% |
| PEG | - | EPS past 5Y | -16.63% |
| P/S | 0.31 | EPS next 5Y | - |
| P/B | - | EPS Q/Q | - |
| Dividend | - | Sales Q/Q | 11.17% |
| Insider Own | 76.74% | Inst Own | 4.70% |
| Insider Trans | -0.11% | Inst Trans | -5.11% |
| Short Float | 0.77% | Earnings | May 09/b |
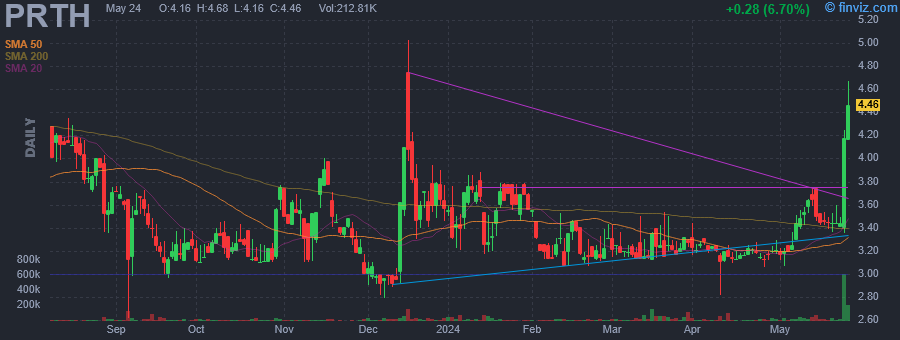
| Analyst Recom | 1.50 | Target Price | 7.62 |
| Avg Volume | 29.26K | 52W Range | 2.62 - 5.03 |
|
|
|
|
Priority Technology Holdings, Inc. engages in the provision of merchant acquiring and commercial payments solutions with a platform of micro services that activate and monetize vertically specialized merchant networks. It operates through the following segments: SMB Acquiring Solutions, B2B Payables, and Enterprise Payments and BaaS. The SMB Acquiring Solutions segment offers full-service acquiring and payment-enabled solutions for B2C transactions, leveraging Priority's proprietary software platform, distributed through ISO, direct sales, and vertically focused ISV channels. The B2B Payables segment refers to market AP automation solutions to corporations, software partners, and industry FIs. The Enterprise Payments and BaaS segment focuses on embedded finance and BaaS solutions to customers to modernize legacy platforms and accelerate software partners' strategies to monetize payments. The company was founded by John V. Priore on April 23, 2015 and is headquartered in Alpharetta, GA. |
| Insider Trading |
Relationship |
Date |
Transaction |
Cost |
#Shares |
Value ($) |
#Shares Total |
SEC Form 4 |
| Kiewiet Sean | Chief Strategy Officer | May 02 '24 | Sale | 3.20 | 8,695 | 27,824 | 1,341,853 | May 02 04:44 PM | | Kiewiet Sean | Chief Strategy Officer | May 01 '24 | Sale | 3.18 | 1,305 | 4,150 | 1,350,548 | May 02 04:44 PM | | Ram Ranjana | Head of M&A Strategic Initiati | Apr 19 '24 | Option Exercise | 0.00 | 83,333 | 0 | 380,769 | Apr 24 02:30 PM | | Kiewiet Sean | Chief Strategy Officer | Apr 01 '24 | Sale | 3.30 | 10,000 | 33,000 | 1,351,853 | Apr 02 09:41 AM | | Kiewiet Sean | Chief Strategy Officer | Mar 05 '24 | Sale | 3.20 | 2,063 | 6,602 | 1,361,853 | Mar 05 05:16 PM |
|
|
|
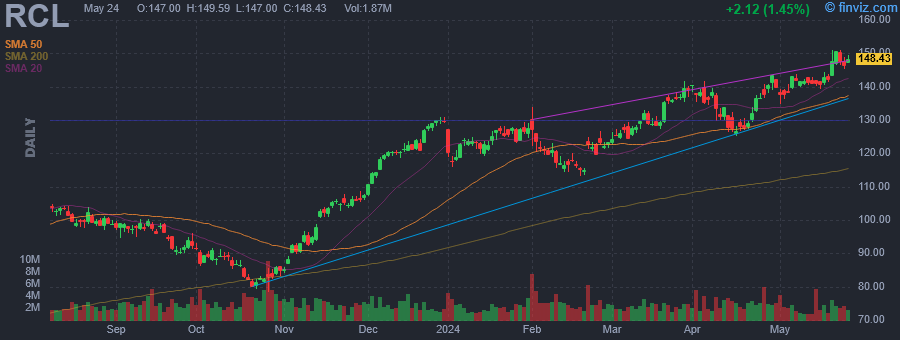 |
| Market Cap | 35.35B | EPS (ttm) | 7.63 |
| P/E | 18.01 | EPS this Y | 60.13% |
| Forward P/E | 10.97 | EPS next Y | 15.52% |
| PEG | 0.65 | EPS past 5Y | -6.87% |
| P/S | 2.40 | EPS next 5Y | 27.50% |
| P/B | 6.86 | EPS Q/Q | 783.25% |
| Dividend | - | Sales Q/Q | 29.21% |
| Insider Own | 8.14% | Inst Own | 80.69% |
| Insider Trans | -5.01% | Inst Trans | 1.72% |
| Short Float | 6.37% | Earnings | Apr 25/b |
| Analyst Recom | 1.54 | Target Price | 158.53 |
| Avg Volume | 2.87M | 52W Range | 66.01 - 143.62 |
|
|
|
|
Royal Caribbean Group is a cruise company, which engages in the ownership and operation of the following global cruise brands: Royal Caribbean International, Celebrity Cruises, and Silversea Cruises. The firm also holds interest in TUI Cruises GmbH, which operates the German brands TUI Cruises and Hapag-Lloyd Cruises. The company was founded by Arne Wilhelmsen in 1968 and is headquartered in Miami, FL. |
| Insider Trading |
Relationship |
Date |
Transaction |
Cost |
#Shares |
Value ($) |
#Shares Total |
SEC Form 4 |
| Pujol Henry L | Chief Accounting Officer | Apr 30 '24 | Sale | 141.23 | 9,944 | 1,404,391 | 16,687 | May 02 04:39 PM | | Liberty Jason T | President & CEO | Apr 26 '24 | Sale | 139.63 | 50,000 | 6,981,335 | 153,017 | Apr 26 06:19 PM | | Bayley Michael W | Pres&CEO, Royal Caribbean Intl | Feb 13 '24 | Sale | 116.01 | 11,753 | 1,363,486 | 166,537 | Feb 15 04:48 PM | | Wilhelmsen Arne Alexander | Director | Dec 14 '23 | Sale | 121.73 | 284,766 | 34,664,565 | 19,167,507 | Dec 14 06:02 PM | | Wilhelmsen Arne Alexander | Director | Dec 13 '23 | Sale | 119.98 | 400,000 | 47,992,000 | 19,452,273 | Dec 14 06:02 PM |
|
|
| |
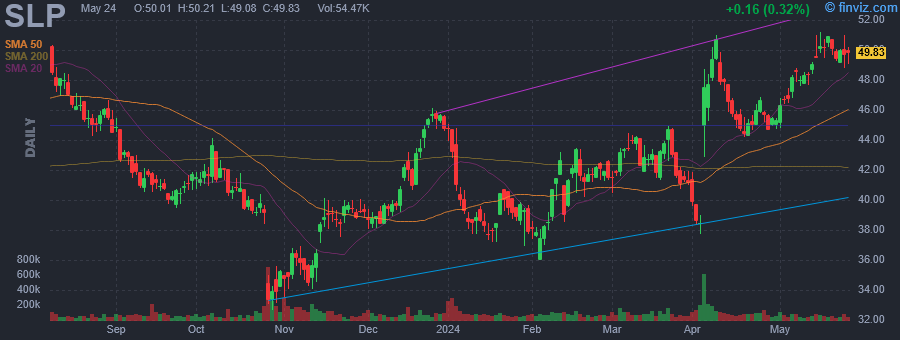 |
| Market Cap | 933.47M | EPS (ttm) | 0.52 |
| P/E | 90.21 | EPS this Y | 34.01% |
| Forward P/E | 58.04 | EPS next Y | 22.59% |
| PEG | 6.01 | EPS past 5Y | -0.55% |
| P/S | 14.43 | EPS next 5Y | 15.00% |
| P/B | 5.27 | EPS Q/Q | -2.46% |
| Dividend | 0.51% | Sales Q/Q | 16.22% |
| Insider Own | 18.88% | Inst Own | 78.78% |
| Insider Trans | -5.69% | Inst Trans | 3.69% |
| Short Float | 7.32% | Earnings | Apr 03/a |
| Analyst Recom | 1.00 | Target Price | 53.67 |
| Avg Volume | 109.91K | 52W Range | 32.69 - 52.69 |
|
|
|
|
Simulations Plus, Inc. provides modeling and simulation software and consulting services supporting drug discovery, development research and regulatory submissions. The firm operates through the Software and Services segment. It designs and develops pharmaceutical simulation software to promote cost-effective solutions to a number of problems in pharmaceutical research and in the education of pharmacy and medical students. The company was founded by Walter S. Woltosz and Virginia E. Woltosz on July 17, 1996 and is headquartered in Lancaster, CA. |
| Insider Trading |
Relationship |
Date |
Transaction |
Cost |
#Shares |
Value ($) |
#Shares Total |
SEC Form 4 |
| WOLTOSZ WALTER S | Director | May 01 '24 | Sale | 45.95 | 20,000 | 918,984 | 3,580,857 | May 02 04:37 PM | | WOLTOSZ WALTER S | Director | Apr 01 '24 | Sale | 39.94 | 20,000 | 798,867 | 3,600,195 | Apr 02 04:32 PM | | WOLTOSZ WALTER S | Director | Mar 01 '24 | Sale | 41.41 | 20,000 | 828,240 | 3,620,195 | Mar 05 04:22 PM | | WOLTOSZ WALTER S | Director | Feb 02 '24 | Sale | 37.64 | 1,055 | 39,710 | 3,640,195 | Feb 05 05:04 PM | | WOLTOSZ WALTER S | Director | Feb 01 '24 | Sale | 38.02 | 18,945 | 720,237 | 3,641,250 | Feb 05 05:04 PM |
|
|
|
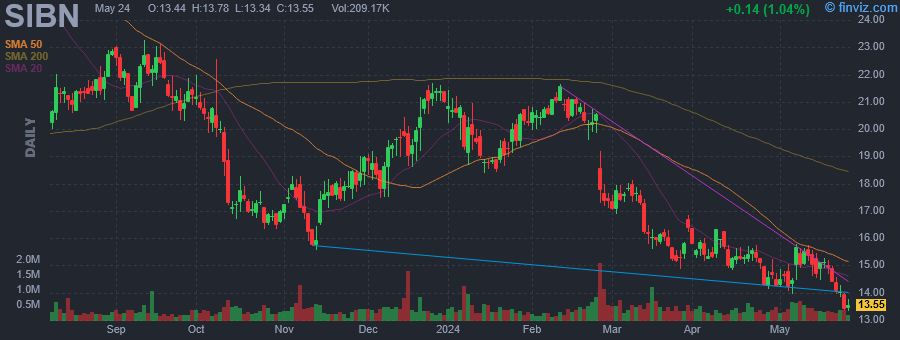 |
| Market Cap | 601.93M | EPS (ttm) | -1.13 |
| P/E | - | EPS this Y | 12.54% |
| Forward P/E | - | EPS next Y | 22.60% |
| PEG | - | EPS past 5Y | 12.47% |
| P/S | 4.33 | EPS next 5Y | 8.90% |
| P/B | 3.51 | EPS Q/Q | 16.22% |
| Dividend | - | Sales Q/Q | 21.61% |
| Insider Own | 9.89% | Inst Own | 88.17% |
| Insider Trans | -2.47% | Inst Trans | -0.55% |
| Short Float | 6.99% | Earnings | May 06/a |
| Analyst Recom | 1.00 | Target Price | 26.22 |
| Avg Volume | 433.10K | 52W Range | 14.12 - 29.51 |
|
|
|
|
SI-BONE, Inc. is a medical device company, which engages in the provision of a proprietary minimally invasive surgical implant system to fuse the sacroiliac joint for treatment of musculoskeletal disorders of the sacropelvic anatomy. It offers a proprietary minimally invasive surgical implant system, called iFuse, used to fuse the sacroiliac joint to treat sacroiliac joint dysfunction that often causes severe lower back pain. The company was founded by Mark A. Reiley and Jeffrey W. Dunn on March 18, 2008 and is headquartered in Santa Clara, CA. |
| Insider Trading |
Relationship |
Date |
Transaction |
Cost |
#Shares |
Value ($) |
#Shares Total |
SEC Form 4 |
| DUNN JEFFREY W | Director | May 02 '24 | Sale | 14.54 | 343 | 4,986 | 23,566 | May 02 04:32 PM | | RECUPERO ANTHONY J | President, Commercial Ops | Apr 03 '24 | Sale | 15.63 | 920 | 14,379 | 251,533 | Apr 04 07:59 PM | | RECUPERO ANTHONY J | President, Commercial Ops | Apr 02 '24 | Sale | 15.50 | 3,307 | 51,272 | 252,453 | Apr 04 07:59 PM | | Maheshwari Anshul | Chief Financial Officer | Apr 02 '24 | Sale | 15.45 | 2,425 | 37,474 | 205,516 | Apr 04 07:59 PM | | RECUPERO ANTHONY J | President, Commercial Ops | Mar 13 '24 | Sale | 16.82 | 3,330 | 56,023 | 255,760 | Mar 14 05:46 PM |
|
|
| |
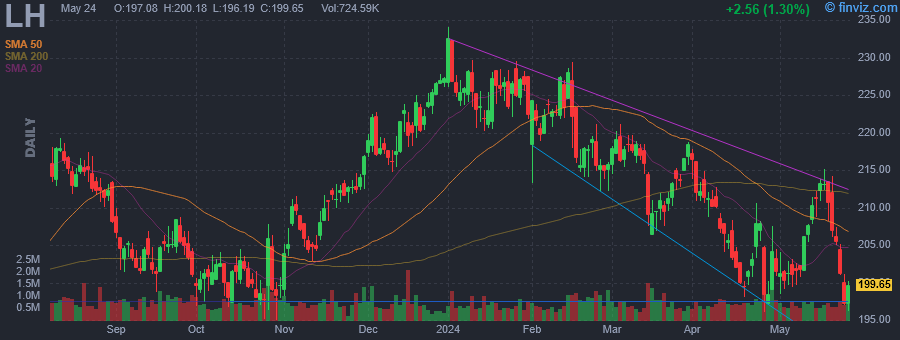 |
| Market Cap | 16.84B | EPS (ttm) | 4.95 |
| P/E | 40.43 | EPS this Y | 9.40% |
| Forward P/E | 12.54 | EPS next Y | 7.63% |
| PEG | 5.19 | EPS past 5Y | -11.14% |
| P/S | 1.37 | EPS next 5Y | 7.79% |
| P/B | 2.12 | EPS Q/Q | 12.53% |
| Dividend | 1.26% | Sales Q/Q | -15.92% |
| Insider Own | 0.39% | Inst Own | 98.56% |
| Insider Trans | -15.21% | Inst Trans | -2.81% |
| Short Float | 2.70% | Earnings | Apr 25/b |
| Analyst Recom | 1.75 | Target Price | 241.38 |
| Avg Volume | 796.56K | 52W Range | 179.58 - 234.09 |
|
|
|
|
Laboratory Corp. of America Holdings operates as a life sciences company, which engages in the provision of vital information to help health professionals make clear and confident decisions. It operates through the Drug Development and Diagnostics segments. The Drug Development segment consists of lead optimization, preclinical safety assessment, analytical services, clinical trials, central laboratories, biomarkers, and companion diagnostics, market access, and technology solutions. The Diagnostics segment includes primary care, women's health, specialty medicine, oncology, ACOs, and hospitals and health systems. The company was founded in 1971 and is headquartered in Burlington, NC. |
| Insider Trading |
Relationship |
Date |
Transaction |
Cost |
#Shares |
Value ($) |
#Shares Total |
SEC Form 4 |
| ANDERSON KERRII B | Director | May 02 '24 | Sale | 200.10 | 250 | 50,025 | 15,722 | May 02 04:29 PM | | ANDERSON KERRII B | Director | Apr 30 '24 | Sale | 204.13 | 250 | 51,034 | 15,972 | May 02 04:29 PM | | Wilkinson Peter J | SVP, Chief Accounting Officer | Apr 29 '24 | Sale | 204.33 | 2,439 | 498,358 | 2,087 | May 01 06:29 PM | | Schroeder Mark S | EVP, Pres Diagnostics & COO | Apr 01 '24 | Sale | 217.29 | 6,477 | 1,407,387 | 5,036 | Apr 03 08:35 AM | | Summy Amy B. | EVP, Chief Marketing Officer | Apr 01 '24 | Sale | 217.29 | 3,500 | 760,515 | 3,975 | Apr 03 08:34 AM |
|
|
|
 |
| Market Cap | 4.02B | EPS (ttm) | 1.31 |
| P/E | 39.39 | EPS this Y | 54.03% |
| Forward P/E | 30.42 | EPS next Y | 51.31% |
| PEG | 1.97 | EPS past 5Y | -5.30% |
| P/S | 6.04 | EPS next 5Y | 20.00% |
| P/B | 4.41 | EPS Q/Q | 1509.20% |
| Dividend | - | Sales Q/Q | 0.76% |
| Insider Own | 1.03% | Inst Own | 99.27% |
| Insider Trans | -9.64% | Inst Trans | -0.98% |
| Short Float | 3.26% | Earnings | May 01/a |
| Analyst Recom | 2.20 | Target Price | 51.66 |
| Avg Volume | 481.07K | 52W Range | 24.88 - 47.94 |
|
|
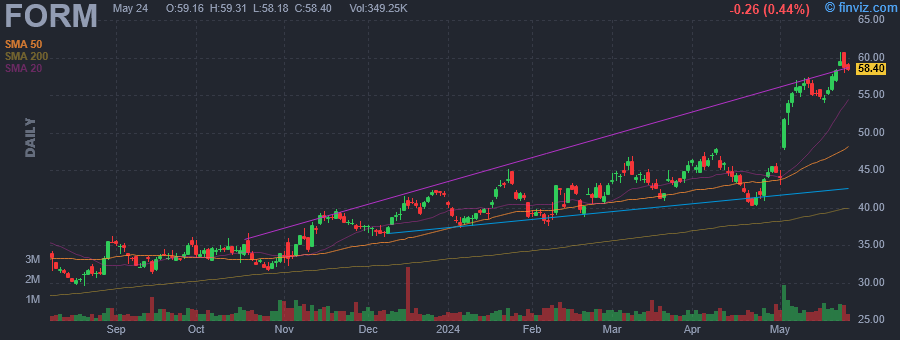
| Today | Reiterated |
TD Cowen |
Hold |
$37 → $48 |
|
|
|
FormFactor, Inc. engages in the provision of test and measurement solutions. It operates through the following business segments: Probe Cards and Systems. The Probe Cards segment consists of technologies and product architectures, including micro-electromechanical systems technologies. The Systems segment consists of analytical probe solutions for on-wafer probing, board tests, and package tests. The company was founded by Igor Khandros on April 15, 1993 and is headquartered in Livermore, CA. |
| Insider Trading |
Relationship |
Date |
Transaction |
Cost |
#Shares |
Value ($) |
#Shares Total |
SEC Form 4 |
| SLESSOR MIKE | CEO | May 01 '24 | Sale | 43.75 | 4,000 | 174,982 | 491,781 | May 02 04:28 PM | | SLESSOR MIKE | CEO | Apr 01 '24 | Sale | 45.94 | 4,000 | 183,755 | 495,781 | Apr 02 04:45 PM | | Shahar Shai | CFO, SVP Global Finance | Mar 04 '24 | Sale | 44.51 | 10,000 | 445,122 | 27,591 | Mar 05 08:42 PM | | SLESSOR MIKE | CEO | Mar 01 '24 | Sale | 43.38 | 4,000 | 173,518 | 499,781 | Mar 04 05:53 PM | | Shahar Shai | CFO, SVP Global Finance | Feb 12 '24 | Sale | 42.12 | 10,000 | 421,246 | 67,141 | Feb 13 05:12 PM |
|
|
|
 |
| Market Cap | 49.09B | EPS (ttm) | 13.46 |
| P/E | 15.93 | EPS this Y | 38.49% |
| Forward P/E | 10.25 | EPS next Y | 15.04% |
| PEG | 1.00 | EPS past 5Y | 6.62% |
| P/S | 1.14 | EPS next 5Y | 15.95% |
| P/B | 1.96 | EPS Q/Q | 16.38% |
| Dividend | 1.94% | Sales Q/Q | 15.70% |
| Insider Own | 0.43% | Inst Own | 84.00% |
| Insider Trans | -23.97% | Inst Trans | -0.71% |
| Short Float | 1.46% | Earnings | Apr 17/b |
| Analyst Recom | 2.48 | Target Price | 229.28 |
| Avg Volume | 1.43M | 52W Range | 157.33 - 232.75 |
|
|
|
|
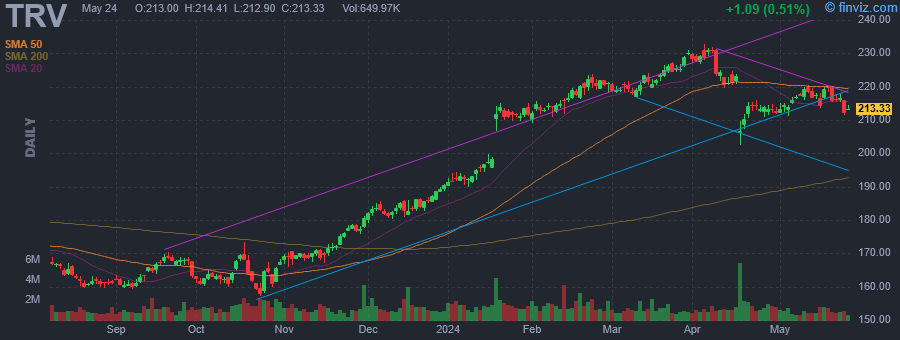
The Travelers Cos., Inc. is a holding company, which engages in the provision of commercial and personal property and casualty insurance products and services. It operates through the following business segments: Business Insurance, Bond and Specialty Insurance, and Personal Insurance. The Business Insurance segment offers an array of property and casualty insurance, and insurance related services to its customers primarily in the U.S., as well as in Canada, the United Kingdom, the Republic of Ireland and throughout other parts of the world as a corporate member of Lloyd's. The Bond and Specialty Insurance segment includes surety, fidelity, management liability, professional liability, and other property and casualty coverage and related risk management services. The Personal Insurance segment is involved in a range of property and casualty insurance products and services covering individuals' personal risks, primarily in the U.S. and Canada. The company was founded in 1853 and is headquartered in New York, NY. |
| Insider Trading |
Relationship |
Date |
Transaction |
Cost |
#Shares |
Value ($) |
#Shares Total |
SEC Form 4 |
| Klenk Jeffrey P. | EVP & Pres., Bond & Spec. Ins. | May 01 '24 | Sale | 213.68 | 3,635 | 776,727 | 6,075 | May 02 04:25 PM | | Frey Daniel S. | EVP & Chief Financial Officer | Apr 25 '24 | Sale | 212.90 | 5,000 | 1,064,482 | 18,515 | Apr 26 04:04 PM | | Klein Michael Frederick | EVP & President, Personal Ins. | Apr 23 '24 | Option Exercise | 126.18 | 10,000 | 1,261,800 | 32,798 | Apr 24 04:02 PM | | Klein Michael Frederick | EVP & President, Personal Ins. | Apr 23 '24 | Sale | 213.96 | 10,000 | 2,139,618 | 22,798 | Apr 24 04:02 PM | | Yin Daniel Tei-Hwa | EVP & Co-Chief Invest. Officer | Feb 29 '24 | Option Exercise | 106.03 | 9,502 | 1,007,497 | 68,319 | Mar 01 04:04 PM |
|
|
|
