 |
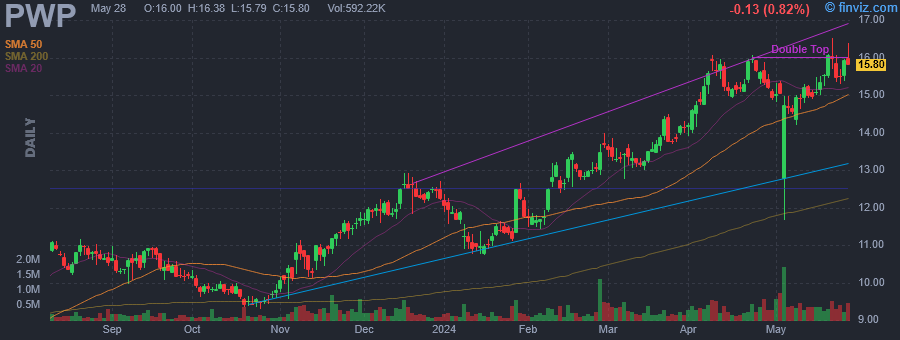
| Market Cap | 658.43M | EPS (ttm) | -1.86 |
| P/E | - | EPS this Y | 81.11% |
| Forward P/E | 11.94 | EPS next Y | 51.23% |
| PEG | - | EPS past 5Y | - |
| P/S | 1.06 | EPS next 5Y | - |
| P/B | 4.85 | EPS Q/Q | -145.68% |
| Dividend | 1.99% | Sales Q/Q | -22.29% |
| Insider Own | 12.95% | Inst Own | 89.16% |
| Insider Trans | -0.13% | Inst Trans | -1.44% |
| Short Float | 1.48% | Earnings | May 03/b |
| Analyst Recom | 2.00 | Target Price | 17.88 |
| Avg Volume | 379.94K | 52W Range | 6.80 - 16.07 |
|
|
|
|
Perella Weinberg Partners operates as an advisory firm, which engages in the provision of strategic and financial advisory services. It serves the large public multinational corporations, mid-sized public and private companies, individual entrepreneurs, private and institutional investors, creditor committees, and government institutions. The company was founded in June 2006 and is headquartered in New York, NY. |
| Insider Trading |
Relationship |
Date |
Transaction |
Cost |
#Shares |
Value ($) |
#Shares Total |
SEC Form 4 |
| Shendelman Vladimir | General Counsel | Dec 14 '23 | Sale | 12.46 | 7,722 | 96,216 | 67,341 | Dec 15 07:19 PM | | Weinberg Peter A | Chairman | Dec 01 '23 | Option Exercise | 0.00 | 842,622 | 0 | 842,622 | Dec 04 06:18 PM |
|
|
 |
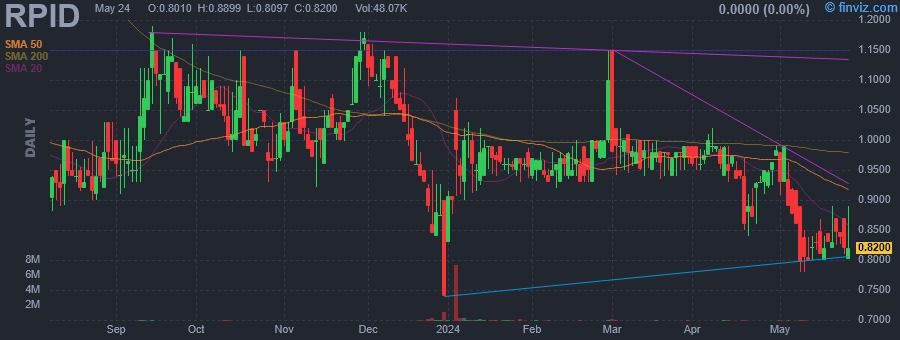 |
| Market Cap | 38.08M | EPS (ttm) | -1.20 |
| P/E | - | EPS this Y | 10.11% |
| Forward P/E | - | EPS next Y | 4.86% |
| PEG | - | EPS past 5Y | -16.10% |
| P/S | 1.65 | EPS next 5Y | - |
| P/B | 0.36 | EPS Q/Q | 5.06% |
| Dividend | - | Sales Q/Q | 11.44% |
| Insider Own | 35.72% | Inst Own | 23.73% |
| Insider Trans | 0.00% | Inst Trans | -7.06% |
| Short Float | 0.22% | Earnings | May 03/b |
| Analyst Recom | 1.67 | Target Price | 4.75 |
| Avg Volume | 40.74K | 52W Range | 0.74 - 1.19 |
|
|
|
|
Rapid Micro Biosystems, Inc. is a life sciences technology company. It provides automated solutions to facilitate the efficient manufacturing and safe release of healthcare products such as biologics, vaccines, cell & gene therapies, and sterile injectable. The company was founded by Donald Straus on December 29, 2006 and is headquartered in Lowell, MA. |
| Insider Trading |
Relationship |
Date |
Transaction |
Cost |
#Shares |
Value ($) |
#Shares Total |
SEC Form 4 |
| WIRTJES SEAN M | CHIEF FINANCIAL OFFICER | Sep 06 '23 | Buy | 0.99 | 10,000 | 9,894 | 285,651 | Sep 08 07:36 AM | | Spignesi Robert G. Jr. | PRESIDENT AND CEO | Aug 15 '23 | Buy | 0.97 | 20,000 | 19,488 | 375,512 | Aug 16 07:13 PM | | Spignesi Robert G. Jr. | PRESIDENT AND CEO | Aug 08 '23 | Buy | 0.92 | 34,000 | 31,447 | 355,512 | Aug 10 04:15 PM | | Spignesi Robert G. Jr. | PRESIDENT AND CEO | May 17 '23 | Buy | 0.91 | 20,000 | 18,204 | 321,512 | May 18 04:12 PM |
|
|
|
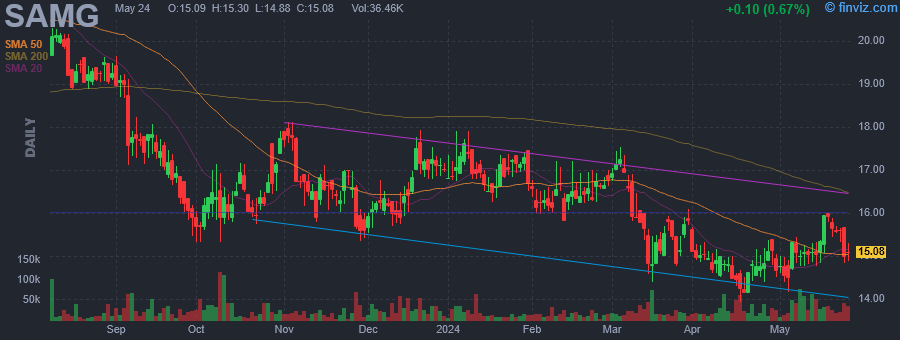 |
| Market Cap | 137.22M | EPS (ttm) | 0.94 |
| P/E | 15.40 | EPS this Y | 39.29% |
| Forward P/E | 8.62 | EPS next Y | 7.69% |
| PEG | 1.75 | EPS past 5Y | -3.63% |
| P/S | 1.16 | EPS next 5Y | 8.80% |
| P/B | 1.64 | EPS Q/Q | -5.74% |
| Dividend | 5.32% | Sales Q/Q | 2.85% |
| Insider Own | 0.88% | Inst Own | 72.78% |
| Insider Trans | 10.97% | Inst Trans | -0.63% |
| Short Float | 0.41% | Earnings | May 03/b |
| Analyst Recom | 1.00 | Target Price | 23.17 |
| Avg Volume | 23.13K | 52W Range | 13.93 - 23.20 |
|
|
|
|
Silvercrest Asset Management Group, Inc. operates as a wealth management firm. The firm provides traditional and alternative investment advisory and family office services to wealthy families and select institutional investors. It also offers portfolio, equity, and fixed income management and outsourced investment services. The company was founded in April 2002 and is headquartered in New York, NY. |
| Insider Trading |
Relationship |
Date |
Transaction |
Cost |
#Shares |
Value ($) |
#Shares Total |
SEC Form 4 |
| HOUGH RICHARD R III | Chairman and CEO | Apr 30 '24 | Option Exercise | 14.54 | 60,742 | 883,189 | 668,910 | May 02 05:55 PM | | Long Path Smaller Companies Fu | 10% Owner | Apr 30 '24 | Buy | 15.05 | 5,112 | 76,936 | 940,798 | May 02 07:27 PM | | Gray John Allen | Managing Director | Mar 13 '24 | Buy | 15.84 | 3,135 | 49,658 | 21,110 | Mar 14 04:30 PM | | HOUGH RICHARD R III | Chairman and CEO | Sep 13 '23 | Option Exercise | 13.97 | 105,398 | 1,472,410 | 691,496 | Sep 15 08:47 PM |
|
|
| |
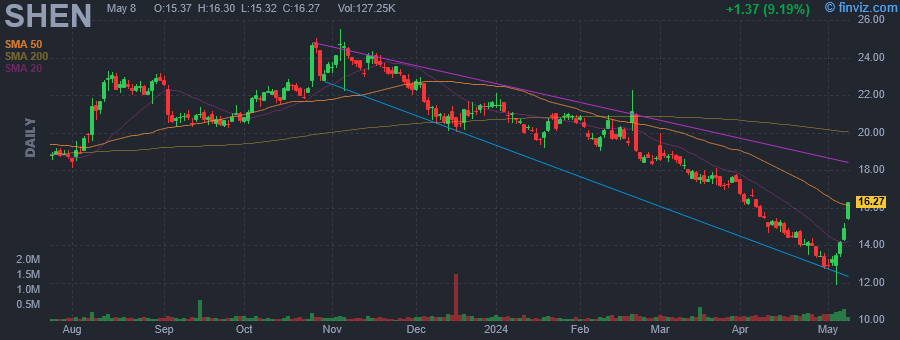 |
| Market Cap | 734.79M | EPS (ttm) | 0.08 |
| P/E | 177.94 | EPS this Y | -133.75% |
| Forward P/E | - | EPS next Y | -103.70% |
| PEG | 7.29 | EPS past 5Y | -29.82% |
| P/S | 2.58 | EPS next 5Y | 24.40% |
| P/B | 0.78 | EPS Q/Q | -202.20% |
| Dividend | 0.74% | Sales Q/Q | -3.40% |
| Insider Own | 15.78% | Inst Own | 53.15% |
| Insider Trans | 0.00% | Inst Trans | -1.03% |
| Short Float | 1.92% | Earnings | May 03/b |
| Analyst Recom | 2.50 | Target Price | 26.00 |
| Avg Volume | 161.71K | 52W Range | 12.74 - 25.51 |
|
|
|
|
Shenandoah Telecommunications Co. is a holding company, which engages in the provision of regulated and unregulated telecommunication services to end-user customers and other telecommunications providers. It offers voice, video and data communications services. It operates through the Broadband and Tower segments. The Broadband segment provides broadband, video, and voice services to residential and commercial customers in portions of Virginia, West Virginia, Maryland, and Kentucky, via fiber optic and hybrid fiber coaxial ("HFC") cable. The Tower segment leases space on 225 owned cell towers. The company was founded in 1902 and is headquartered in Edinburg, VA. |
|
|
 |
| Market Cap | 354.49M | EPS (ttm) | 7.81 |
| P/E | 4.35 | EPS this Y | - |
| Forward P/E | - | EPS next Y | - |
| PEG | - | EPS past 5Y | - |
| P/S | 0.76 | EPS next 5Y | - |
| P/B | 0.57 | EPS Q/Q | 766.61% |
| Dividend | - | Sales Q/Q | 5.66% |
| Insider Own | 13.54% | Inst Own | 45.02% |
| Insider Trans | -0.75% | Inst Trans | -2.68% |
| Short Float | 0.47% | Earnings | May 03/b |
| Analyst Recom | 3.00 | Target Price | 22.00 |
| Avg Volume | 54.98K | 52W Range | 13.00 - 29.54 |
|
|
|
|
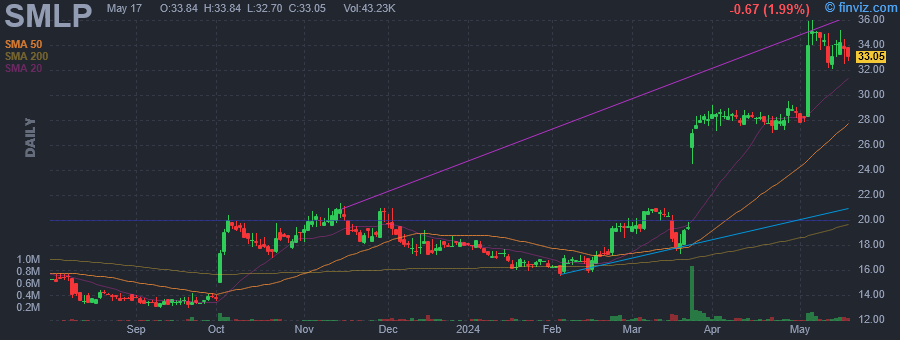
Summit Midstream Partners LP develops, owns, and operates midstream energy infrastructure assets strategically located in unconventional resource basins, mainly shale formations. It operates through the following segments: Northeast, Rockies, Permian, Piceance, and Barnett. The Northeast segment is involved in Utica and Marcellus shale plays and the equity method investment in Ohio gathering that is the Utica Shale. The Rockies segment includes the wholly owned midstream assets in the Williston Basin and DJ Basin. The Permian segment covers equity method investment in double E. The Piceance segment offers midstream assets located in the Piceance Basin. The Barnett segment provides wholly owned midstream assets located in the Barnett Shale. The company was founded by Steven J. Newby in May 2012 and is headquartered in Houston, TX. |
| Insider Trading |
Relationship |
Date |
Transaction |
Cost |
#Shares |
Value ($) |
#Shares Total |
SEC Form 4 |
| Johnston James David | See remarks below. | Mar 22 '24 | Sale | 25.21 | 3,400 | 85,714 | 48,201 | Mar 22 07:59 PM | | Johnston James David | See remarks below. | Mar 15 '24 | Sale | 20.25 | 600 | 12,150 | 22,250 | Mar 19 08:19 PM | | Johnston James David | See remarks below. | Mar 06 '24 | Sale | 20.25 | 3,300 | 66,825 | 22,850 | Mar 06 07:07 PM | | Johnston James David | See remarks below. | Feb 29 '24 | Sale | 21.10 | 700 | 14,770 | 26,150 | Mar 01 05:49 PM | | Johnston James David | See remarks below. | Nov 08 '23 | Sale | 20.03 | 260 | 5,208 | 29,376 | Nov 08 06:15 PM |
|
|
| |
 |
| Market Cap | 2.17B | EPS (ttm) | 1.56 |
| P/E | 4.52 | EPS this Y | -74.22% |
| Forward P/E | 23.98 | EPS next Y | -33.73% |
| PEG | 0.36 | EPS past 5Y | - |
| P/S | 0.91 | EPS next 5Y | 12.45% |
| P/B | 3.36 | EPS Q/Q | -34.10% |
| Dividend | 2.49% | Sales Q/Q | -12.78% |
| Insider Own | 4.16% | Inst Own | 58.83% |
| Insider Trans | 0.00% | Inst Trans | 1.21% |
| Short Float | 1.20% | Earnings | May 03/b |
| Analyst Recom | 1.50 | Target Price | 9.96 |
| Avg Volume | 825.03K | 52W Range | 5.94 - 10.40 |
|
|
|
|
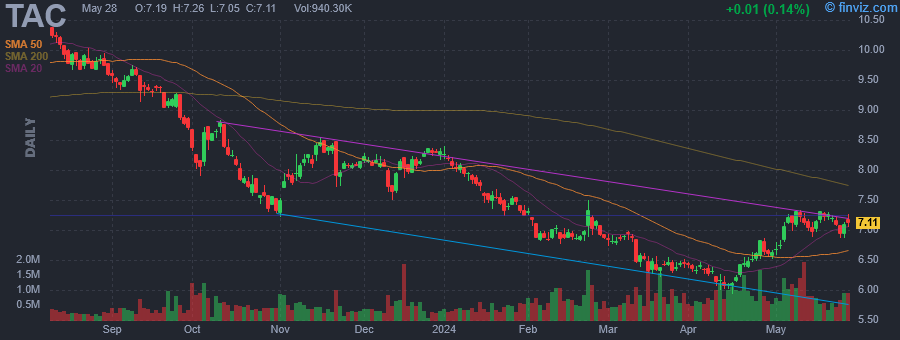
TransAlta Corp. engages in the generation and distribution of electricity through wind, hydro, gas and coal power plants. It operates through the following business segments: Hydro, Wind and Solar, Gas, Energy Transition, Energy Marketing, and Corporate. The Hydro, Wind and Solar, Gas and Energy Transition business segments are responsible for operating and maintaining the company's electrical generation facilities in Canada, Australia, and the US. The Energy Marketing segment is responsible for marketing and scheduling the company's merchant asset fleet outside of Alberta along with procurement of gas, transport and storage to the company's gas fleet, providing intellectual knowledge to support the company's growth team, and generating a stand-alone gross margin separate from the company's asset business through a North American energy marketing platform. The company was founded by William Maxwell Aitken in 1909 and is headquartered in Calgary, Canada. |
|
|
 |
| Market Cap | 1.62B | EPS (ttm) | -4.85 |
| P/E | - | EPS this Y | 86.13% |
| Forward P/E | - | EPS next Y | 30.92% |
| PEG | - | EPS past 5Y | - |
| P/S | 0.32 | EPS next 5Y | - |
| P/B | 0.39 | EPS Q/Q | 228.89% |
| Dividend | 5.22% | Sales Q/Q | -3.15% |
| Insider Own | 13.19% | Inst Own | 79.75% |
| Insider Trans | 0.00% | Inst Trans | 1.03% |
| Short Float | 2.38% | Earnings | May 03/b |
| Analyst Recom | 2.40 | Target Price | 26.67 |
| Avg Volume | 976.50K | 52W Range | 6.43 - 21.75 |
|
|
|
|
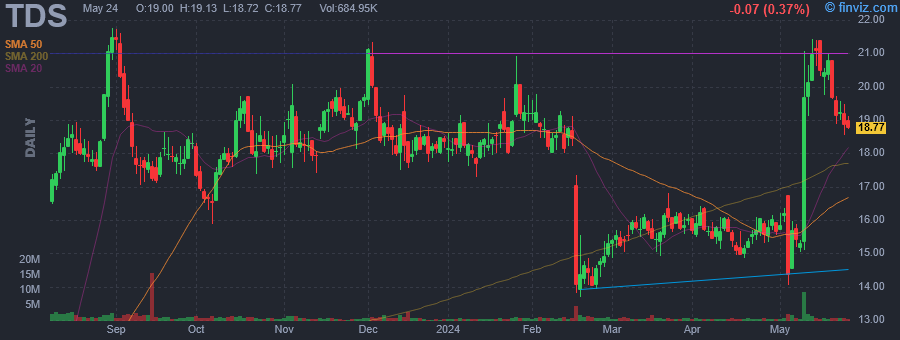
Telephone & Data Systems, Inc. is a diversified telecommunications company, which engages in the provision of communications services, retail wireless connections, broadband, video, and voice connections. It operates through the following segments: UScellular, TDS Telecom, and Corporate, Eliminations, and Other. The UScellular segment provides wireless telecommunications services. The TDS Telecom segment offers communications services through fiber, coaxial, and copper networks. The company was founded by LeRoy T. Carlson in 1968 and is headquartered in Chicago, IL. |
| Insider Trading |
Relationship |
Date |
Transaction |
Cost |
#Shares |
Value ($) |
#Shares Total |
SEC Form 4 |
| CARLSON LEROY T JR | President and CEO | Jan 08 '24 | Option Exercise | 0.00 | 18,313 | 0 | 190,524 | Jan 09 04:05 PM | | Villacrez Vicki L | Executive Vice President & CFO | May 21 '23 | Option Exercise | 0.00 | 6,689 | 0 | 22,287 | May 23 03:45 PM | | Hanley Joseph R | SVP-Strategy & Corp Dev | May 21 '23 | Option Exercise | 0.00 | 11,286 | 0 | 40,418 | May 23 03:43 PM | | Butman James W | President & CEO of subsidiary | May 21 '23 | Option Exercise | 0.00 | 41,356 | 0 | 128,734 | May 23 03:41 PM | | Kroll Anita J | VP, Controller & CAO | May 21 '23 | Option Exercise | 0.00 | 3,267 | 0 | 10,193 | May 23 03:39 PM |
|
|
| |
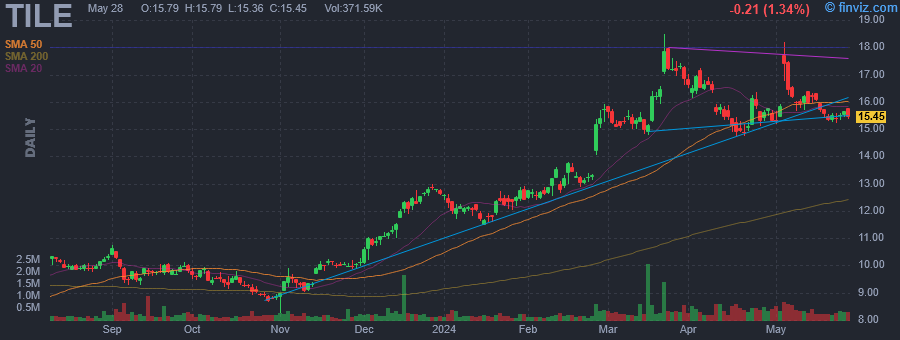 |
| Market Cap | 1.01B | EPS (ttm) | 1.01 |
| P/E | 17.21 | EPS this Y | 8.50% |
| Forward P/E | 12.95 | EPS next Y | 23.81% |
| PEG | 0.52 | EPS past 5Y | -2.24% |
| P/S | 0.81 | EPS next 5Y | 33.10% |
| P/B | 2.37 | EPS Q/Q | 2047.58% |
| Dividend | 0.58% | Sales Q/Q | -2.05% |
| Insider Own | 3.48% | Inst Own | 93.62% |
| Insider Trans | 0.00% | Inst Trans | -1.66% |
| Short Float | 1.70% | Earnings | May 03/b |
| Analyst Recom | 1.67 | Target Price | 19.50 |
| Avg Volume | 435.26K | 52W Range | 6.51 - 18.47 |
|
|
|
|
Interface, Inc. is a flooring company, which offers carpet tile & resilient flooring, including luxury vinyl tile and rubber flooring products. The firm designs, manufactures and sells modular carpet, manufactured for the commercial and institutional markets under the interface brand, and for consumer markets as FLOR modular carpets. It also offers Intersept, a proprietary antimicrobial used in a number of interior finishes. The company was founded by Ray C. Anderson in 1973 and is headquartered in Atlanta, GA. |
| Insider Trading |
Relationship |
Date |
Transaction |
Cost |
#Shares |
Value ($) |
#Shares Total |
SEC Form 4 |
| Nigel Stansfield | Vice President | Aug 11 '23 | Sale | 10.31 | 8,764 | 90,368 | 198,321 | Aug 14 12:08 PM |
|
|
|
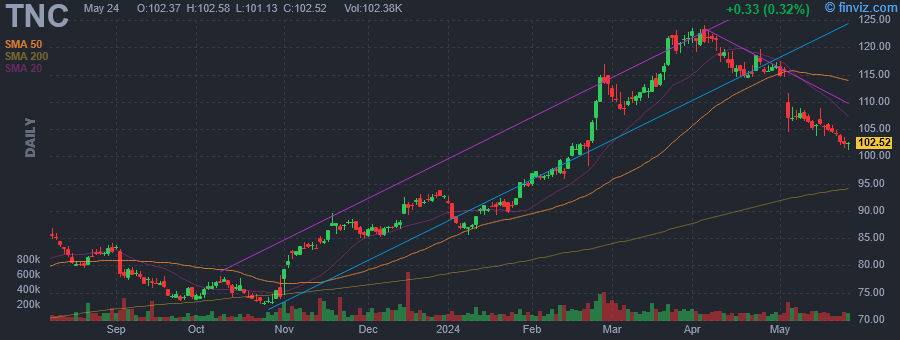 |
| Market Cap | 2.03B | EPS (ttm) | 6.01 |
| P/E | 17.79 | EPS this Y | -1.73% |
| Forward P/E | 15.63 | EPS next Y | 6.01% |
| PEG | 1.19 | EPS past 5Y | 26.19% |
| P/S | 1.63 | EPS next 5Y | 15.00% |
| P/B | 3.24 | EPS Q/Q | 14.45% |
| Dividend | 1.02% | Sales Q/Q | 1.70% |
| Insider Own | 1.21% | Inst Own | 95.02% |
| Insider Trans | -20.72% | Inst Trans | -0.59% |
| Short Float | 2.41% | Earnings | May 03/b |
| Analyst Recom | 1.33 | Target Price | 137.00 |
| Avg Volume | 145.71K | 52W Range | 72.60 - 124.11 |
|
|
|
|
Tennant Co. engages in the design, manufacture, and marketing of cleaning solutions. Its products include equipment for maintaining surfaces in industrial, commercial, and outdoor environments, detergent-free and other sustainable cleaning technologies, cleaning tools and supplies, and coatings for protecting, repairing and upgrading surfaces. It operates through the following geographic segments: North America, Latin America, Europe, Middle East, Africa and Asia Pacific. The company was founded by George Henry Tennant in 1870 and is headquartered in Eden Prairie, MN. |
| Insider Trading |
Relationship |
Date |
Transaction |
Cost |
#Shares |
Value ($) |
#Shares Total |
SEC Form 4 |
| ERICKSON KRISTIN A. | SVP, GENERAL COUNSEL | Mar 08 '24 | Option Exercise | 73.20 | 556 | 40,699 | 11,254 | Mar 11 05:07 PM | | ERICKSON KRISTIN A. | SVP, GENERAL COUNSEL | Mar 08 '24 | Sale | 110.00 | 556 | 61,160 | 10,698 | Mar 11 05:07 PM | | ERICKSON KRISTIN A. | SVP, GENERAL COUNSEL | Mar 07 '24 | Option Exercise | 66.97 | 1,270 | 85,052 | 11,968 | Mar 11 05:07 PM | | ERICKSON KRISTIN A. | SVP, GENERAL COUNSEL | Mar 07 '24 | Sale | 110.66 | 1,270 | 140,532 | 10,698 | Mar 11 05:07 PM | | Huml David W. | PRESIDENT AND CEO | Mar 04 '24 | Option Exercise | 67.68 | 20,009 | 1,354,184 | 82,639 | Mar 05 04:42 PM |
|
|
|
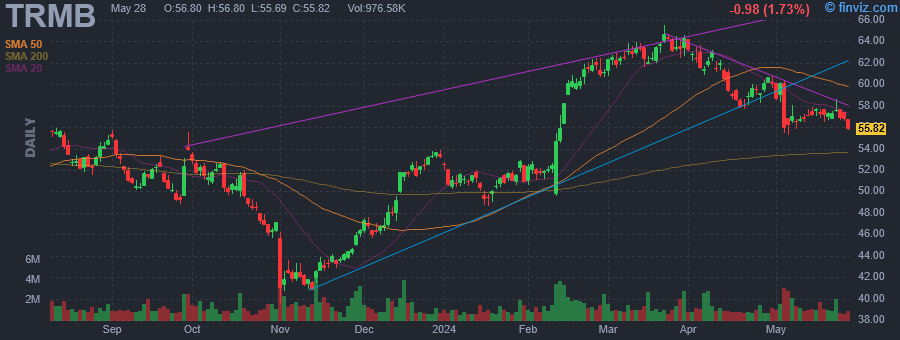 |
| Market Cap | 13.66B | EPS (ttm) | 0.96 |
| P/E | 58.13 | EPS this Y | 2.30% |
| Forward P/E | 18.12 | EPS next Y | 13.44% |
| PEG | 5.81 | EPS past 5Y | 2.29% |
| P/S | 3.56 | EPS next 5Y | 10.00% |
| P/B | 3.06 | EPS Q/Q | -55.59% |
| Dividend | - | Sales Q/Q | 4.14% |
| Insider Own | 0.55% | Inst Own | 94.96% |
| Insider Trans | -2.09% | Inst Trans | -0.84% |
| Short Float | 0.83% | Earnings | May 03/b |
| Analyst Recom | 1.92 | Target Price | 69.46 |
| Avg Volume | 1.50M | 52W Range | 39.57 - 65.55 |
|
|
|
|
Trimble, Inc. engages in the provision of positioning technology solutions. It operates through the following segments: Buildings and Infrastructure, Geospatial, Resources and Utilities, and Transportation. The Buildings and Infrastructure segment serves architects, engineers, contractors, owners, and operators. The Geospatial segment offers solutions for customers working in surveying, engineering, and government. The Resources and Utilities segment caters to customers working in agriculture, forestry, and utilities. The Transportation segment covers the long-haul trucking, field service management, rail, and construction logistics industries. The company was founded in 1978 by Charles Robert Trimble and is headquartered in Westminster, CO. |
| Insider Trading |
Relationship |
Date |
Transaction |
Cost |
#Shares |
Value ($) |
#Shares Total |
SEC Form 4 |
| SCHWARTZ MARK DAVID | Senior VP, CES | Apr 16 '24 | Sale | 59.10 | 2,322 | 137,230 | 10,265 | Apr 18 03:17 PM | | Large Peter | Senior Vice President | Apr 16 '24 | Sale | 59.10 | 1,447 | 85,518 | 8,220 | Apr 18 03:17 PM | | PAINTER ROBERT G | President & CEO | Apr 15 '24 | Option Exercise | 60.54 | 43,037 | 2,605,460 | 216,351 | Apr 17 02:00 PM | | Barnes David G | CFO | Apr 15 '24 | Option Exercise | 60.54 | 14,675 | 888,424 | 79,118 | Apr 17 02:01 PM | | Bisio Ronald | Sr. Vice President | Apr 15 '24 | Option Exercise | 60.54 | 6,849 | 414,638 | 82,044 | Apr 17 02:01 PM |
|
|
|
