 |
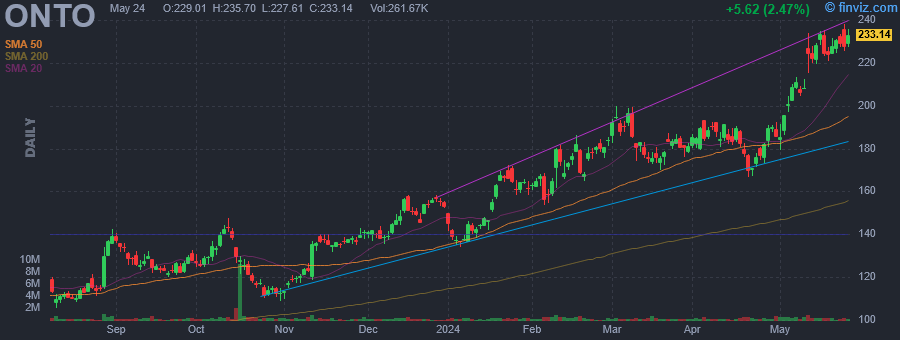
| Market Cap | 9.99B | EPS (ttm) | 2.46 |
| P/E | 82.81 | EPS this Y | 24.00% |
| Forward P/E | 34.31 | EPS next Y | 28.14% |
| PEG | 6.90 | EPS past 5Y | 7.12% |
| P/S | 12.24 | EPS next 5Y | 12.00% |
| P/B | 5.75 | EPS Q/Q | -54.38% |
| Dividend | - | Sales Q/Q | -13.59% |
| Insider Own | 0.76% | Inst Own | 99.75% |
| Insider Trans | -11.22% | Inst Trans | -2.93% |
| Short Float | 3.14% | Earnings | May 09/a |
| Analyst Recom | 1.40 | Target Price | 216.25 |
| Avg Volume | 439.74K | 52W Range | 80.17 - 199.72 |
|
|
|
|
Onto Innovation, Inc. engages in the business of designing, developing, manufacturing, and supporting high-performance control metrology, defect inspection, lithography, and data analysis systems used by microelectronics device manufacturers. The firm is also involved in providing process and yield management solutions used in bare silicon wafer production and wafer processing facilities. The company was founded in 1940 and is headquartered in Wilmington, MA. |
| Insider Trading |
Relationship |
Date |
Transaction |
Cost |
#Shares |
Value ($) |
#Shares Total |
SEC Form 4 |
| Plisinski Michael P | CEO | Mar 20 '24 | Sale | 175.48 | 40,000 | 7,019,129 | 235,492 | Mar 22 04:42 PM | | OH Yoon Ah | VP, General Counsel & Corp Sec | Mar 18 '24 | Sale | 180.00 | 1,685 | 303,300 | 14,913 | Mar 18 04:21 PM | | OH Yoon Ah | VP, General Counsel & Corp Sec | Mar 15 '24 | Sale | 173.96 | 2,685 | 467,083 | 16,598 | Mar 18 04:21 PM | | MILLER DAVID BRIAN | Director | Feb 13 '24 | Sale | 170.49 | 2,800 | 477,372 | 9,008 | Feb 13 06:01 PM | | Plisinski Michael P | CEO | Feb 10 '24 | Option Exercise | 0.00 | 19,050 | 0 | 276,572 | Feb 12 04:42 PM |
|
|
 |
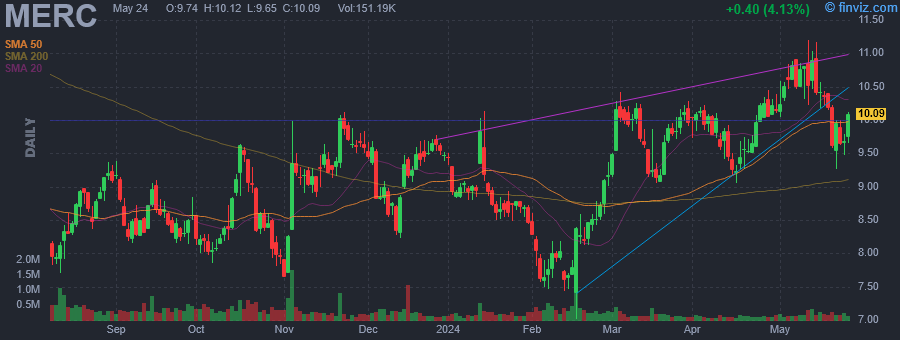 |
| Market Cap | 708.44M | EPS (ttm) | -3.64 |
| P/E | - | EPS this Y | 92.18% |
| Forward P/E | 23.26 | EPS next Y | 260.42% |
| PEG | - | EPS past 5Y | - |
| P/S | 0.36 | EPS next 5Y | 5.73% |
| P/B | 1.12 | EPS Q/Q | -533.25% |
| Dividend | 2.82% | Sales Q/Q | -19.31% |
| Insider Own | 43.37% | Inst Own | 56.60% |
| Insider Trans | 0.00% | Inst Trans | 8.62% |
| Short Float | 3.60% | Earnings | May 09/a |
| Analyst Recom | 3.00 | Target Price | 10.50 |
| Avg Volume | 243.89K | 52W Range | 7.01 - 10.59 |
|
|
|
|
Mercer International, Inc. engages in the manufacture and sale of pulp. It operates through the Pulp and Wood Products segments. The Pulp segment consists of the manufacture, sale, and distribution of NBSK pulp, electricity, and other by-products at three pulp mills. The Wood Products segment is involved in the manufacture, sale, and distribution of lumber, electricity and other wood residuals at the Friesau Facility. The company was founded on July 1, 1968 and is headquartered in Vancouver, Canada. |
| Insider Trading |
Relationship |
Date |
Transaction |
Cost |
#Shares |
Value ($) |
#Shares Total |
SEC Form 4 |
| MERWIN BRIAN | Senior VP, Mass Timber | Feb 15 '24 | Option Exercise | 0.00 | 5,863 | 0 | 58,890 | Feb 16 02:44 PM | | STANNUS GENEVIEVE | VP, Treasurer | Feb 15 '24 | Option Exercise | 0.00 | 4,206 | 0 | 43,675 | Feb 16 12:58 PM | | Ridder Wolfram | VP of Business Development | Feb 15 '24 | Option Exercise | 0.00 | 9,279 | 0 | 78,395 | Feb 16 02:05 PM | | BUENO ESTRADA JUAN CARLOS | CEO & President | Feb 15 '24 | Option Exercise | 0.00 | 58,754 | 0 | 86,254 | Feb 16 01:47 PM | | Merforth Carsten | COO, Wood Products | Feb 15 '24 | Option Exercise | 0.00 | 10,250 | 0 | 20,366 | Feb 16 02:23 PM |
|
|
|
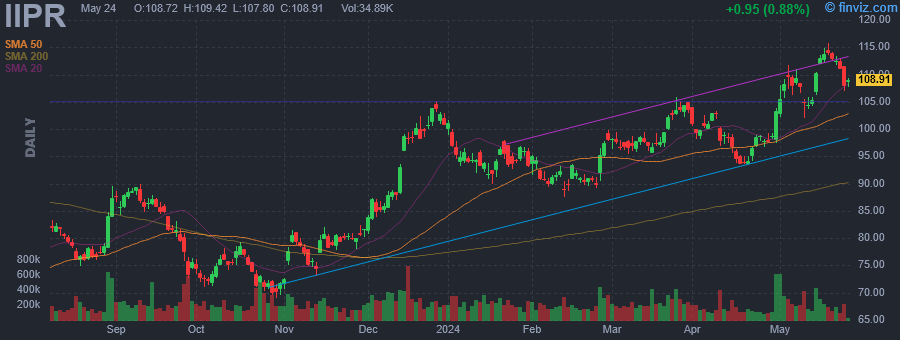 |
| Market Cap | 3.05B | EPS (ttm) | 5.78 |
| P/E | 18.71 | EPS this Y | 2.73% |
| Forward P/E | 18.27 | EPS next Y | -0.13% |
| PEG | - | EPS past 5Y | 50.43% |
| P/S | 9.86 | EPS next 5Y | - |
| P/B | 1.57 | EPS Q/Q | 0.22% |
| Dividend | 6.75% | Sales Q/Q | 12.34% |
| Insider Own | 1.50% | Inst Own | 70.86% |
| Insider Trans | -0.59% | Inst Trans | -1.00% |
| Short Float | 7.65% | Earnings | May 08/a |
| Analyst Recom | 2.43 | Target Price | 121.40 |
| Avg Volume | 224.06K | 52W Range | 65.16 - 109.18 |
|
|
|
|
Innovative Industrial Properties, Inc. is a real estate investment trust, which engages in the acquisition, ownership, and management of industrial properties. It operates through the following geographical segments: Arizona, California, Colorado, Florida, Illinois, Maryland, Massachusetts, Michigan, Minnesota, Missouri, Nevada, New Jersey, New York, North Dakota, Ohio, Pennsylvania, Texas, Virginia, and Washington. The firm's property portfolio includes PharmaCann, Inc., SH Parent, Inc., Ascend Wellness Holdings, Inc., Cresco Labs Inc., and Kings Garden Inc. The company was founded by Alan D. Gold, Gary A. Kreitzer and Paul E. Smithers on June 15, 2016 and is headquartered in Park City, UT. |
| Insider Trading |
Relationship |
Date |
Transaction |
Cost |
#Shares |
Value ($) |
#Shares Total |
SEC Form 4 |
| Stecher David | Director | Nov 15 '23 | Sale | 80.75 | 2,500 | 201,888 | 7,529 | Nov 15 05:41 PM |
|
|
| |
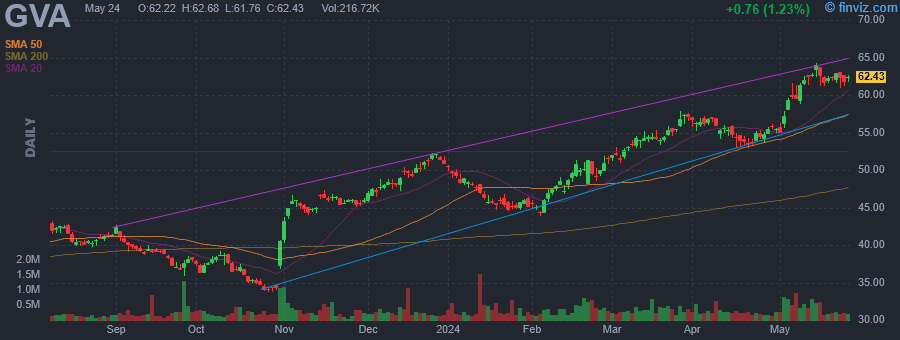 |
| Market Cap | 2.60B | EPS (ttm) | 0.65 |
| P/E | 91.57 | EPS this Y | 315.81% |
| Forward P/E | 12.20 | EPS next Y | 20.25% |
| PEG | 13.08 | EPS past 5Y | 128.90% |
| P/S | 0.74 | EPS next 5Y | 7.00% |
| P/B | 2.66 | EPS Q/Q | 13.21% |
| Dividend | 0.88% | Sales Q/Q | 18.31% |
| Insider Own | 1.22% | Inst Own | 107.95% |
| Insider Trans | -0.23% | Inst Trans | -1.83% |
| Short Float | 10.11% | Earnings | May 02/b |
| Analyst Recom | 2.33 | Target Price | 65.25 |
| Avg Volume | 362.21K | 52W Range | 33.74 - 57.93 |
|
|
|
|
Granite Construction, Inc. is a holding company. It operates as an infrastructure contractor and a construction materials company in the United States. It operates through the following segments: Construction and Materials. The Construction segment is involved in the construction and rehabilitation of roads, pavement preservation, bridges, rail lines, airports, marine ports, dams, reservoirs, aqueducts, infrastructure, and site development for use by the public. It also focuses on water-related construction for municipal agencies, commercial water suppliers, industrial facilities, and energy companies. The company also constructs various complex projects, including infrastructure/site development, mining, public safety, tunnel, solar, and power projects. The Materials segment is involved in the production of aggregates and asphalt for internal use, as well as for sale to third parties. In addition, it offers site preparation, mining, and infrastructure services for residential development, energy development, commercial and industrial sites, and other facilities, and provides construction management professional services. The company serves federal agencies, state departments of transportation, local transit authorities, county and city public works departments, school districts and developers, utilities, contractors, landscapers, manufacturers of products requiring aggregate materials, retailers, homeowners, farmers, brokers, and private owners of industrial, commercial, and residential sites. The company was founded in 1922 and is headquartered in Watsonville, CA. |
| Insider Trading |
Relationship |
Date |
Transaction |
Cost |
#Shares |
Value ($) |
#Shares Total |
SEC Form 4 |
| CALDERA LOUIS E | Director | Feb 27 '24 | Sale | 50.00 | 1,263 | 63,150 | 8,528 | Feb 27 07:45 PM |
|
|
|
 |
| Market Cap | 18.03B | EPS (ttm) | 12.88 |
| P/E | 35.45 | EPS this Y | 3.14% |
| Forward P/E | 29.00 | EPS next Y | 11.66% |
| PEG | 8.02 | EPS past 5Y | 16.06% |
| P/S | 2.47 | EPS next 5Y | 4.42% |
| P/B | 8.07 | EPS Q/Q | -23.38% |
| Dividend | 2.37% | Sales Q/Q | 0.93% |
| Insider Own | 14.84% | Inst Own | 92.85% |
| Insider Trans | -0.09% | Inst Trans | 2.02% |
| Short Float | 12.45% | Earnings | Apr 24/b |
| Analyst Recom | 3.00 | Target Price | 430.49 |
| Avg Volume | 346.82K | 52W Range | 315.17 - 456.14 |
|
|
|
|
Watsco, Inc. engages in the distribution of air conditioning, heating and refrigeration equipment, and related parts and supplies. Its products include residential central air conditioners, gas, electric & oil furnaces, commercial air conditioning and heating equipment, and other specialized equipment and parts, including replacement compressors, evaporator coils, motors and other component parts and supplies, including thermostats, insulation material, refrigerants, ductwork, grills, registers, sheet metal, tools, copper tubing, concrete pads, tape, adhesives, and other ancillary supplies. The company was founded by William Wagner in 1956 and is headquartered in Miami, FL. |
| Insider Trading |
Relationship |
Date |
Transaction |
Cost |
#Shares |
Value ($) |
#Shares Total |
SEC Form 4 |
| ALVAREZ CESAR L | Director | Dec 12 '23 | Option Exercise | 160.69 | 5,000 | 803,450 | 0 | Dec 14 04:24 PM | | ALVAREZ CESAR L | Director | Dec 12 '23 | Sale | 412.34 | 5,000 | 2,061,700 | 0 | Dec 14 04:24 PM | | Custer John Michael | Director | Jun 06 '23 | Option Exercise | 260.28 | 1,667 | 433,887 | 0 | Jun 08 04:14 PM | | ALVAREZ CESAR L | Director | May 22 '23 | Option Exercise | 185.12 | 4,000 | 740,480 | 0 | May 24 04:08 PM | | ALVAREZ CESAR L | Director | May 22 '23 | Sale | 332.64 | 4,000 | 1,330,560 | 0 | May 24 04:08 PM |
|
|
| |
 |
| Market Cap | 18.39B | EPS (ttm) | 2.63 |
| P/E | 45.68 | EPS this Y | 5.32% |
| Forward P/E | 25.12 | EPS next Y | 55.09% |
| PEG | 5.95 | EPS past 5Y | 3.09% |
| P/S | 6.93 | EPS next 5Y | 7.68% |
| P/B | 7.27 | EPS Q/Q | -20.37% |
| Dividend | 0.39% | Sales Q/Q | -2.63% |
| Insider Own | 0.44% | Inst Own | 105.73% |
| Insider Trans | -1.79% | Inst Trans | -1.31% |
| Short Float | 3.43% | Earnings | Apr 24/a |
| Analyst Recom | 2.11 | Target Price | 122.06 |
| Avg Volume | 1.96M | 52W Range | 81.07 - 119.20 |
|
|
|
|
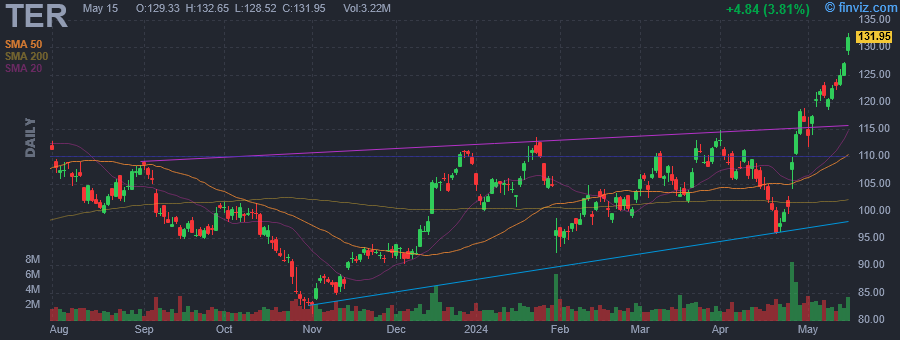
Teradyne, Inc. engages in the development and sale of automatic test systems. It operates through the following business segments: Semiconductor Test, System Test, Robotics, Wireless Test, and Corporate. The Semiconductor Test segment designs, manufactures, and markets semiconductor test products and services. The System Test segment markets products and services for the Defense/Aerospace, Storage Test, and Production Board Test business units. The Robotics segment includes operations related to the design, manufacturing, and marketing of collaborative robotic arms, autonomous mobile robots, and advanced robotic control software. The Wireless Test segment is involved in wireless test products and services. The Corporate relates to other automatic test systems and robotics products. The company was founded by Alexander V. d'Arbeloff and Nicholas DeWolf in 1960 and is headquartered in North Reading, MA. |
| Insider Trading |
Relationship |
Date |
Transaction |
Cost |
#Shares |
Value ($) |
#Shares Total |
SEC Form 4 |
| MATZ MARILYN | Director | Mar 15 '24 | Buy | 106.04 | 13 | 1,414 | 14,326 | Mar 19 04:57 PM | | MADDOCK ERNEST E | Director | Feb 01 '24 | Buy | 94.07 | 1,000 | 94,070 | 4,728 | Feb 05 05:17 PM | | Mehta Sanjay | VP and Chief Financial Officer | Jan 30 '24 | Sale | 105.10 | 8,653 | 909,424 | 31,180 | Jan 31 05:58 PM | | Burns Richard John | President, Semiconductor Test | Jan 30 '24 | Sale | 104.89 | 1,744 | 182,928 | 16,734 | Jan 31 06:19 PM | | Mehta Sanjay | VP and Chief Financial Officer | Jan 25 '24 | Sale | 110.95 | 1,083 | 120,161 | 45,107 | Jan 26 05:17 PM |
|
|
|
 |
| Market Cap | 3.55B | EPS (ttm) | -1.34 |
| P/E | - | EPS this Y | 55.82% |
| Forward P/E | 34.18 | EPS next Y | 30.35% |
| PEG | - | EPS past 5Y | -6.26% |
| P/S | 5.57 | EPS next 5Y | 34.40% |
| P/B | 7.76 | EPS Q/Q | -2516.85% |
| Dividend | - | Sales Q/Q | 8.17% |
| Insider Own | 5.57% | Inst Own | 101.39% |
| Insider Trans | -11.45% | Inst Trans | -1.85% |
| Short Float | 5.68% | Earnings | May 01/a |
| Analyst Recom | 1.71 | Target Price | 54.01 |
| Avg Volume | 675.96K | 52W Range | 21.21 - 59.64 |
|
|
|
|
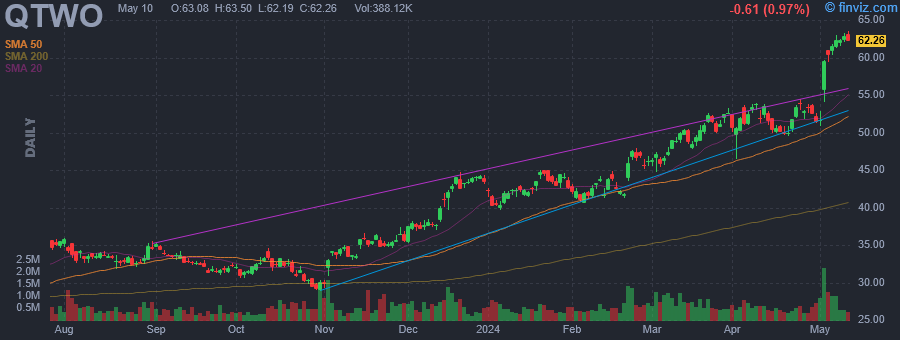
Q2 Holdings, Inc. engages in the provision of digital banking and lending solutions. It offers its solutions to financial institutions, financial technology companies, alternative finance companies, and other innovative companies, wishing to incorporate banking into their customer engagement and servicing strategies. The company was founded by Robert Hank Seale III in 2004 and is headquartered in Austin, TX. |
| Insider Trading |
Relationship |
Date |
Transaction |
Cost |
#Shares |
Value ($) |
#Shares Total |
SEC Form 4 |
| Seale R. H. | Director | Apr 19 '24 | Sale | 50.10 | 9,000 | 450,900 | 363,754 | Apr 19 04:57 PM | | Seale R. H. | Director | Mar 15 '24 | Sale | 48.49 | 9,000 | 436,410 | 372,754 | Mar 18 04:11 PM | | Flake Matthew P | Chief Executive Officer | Mar 14 '24 | Sale | 49.58 | 8,820 | 437,296 | 372,155 | Mar 14 05:08 PM | | Breeden John E | Chief Operating Officer | Mar 14 '24 | Sale | 49.58 | 3,725 | 184,686 | 140,463 | Mar 14 05:01 PM | | Volanoski Michael A. | Chief Revenue Officer | Mar 14 '24 | Sale | 49.57 | 3,020 | 149,701 | 171,004 | Mar 14 05:11 PM |
|
|
| |
 |
| Market Cap | 2.27B | EPS (ttm) | -1.42 |
| P/E | - | EPS this Y | 30.27% |
| Forward P/E | - | EPS next Y | 28.11% |
| PEG | - | EPS past 5Y | - |
| P/S | 25.47 | EPS next 5Y | 19.00% |
| P/B | 13.76 | EPS Q/Q | 54.24% |
| Dividend | - | Sales Q/Q | 77.65% |
| Insider Own | 15.95% | Inst Own | 79.49% |
| Insider Trans | -20.09% | Inst Trans | -1.02% |
| Short Float | 4.70% | Earnings | May 06/a |
| Analyst Recom | 1.00 | Target Price | 62.62 |
| Avg Volume | 402.20K | 52W Range | 18.09 - 59.70 |
|
|
|
May-02-24 05:03PM
|
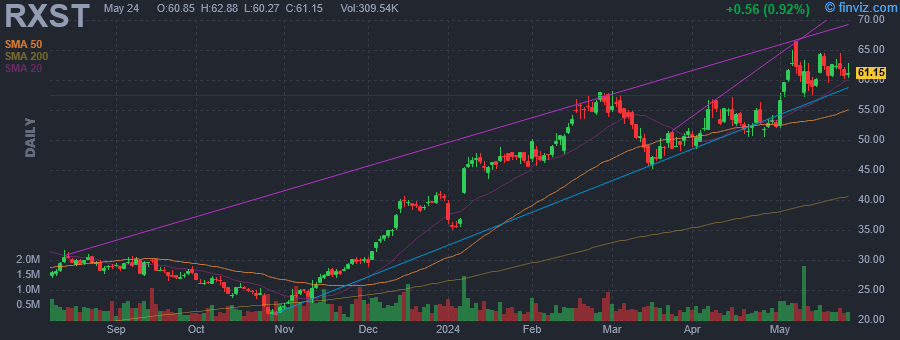
Rxsight Insider Sold Shares Worth $526,913, According to a Recent SEC Filing
(MT Newswires) +5.17% |
|
May-01-24 04:05PM
|
RxSight, Inc. to Present at the Bank of America Healthcare Conference
(GlobeNewswire) +8.77% |
|
Apr-22-24 04:05PM
|
RxSight, Inc. to Report First Quarter Financial Results on May 6, 2024
(GlobeNewswire) |
|
Apr-04-24 04:05PM
|
RxSight Announces Commercial Launch of its Newest Light Adjustable Lens , the LAL+ , and Features Multiple Doctor Presentations at the Upcoming ASCRS Annual Meeting
(GlobeNewswire) |
|
Mar-27-24 04:05PM
|
RxSight, Inc. to Participate in the 23rd Annual Needham Virtual Healthcare Conference
(GlobeNewswire) |
|
Feb-29-24 07:05PM
|
RxSight, Inc. to Participate in the 34th Annual Oppenheimer Healthcare Conference
(GlobeNewswire) |
|
11:09AM
|
RxSight, Inc. (NASDAQ:RXST) Q4 2023 Earnings Call Transcript
(Insider Monkey) |
|
08:36AM
|
Q4 2023 Rxsight Inc Earnings Call
(Thomson Reuters StreetEvents) |
|
Feb-28-24 04:38PM
|
RxSight Inc (RXST) Reports Significant Revenue Growth in Q4 and Full Year 2023
(GuruFocus.com) |
|
04:05PM
|
RxSight, Inc. Reports Fourth Quarter and Full Year 2023 Financial Results
(GlobeNewswire) |
|
RxSight, Inc. engages in the research, development, manufacture, and sale of light adjustable lenses and related capital equipment. It also commercializes adjustable intraocular lens (IOL) that is customized after cataract surgery. The company was founded on March 5, 1997 and is headquartered in Aliso Viejo, CA. |
| Insider Trading |
Relationship |
Date |
Transaction |
Cost |
#Shares |
Value ($) |
#Shares Total |
SEC Form 4 |
| Thunen Shelley B | Chief Financial Officer | May 01 '24 | Option Exercise | 15.60 | 10,247 | 159,836 | 23,938 | May 02 04:58 PM | | Thunen Shelley B | Chief Financial Officer | May 01 '24 | Sale | 52.69 | 10,000 | 526,913 | 13,938 | May 02 04:58 PM | | Thunen Shelley B | Chief Financial Officer | Apr 01 '24 | Sale | 49.90 | 20,000 | 997,946 | 8,402 | Apr 02 04:18 PM | | Thunen Shelley B | Chief Financial Officer | Mar 01 '24 | Option Exercise | 15.60 | 10,000 | 155,983 | 23,691 | Mar 05 04:05 PM | | Thunen Shelley B | Chief Financial Officer | Mar 01 '24 | Sale | 56.37 | 10,000 | 563,726 | 13,691 | Mar 05 04:05 PM |
|
|
|
 |
| Market Cap | 501.67M | EPS (ttm) | -0.02 |
| P/E | - | EPS this Y | - |
| Forward P/E | - | EPS next Y | - |
| PEG | - | EPS past 5Y | - |
| P/S | 11.09 | EPS next 5Y | - |
| P/B | 4.81 | EPS Q/Q | 114.29% |
| Dividend | - | Sales Q/Q | 9.89% |
| Insider Own | 85.43% | Inst Own | 0.84% |
| Insider Trans | -0.02% | Inst Trans | 1.43% |
| Short Float | 0.28% | Earnings | Jan 17/b |
| Analyst Recom | 1.00 | Target Price | 4.00 |
| Avg Volume | 63.89K | 52W Range | 1.95 - 4.25 |
|
|
|
|
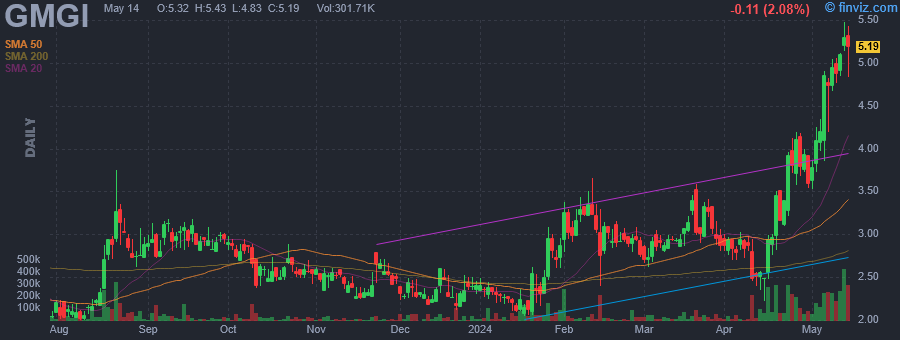
Golden Matrix Group, Inc. engages in offering casino, sportsbook, and competition products. Its brands include R Kings Competitions, MexPlay, and GM-AG. It operates through the Business-to-business (B2B) and Business-to-consumer (B2C) segments. The B2B segment is involved in the charges of usage of its software and royalties charged on the use of third-party gaming content. The B2C segment focuses on the charges to enter prize competitions in the United Kingdom. The company was founded by Weiting Feng and Anthony Brian Goodman on June 4, 2008 and is headquartered in Las Vegas, NV. |
| Insider Trading |
Relationship |
Date |
Transaction |
Cost |
#Shares |
Value ($) |
#Shares Total |
SEC Form 4 |
| Feng Weiting | Chief Operating Officer | Apr 24 '24 | Sale | 4.00 | 15,727 | 62,908 | 2,837,688 | Apr 30 04:01 PM |
|
|
|
 |
| Market Cap | 5.06B | EPS (ttm) | 0.40 |
| P/E | 6.59 | EPS this Y | -14.22% |
| Forward P/E | 8.38 | EPS next Y | -2.05% |
| PEG | - | EPS past 5Y | 19.94% |
| P/S | 0.69 | EPS next 5Y | 0.00% |
| P/B | 1.62 | EPS Q/Q | 9.47% |
| Dividend | 6.55% | Sales Q/Q | 8.27% |
| Insider Own | 0.00% | Inst Own | 8.39% |
| Insider Trans | - | Inst Trans | 1.09% |
| Short Float | 0.06% | Earnings | Mar 22/b |
| Analyst Recom | - | Target Price | - |
| Avg Volume | 2.52M | 52W Range | 1.97 - 2.62 |
|
|
|
|
Companhia Energetica de Minas Gerais SA engages in the generation, transmission, distribution and sale of electricity, gas distribution, telecommunications and the provision of energy solutions. It operates through the following segments: Generation and Sale, Transmission, Distribution, Gas, and Other Businesses. The Generation and Sale segment engages in the generation of electricity through hydroelectric plants, thermoelectric plants and wind farms. The Transmission segment engages in the electric power transmission business, which consists of transporting electric power from the facilities where it broadcasted to the distribution networks for delivery to final users. The Distribution segment engages in the supply electricity to consumers in the state of Minas Gerais. The Other Businesses segment engages in the telecommunications, national and international energy solutions, and exploitation of natural gas. The company was founded by Juscelino Kubitschek de Oliveira on May 22, 1952 and is headquartered in Belo Horizonte, Brazil. |
|
|
