 |
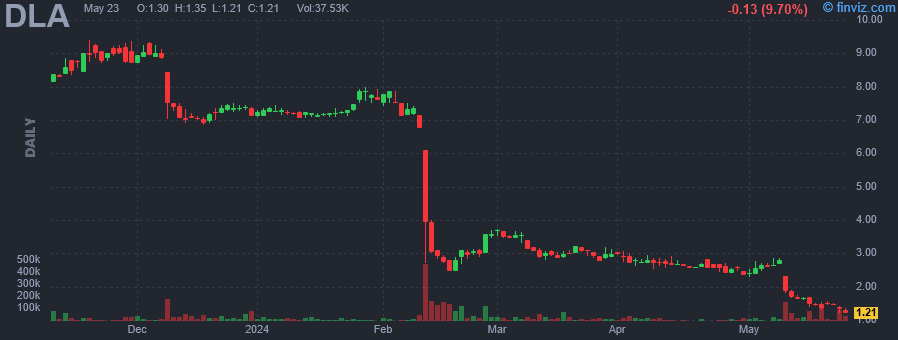
| Market Cap | 17.06M | EPS (ttm) | -5.45 |
| P/E | - | EPS this Y | - |
| Forward P/E | - | EPS next Y | - |
| PEG | - | EPS past 5Y | - |
| P/S | 0.04 | EPS next 5Y | 15.00% |
| P/B | 0.12 | EPS Q/Q | -137.49% |
| Dividend | - | Sales Q/Q | -25.50% |
| Insider Own | 15.95% | Inst Own | 60.07% |
| Insider Trans | 0.00% | Inst Trans | -3.74% |
| Short Float | 0.84% | Earnings | Feb 12/a |
| Analyst Recom | 5.00 | Target Price | 37.00 |
| Avg Volume | 41.08K | 52W Range | 2.35 - 11.78 |
|
|
|
|
Delta Apparel, Inc. engages in designing, manufacturing, sourcing, and marketing lifestyle branded active wear apparel and headwear. It operates through the Delta Group and Salt Life Group segments. The Delta Group segment consists of the business units DTG2Go, Delta Activewear, and Soffe, which are primarily focused on core activewear styles. The Salt Life Group segment includes lifestyle brands focused on a range of apparel garments, headwear, and related accessories to meet consumer preferences and fashion trends, along with Salt Life and Coast business units. The company was founded in 1999 and is headquartered in Duluth, GA. |
| Insider Trading |
Relationship |
Date |
Transaction |
Cost |
#Shares |
Value ($) |
#Shares Total |
SEC Form 4 |
| Encalada Arjona Carlos Enrique | V.P. of Manufacturing | Dec 28 '23 | Option Exercise | 0.00 | 2,500 | 0 | 4,654 | Jan 02 02:36 PM | | Stillwell Jeffery Neil | President, Salt Life Group | Dec 28 '23 | Option Exercise | 0.00 | 5,000 | 0 | 64,157 | Jan 02 04:15 PM | | HUMPHREYS ROBERT W | Chairman and CEO | Dec 28 '23 | Option Exercise | 0.00 | 42,000 | 0 | 500,902 | Jan 02 03:20 PM | | Chang Lauren Satterfield | Deputy GC & Corp. Secretary | Dec 28 '23 | Option Exercise | 0.00 | 1,750 | 0 | 1,750 | Jan 02 02:26 PM | | Bubanich Nancy P | VP & Chief Accounting Officer | Dec 28 '23 | Option Exercise | 0.00 | 1,750 | 0 | 5,070 | Jan 02 02:43 PM |
|
|
 |
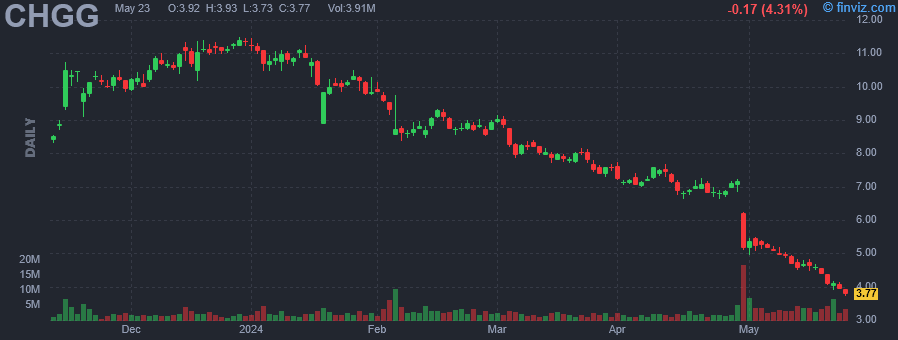 |
| Market Cap | 549.94M | EPS (ttm) | -0.40 |
| P/E | - | EPS this Y | -6.29% |
| Forward P/E | 5.00 | EPS next Y | 4.41% |
| PEG | - | EPS past 5Y | -20.81% |
| P/S | 0.78 | EPS next 5Y | 20.00% |
| P/B | 0.57 | EPS Q/Q | -178.98% |
| Dividend | - | Sales Q/Q | -7.06% |
| Insider Own | 4.06% | Inst Own | 98.34% |
| Insider Trans | -0.45% | Inst Trans | -4.01% |
| Short Float | 14.37% | Earnings | Apr 29/a |
| Analyst Recom | 3.67 | Target Price | 7.20 |
| Avg Volume | 3.04M | 52W Range | 5.11 - 17.92 |
|
|
|
May-01-24 09:35AM
|
Down -27.49% in 4 Weeks, Here's Why Chegg (CHGG) Looks Ripe for a Turnaround
(Zacks) |
|
09:17AM
|
Chegg, Inc. (NYSE:CHGG) Q1 2024 Earnings Call Transcript
(Insider Monkey) |
|
Apr-30-24 04:21PM
|
These Stocks Moved the Most Today: MicroStrategy, Eli Lilly, 3M, PayPal, GE Healthcare, F5, Tesla, Chegg, Super Micro, and More
(Barrons.com) -27.89% |
|
04:11PM
|
Chegg stock sinks on disappointing Q2 guidance, AI headwinds
(Yahoo Finance Video) |
|
03:49PM
|
Chegg, Coursera Shares Drop on Challenging Online Learning Outlook
(The Wall Street Journal) |
|
03:04PM
|
Top Midday Decliners
(MT Newswires) |
|
02:40PM
|
Chegg Shares Plunge After Q1 Results
(MT Newswires) |
|
02:24PM
|
These Stocks Are Moving the Most Today: MicroStrategy, Eli Lilly, 3M, PayPal, GE Healthcare, F5, Tesla, Chegg, Super Micro, and More
(Barrons.com) |
|
02:13PM
|
Chegg Slumps as Wall Street Sees AI Threat to Homework-Help Firm
(Bloomberg) |
|
12:22PM
|
Eli Lilly, 3M rise; MicroStrategy, Chegg fall, Tuesday, 4/30/2024
(Associated Press) |
|
Chegg, Inc. engages in providing support and a learning platform for students. Its services include Chegg Study Pack, Chegg Study, Chegg Writing, Chegg Math, Busuu offerings, Chegg Skills, advertising services, print textbooks, and eTextbooks offerings. The company was founded by Osman Rashid and Aayush Phumbhra on July 29, 2005 and is headquartered in Santa Clara, CA. |
| Insider Trading |
Relationship |
Date |
Transaction |
Cost |
#Shares |
Value ($) |
#Shares Total |
SEC Form 4 |
| Schultz Nathan J. | CHIEF OPERATING OFFICER | Dec 13 '23 | Sale | 10.41 | 1,350 | 14,054 | 421,025 | Dec 14 05:11 PM | | Schultz Nathan J. | CHIEF OPERATING OFFICER | Dec 04 '23 | Sale | 10.13 | 630 | 6,382 | 426,802 | Dec 05 01:35 PM | | BROWN ANDREW J | CHIEF FINANCIAL OFFICER | Nov 27 '23 | Sale | 10.02 | 16,921 | 169,548 | 91,922 | Nov 29 07:52 PM | | Schultz Nathan J. | CHIEF OPERATING OFFICER | Sep 13 '23 | Sale | 10.06 | 1,547 | 15,563 | 429,501 | Sep 14 07:27 PM | | Schultz Nathan J. | CHIEF OPERATING OFFICER | Sep 05 '23 | Sale | 10.60 | 818 | 8,672 | 434,816 | Sep 06 04:38 PM |
|
|
|
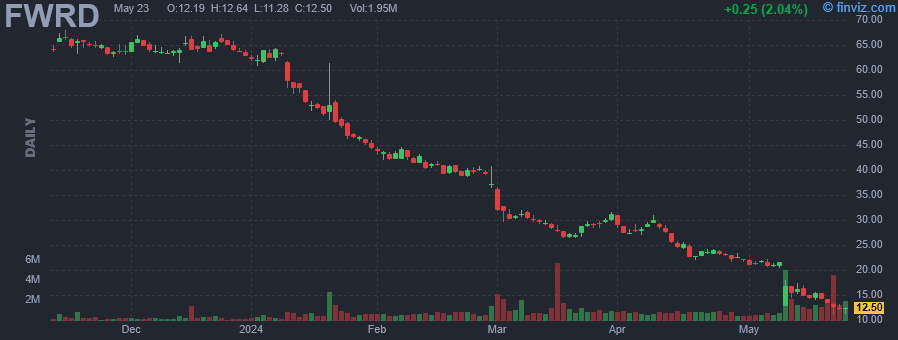 |
| Market Cap | 555.09M | EPS (ttm) | 0.38 |
| P/E | 54.70 | EPS this Y | -74.60% |
| Forward P/E | 10.70 | EPS next Y | 97.56% |
| PEG | 4.16 | EPS past 5Y | -32.59% |
| P/S | 0.35 | EPS next 5Y | 13.16% |
| P/B | 0.71 | EPS Q/Q | -231.48% |
| Dividend | 3.42% | Sales Q/Q | -29.67% |
| Insider Own | 7.40% | Inst Own | 92.61% |
| Insider Trans | -0.01% | Inst Trans | 0.01% |
| Short Float | 16.87% | Earnings | May 08/a |
| Analyst Recom | 2.71 | Target Price | 35.40 |
| Avg Volume | 983.54K | 52W Range | 21.60 - 121.38 |
|
|
|
|
Forward Air Corp. engages in the provision of less-than-truckload (LTL), truckload, intermodal and pool distribution services. It operates through the following segments: Expedited LTL and Intermodal. The Expedited LTL segment provides expedited regional, inter-regional and national LTL, final mile and truckload services. The Intermodal segment provides first and last-mile high value intermodal container drayage services to and from seaports and railheads. The company was founded by Scott M. Niswonger on October 23, 1981 and is headquartered in Greeneville, TN. |
| Insider Trading |
Relationship |
Date |
Transaction |
Cost |
#Shares |
Value ($) |
#Shares Total |
SEC Form 4 |
| RUBLE CHRIS C | Chief Operating Officer | Aug 25 '23 | Buy | 69.77 | 1,433 | 99,992 | 28,276 | Aug 25 07:18 PM | | MITCHIN KYLE R | Chief People Officer | Aug 25 '23 | Buy | 68.63 | 1,093 | 75,013 | 18,896 | Aug 30 08:15 AM | | Ronning Nancee L | Chief Commercial Officer | Aug 22 '23 | Buy | 64.65 | 315 | 20,365 | 3,045 | Aug 30 08:00 AM | | Campbell C Robert | Director | Aug 18 '23 | Buy | 64.33 | 5,000 | 321,650 | 28,994 | Aug 18 02:49 PM | | Carlock Craig | Director | Aug 18 '23 | Buy | 64.84 | 1,600 | 103,744 | 16,550 | Aug 18 05:08 PM |
|
|
| |
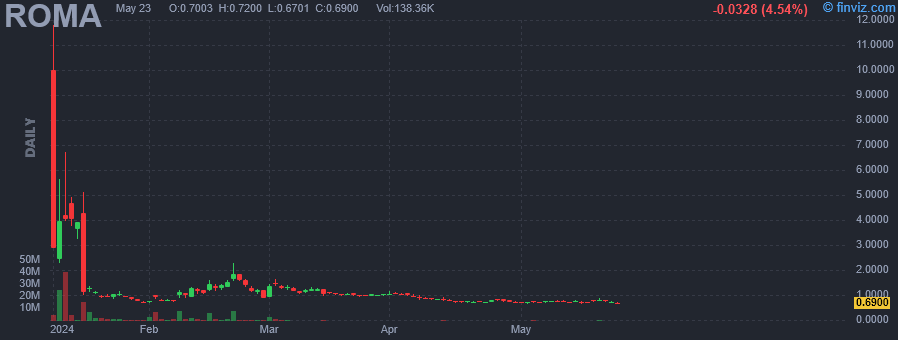 |
| Market Cap | 6.93M | EPS (ttm) | - |
| P/E | - | EPS this Y | - |
| Forward P/E | - | EPS next Y | - |
| PEG | - | EPS past 5Y | - |
| P/S | - | EPS next 5Y | - |
| P/B | - | EPS Q/Q | - |
| Dividend | - | Sales Q/Q | -18.10% |
| Insider Own | - | Inst Own | - |
| Insider Trans | - | Inst Trans | - |
| Short Float | 0.91% | Earnings | - |
| Analyst Recom | - | Target Price | - |
| Avg Volume | 1.01M | 52W Range | 0.68 - 11.80 |
|
|
|
|
Roma Green Finance Limited, through its subsidiaries, provides environmental, social, and governance (ESG); sustainability; and climate change related advisory services in Hong Kong and Singapore. It also offers sustainability program development, ESG reporting, corporate governance and risk management, climate change strategies and solutions, environmental audit, ESG rating support and shareholder communication, and education and training services. The company was founded in 2018 and is based in Wan Chai, Hong Kong. Roma Green Finance Limited operates as a subsidiary of Top Elect Group Limited. |
|
|
 |
| Market Cap | 327.50M | EPS (ttm) | 0.10 |
| P/E | 21.59 | EPS this Y | 48.89% |
| Forward P/E | - | EPS next Y | -95.65% |
| PEG | - | EPS past 5Y | -42.81% |
| P/S | 0.61 | EPS next 5Y | - |
| P/B | 10.48 | EPS Q/Q | -100.96% |
| Dividend | 1.79% | Sales Q/Q | -30.24% |
| Insider Own | 33.78% | Inst Own | 43.42% |
| Insider Trans | 0.00% | Inst Trans | 3.93% |
| Short Float | 20.67% | Earnings | Mar 05/a |
| Analyst Recom | 1.00 | Target Price | 8.90 |
| Avg Volume | 2.72M | 52W Range | 2.25 - 4.54 |
|
|
|
|
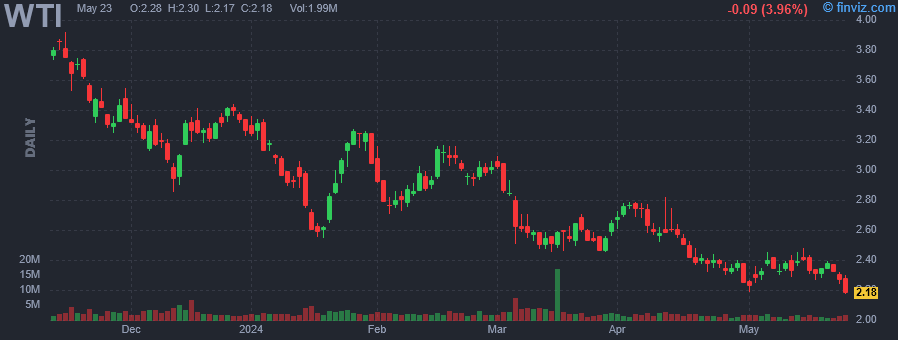
W&T Offshore, Inc. engages in the production, exploration, development, and acquisition of oil and natural gas properties. It focuses its operations in the Gulf of Mexico. The company was founded by Tracy W. Krohn in 1983 and is headquartered in Houston, TX. |
|
| |
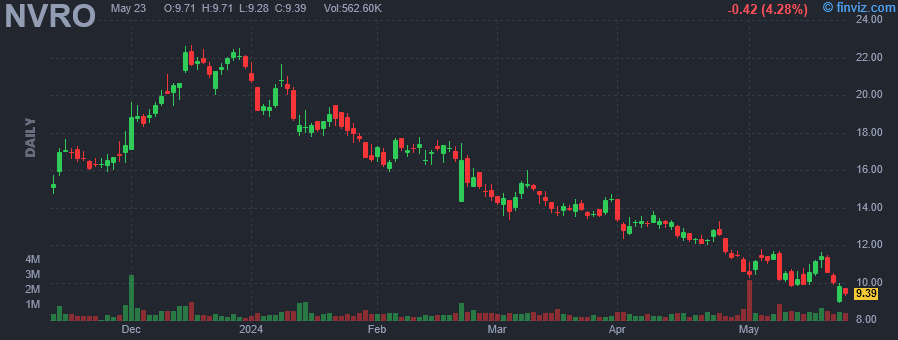 |
| Market Cap | 378.92M | EPS (ttm) | -2.57 |
| P/E | - | EPS this Y | -3.95% |
| Forward P/E | - | EPS next Y | 16.70% |
| PEG | - | EPS past 5Y | -9.37% |
| P/S | 0.89 | EPS next 5Y | - |
| P/B | 1.29 | EPS Q/Q | 54.23% |
| Dividend | - | Sales Q/Q | 2.05% |
| Insider Own | 4.94% | Inst Own | 105.32% |
| Insider Trans | 0.00% | Inst Trans | -1.53% |
| Short Float | 12.05% | Earnings | May 07/a |
| Analyst Recom | 3.28 | Target Price | 17.69 |
| Avg Volume | 491.14K | 52W Range | 10.54 - 29.77 |
|
|
|
|
Nevro Corp. engages in the development of medical devices. The firm focuses on providing products that improve the quality of life of patients suffering from debilitating chronic pain. It develops and commercializes the senza spinal cord stimulation system, an evidence-based neuromodulation platform for the treatment of chronic pain. The company was founded by Konstantinos Alataris in March 2006 and is headquartered in Redwood City, CA. |
| Insider Trading |
Relationship |
Date |
Transaction |
Cost |
#Shares |
Value ($) |
#Shares Total |
SEC Form 4 |
| McCormick Shawn | Director | Jun 07 '23 | Buy | 22.88 | 7,500 | 171,633 | 26,866 | Jun 09 04:37 PM |
|
|
|
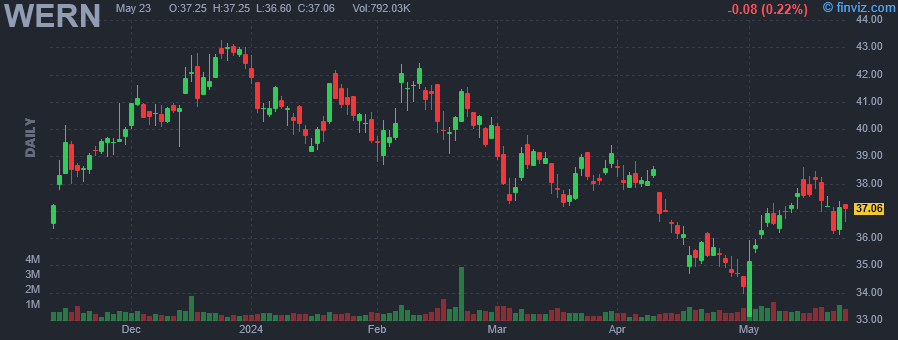 |
| Market Cap | 2.23B | EPS (ttm) | 1.31 |
| P/E | 26.85 | EPS this Y | -28.63% |
| Forward P/E | 14.87 | EPS next Y | 71.66% |
| PEG | 2.73 | EPS past 5Y | -5.45% |
| P/S | 0.69 | EPS next 5Y | 9.85% |
| P/B | 1.47 | EPS Q/Q | -82.10% |
| Dividend | 1.55% | Sales Q/Q | -7.64% |
| Insider Own | 4.35% | Inst Own | 86.39% |
| Insider Trans | 0.00% | Inst Trans | -1.87% |
| Short Float | 4.54% | Earnings | Apr 30/a |
| Analyst Recom | 2.60 | Target Price | 42.00 |
| Avg Volume | 685.47K | 52W Range | 33.97 - 47.27 |
|
|
| May-01-24 | Reiterated |
TD Cowen |
Buy |
$42 → $38 |
|
|
|
Werner Enterprises, Inc. engages in the provision of logistics services. It operates through the Truckload Transportation Services and Werner Logistics segments. The Truckload Transportation Services segment consists of one-way truckload and specialized services units such as the medium-to-long haul van fleet which provides a consumer non durable products and commodities in truckload quantities. The Werner Logistics segment provides non-trucking services to customers such as truck brokerages which uses contracted carriers to complete customer shipments. The company was founded by Clarence L. Werner in 1956 and is headquartered in Omaha, NE. |
| Insider Trading |
Relationship |
Date |
Transaction |
Cost |
#Shares |
Value ($) |
#Shares Total |
SEC Form 4 |
| WELLMAN ALEXI | Director | Mar 06 '24 | Buy | 38.00 | 100 | 3,800 | 6,493 | Mar 08 04:17 PM |
|
|
| |
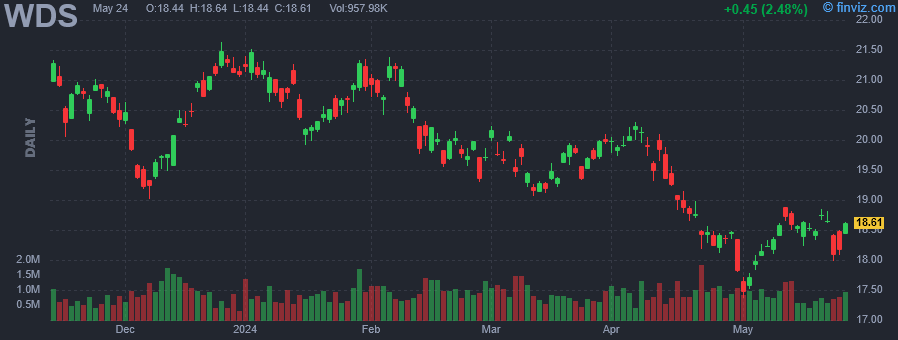 |
| Market Cap | 33.13B | EPS (ttm) | 0.87 |
| P/E | 20.12 | EPS this Y | -21.06% |
| Forward P/E | 13.27 | EPS next Y | -3.98% |
| PEG | - | EPS past 5Y | -9.98% |
| P/S | 2.35 | EPS next 5Y | - |
| P/B | 0.96 | EPS Q/Q | -101.62% |
| Dividend | 6.23% | Sales Q/Q | -41.04% |
| Insider Own | - | Inst Own | 1.68% |
| Insider Trans | - | Inst Trans | - |
| Short Float | 0.11% | Earnings | Feb 26/a |
| Analyst Recom | 2.12 | Target Price | 21.06 |
| Avg Volume | 963.59K | 52W Range | 17.80 - 25.84 |
|
|
|
|
Woodside Energy Group Ltd. engages in the exploration, evaluation, development, and production of hydrocarbon and oil and gas properties. It operates through the following segments: North West Shelf, Pluto, Australia Oil, Wheatstone, Development, and Others. The North West Shelf segment produces liquefied natural gas, pipeline natural gas, condensate, liquefied petroleum gas and crude oil from the North West Shelf ventures. The Pluto segment develops liquefied natural gas in assigned permit areas. The Australia Oil segment is involved in the exploration, evaluation, development, production and sale of crude oil in assigned permit areas. The Wheatstone segment is involved in the exploration, evaluation, and development of liquefied natural gas, pipeline natural gas, and condensate. The Development segment includes the exploration of gas resources in Scarborough, Sangomar, and other project areas. The Other segment is composed of the activities undertaken by exploration, international and Sunrise Business Units. The company was founded on July 26, 1954 and is headquartered in Perth, Australia. |
|
|
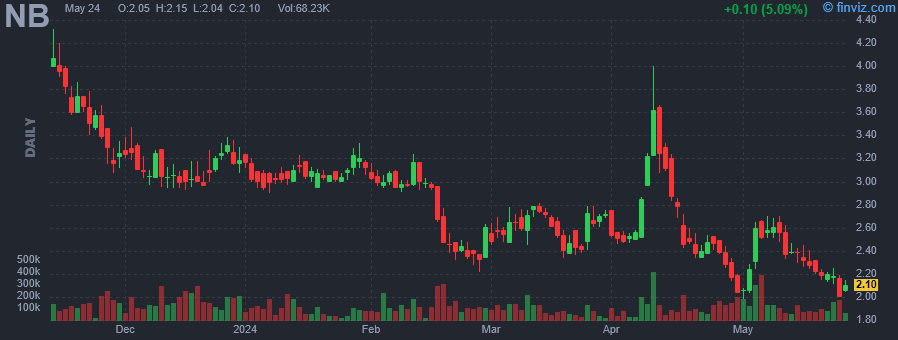 |
| Market Cap | 71.94M | EPS (ttm) | -1.34 |
| P/E | - | EPS this Y | 12.69% |
| Forward P/E | - | EPS next Y | - |
| PEG | - | EPS past 5Y | -28.40% |
| P/S | - | EPS next 5Y | - |
| P/B | - | EPS Q/Q | -13.47% |
| Dividend | - | Sales Q/Q | - |
| Insider Own | 12.21% | Inst Own | 5.32% |
| Insider Trans | 0.00% | Inst Trans | - |
| Short Float | 2.68% | Earnings | - |
| Analyst Recom | 1.00 | Target Price | 12.00 |
| Avg Volume | 118.40K | 52W Range | 2.03 - 6.39 |
|
|
|
|
NioCorp Developments Ltd. engages in the evaluation, acquisition, exploration, and development of mineral deposits. It focuses on a super alloy materials project in Southeast Nebraska for the production of niobium, scandium, and titanium. The company was founded on February 27, 1987 and is headquartered in Centennial, CO. |
| Insider Trading |
Relationship |
Date |
Transaction |
Cost |
#Shares |
Value ($) |
#Shares Total |
SEC Form 4 |
| Honan Scott | Chief Operating Officer | Nov 15 '23 | Option Exercise | 3.93 | 35,000 | 137,704 | 89,452 | Nov 17 04:30 PM | | Shah Neal S. | Chief Financial Officer | Nov 15 '23 | Option Exercise | 3.93 | 35,000 | 137,704 | 90,000 | Nov 17 04:30 PM | | Wightman Anna Castner | Director | Nov 15 '23 | Option Exercise | 3.93 | 30,000 | 118,032 | 59,362 | Nov 17 04:30 PM | | BELING DAVID COATES | Director | Nov 15 '23 | Option Exercise | 3.93 | 30,000 | 118,032 | 100,891 | Nov 17 04:31 PM |
|
|
|
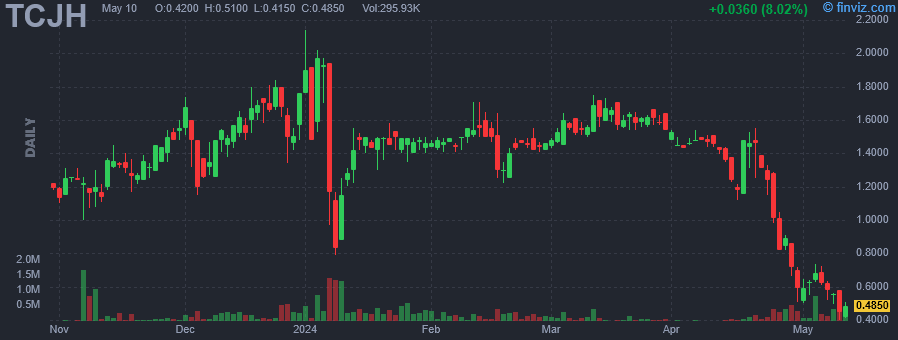 |
| Market Cap | 8.72M | EPS (ttm) | - |
| P/E | - | EPS this Y | - |
| Forward P/E | - | EPS next Y | - |
| PEG | - | EPS past 5Y | - |
| P/S | - | EPS next 5Y | - |
| P/B | - | EPS Q/Q | - |
| Dividend | - | Sales Q/Q | - |
| Insider Own | 52.77% | Inst Own | 0.63% |
| Insider Trans | 0.00% | Inst Trans | - |
| Short Float | 0.41% | Earnings | - |
| Analyst Recom | - | Target Price | - |
| Avg Volume | 132.82K | 52W Range | 0.51 - 10.76 |
|
|
|
|
Top KingWin Ltd. is a holding company that engages in the provision of corporate business training, corporate consulting, and advisory and transaction services. It primarily focuses on the offering capital market related education and support services through customized courses. The company was founded by Rui Lin Xu in 2020 and is headquartered in Guangzhou, China. |
|
|
