 |
| Market Cap | 31.94M | EPS (ttm) | -1.76 |
| P/E | - | EPS this Y | 1.32% |
| Forward P/E | 19.89 | EPS next Y | -87.01% |
| PEG | - | EPS past 5Y | - |
| P/S | 0.08 | EPS next 5Y | 20.00% |
| P/B | 0.24 | EPS Q/Q | -398.55% |
| Dividend | - | Sales Q/Q | 17.88% |
| Insider Own | 46.87% | Inst Own | 22.90% |
| Insider Trans | 0.00% | Inst Trans | - |
| Short Float | 7.44% | Earnings | - |
| Analyst Recom | 1.00 | Target Price | 6.50 |
| Avg Volume | 133.10K | 52W Range | 0.98 - 7.43 |
|
|
|
|
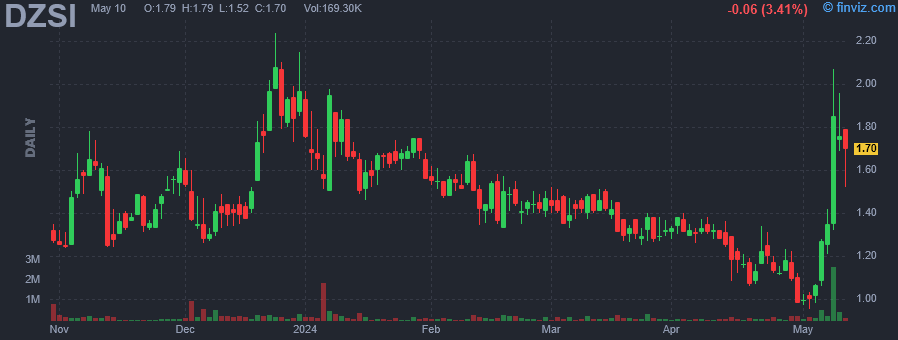
DZS, Inc. engages in the provision of packet-based mobile transport and broadband access solutions. It includes the research, development, test, sale, manufacture, and support of communications equipment in the following areas: broadband access, Ethernet switching, mobile front haul and back haul, passive optical LAN, and software defined networks (SDN) and network function virtualization (NFV) solutions. The company was founded in June 1999 and is headquartered in Plano, TX. |
| Insider Trading |
Relationship |
Date |
Transaction |
Cost |
#Shares |
Value ($) |
#Shares Total |
SEC Form 4 |
| Alonso Miguel | Chief Product Officer | Jun 10 '23 | Option Exercise | 0.00 | 6,250 | 0 | 19,039 | Jun 13 02:59 PM | | Ferguson Justin K. | Chief Legal Officer | Jun 10 '23 | Option Exercise | 0.00 | 12,500 | 0 | 38,797 | Jun 13 02:57 PM | | VOGT CHARLES D | President & CEO | Jun 10 '23 | Option Exercise | 0.00 | 14,816 | 0 | 109,068 | Jun 13 02:56 PM | | Kawecki Misty Dawn | Chief Financial Officer | May 30 '23 | Option Exercise | 0.00 | 4,138 | 0 | 26,245 | Jun 01 04:56 PM | | VOGT CHARLES D | President & CEO | May 30 '23 | Option Exercise | 0.00 | 18,391 | 0 | 102,096 | Jun 01 04:54 PM |
|
|
 |
 |
| Market Cap | 70.31M | EPS (ttm) | -0.00 |
| P/E | - | EPS this Y | - |
| Forward P/E | - | EPS next Y | - |
| PEG | - | EPS past 5Y | - |
| P/S | - | EPS next 5Y | - |
| P/B | 0.89 | EPS Q/Q | -197.91% |
| Dividend | - | Sales Q/Q | - |
| Insider Own | 54.10% | Inst Own | 5.82% |
| Insider Trans | 0.00% | Inst Trans | 5.84% |
| Short Float | 0.11% | Earnings | - |
| Analyst Recom | - | Target Price | - |
| Avg Volume | 86.95K | 52W Range | 2.00 - 19.75 |
|
|
|
|
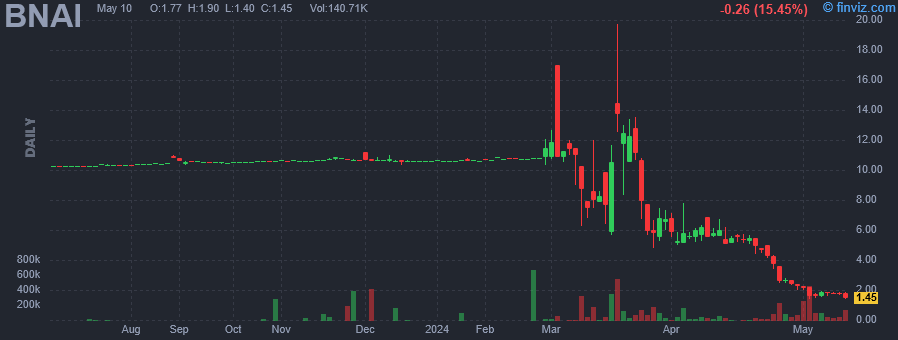
Brand Engagement Network, Inc. engages in the provision of conversational artificial intelligence assistants with the purpose of transforming engagement and analytics for businesses through security-focused, multimodal communication and human-like artificial intelligence assistants. The firm is also involved in delivering highly personalized, multi-modal artificial intelligence engagement with a focus on industries where there is a massive workforce gap and an opportunity to transform how consumers engage with networks, providers, and brands. The company is headquartered in Jackson, WY. |
|
|
 |
| Market Cap | 2.28B | EPS (ttm) | 0.81 |
| P/E | 61.01 | EPS this Y | 6.26% |
| Forward P/E | 7.00 | EPS next Y | 7.55% |
| PEG | 8.47 | EPS past 5Y | -19.25% |
| P/S | 1.67 | EPS next 5Y | 7.20% |
| P/B | 1.26 | EPS Q/Q | -0.33% |
| Dividend | - | Sales Q/Q | -1.72% |
| Insider Own | 1.75% | Inst Own | 102.13% |
| Insider Trans | -0.51% | Inst Trans | 1.82% |
| Short Float | 4.29% | Earnings | May 08/a |
| Analyst Recom | 1.78 | Target Price | 80.24 |
| Avg Volume | 320.78K | 52W Range | 49.99 - 75.58 |
|
|
| Today | Upgrade |
JP Morgan |
Neutral → Overweight |
$70 |
|
|
|
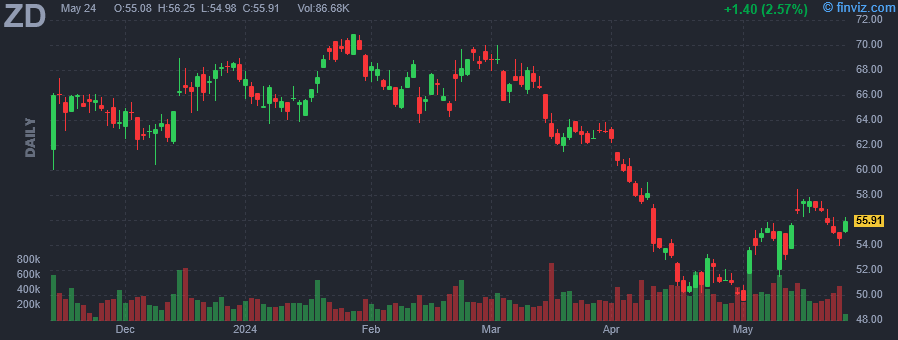
Ziff Davis, Inc. is a digital media and internet company. Its portfolio includes brands in technology, shopping, gaming and entertainment, connectivity, health, cybersecurity, and martech. It operates through the following segments: Digital Media, and Cybersecurity and Martech. The Digital Media segment specializes in the technology, shopping, gaming and entertainment, and healthcare markets, offering content, tools, and services to consumers and businesses. The Cybersecurity and Martech segment provides cloud-based subscription services to consumers and businesses including cybersecurity, privacy, and marketing technology. The company was founded by Jaye Muller and John F. Rieley in 1995 and is headquartered in New York, NY. |
| Insider Trading |
Relationship |
Date |
Transaction |
Cost |
#Shares |
Value ($) |
#Shares Total |
SEC Form 4 |
| ROSSEN JEREMY | EVP/General Counsel | Mar 13 '24 | Option Exercise | 0.00 | 191 | 0 | 10,561 | Mar 15 07:13 PM | | ROSSEN JEREMY | EVP/General Counsel | Mar 08 '24 | Option Exercise | 0.00 | 1,807 | 0 | 11,015 | Mar 12 08:13 PM | | Taki Layth | Chief Accounting Officer | Mar 08 '24 | Option Exercise | 0.00 | 1,205 | 0 | 3,891 | Mar 12 08:15 PM | | RICHTER BRET | Chief Financial Officer | Mar 08 '24 | Option Exercise | 0.00 | 3,695 | 0 | 11,964 | Mar 12 08:16 PM | | ROSSEN JEREMY | EVP/General Counsel | Mar 06 '24 | Option Exercise | 0.00 | 956 | 0 | 9,552 | Mar 08 09:11 PM |
|
|
| |
 |
| Market Cap | 40.73M | EPS (ttm) | -2.02 |
| P/E | - | EPS this Y | - |
| Forward P/E | - | EPS next Y | - |
| PEG | - | EPS past 5Y | 18.24% |
| P/S | 0.10 | EPS next 5Y | - |
| P/B | 0.66 | EPS Q/Q | -8772.38% |
| Dividend | - | Sales Q/Q | 15.58% |
| Insider Own | 26.47% | Inst Own | 44.24% |
| Insider Trans | 0.00% | Inst Trans | 1.44% |
| Short Float | 3.64% | Earnings | May 14/b |
| Analyst Recom | 3.00 | Target Price | 5.00 |
| Avg Volume | 28.15K | 52W Range | 2.05 - 4.00 |
|
|
|
|
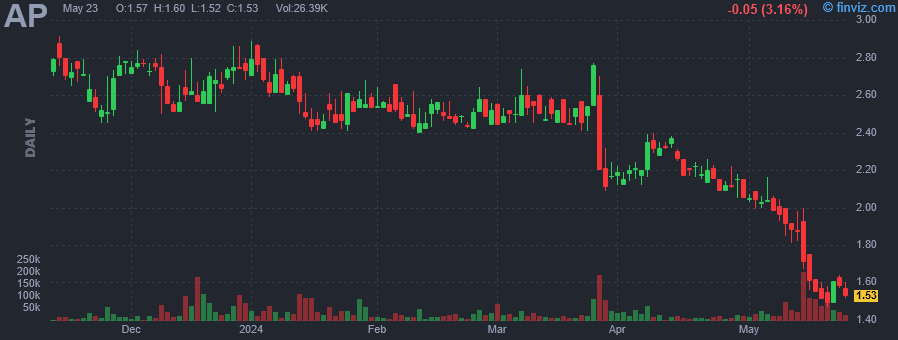
Ampco-Pittsburgh Corp. is engaged in the manufacture and sale of custom designed engineering products. It operates through the Forged and Cast Engineered Products, and Air and Liquid Processing segments. The Forged and Cast Engineered Products segment produces forged hardened steel rolls, cast rolls and open-die forged products. Forged hardened steel rolls are used primarily in cold rolling mills by producers of steel, aluminum and other metals. The Air and Liquid Processing segment includes the Aerofin, Buffalo Air Handling, and Buffalo Pumps divisions. The company was founded in 1929 and is headquartered in Carnegie, PA. |
| Insider Trading |
Relationship |
Date |
Transaction |
Cost |
#Shares |
Value ($) |
#Shares Total |
SEC Form 4 |
| McNair Darrell L | Director | Sep 13 '23 | Buy | 3.12 | 3,000 | 9,360 | 6,640 | Sep 20 12:46 PM | | DiSanto Frederick D. | Director | Jun 29 '23 | Buy | 2.99 | 7,399 | 22,123 | 47,177 | Jul 03 11:41 AM | | DiSanto Frederick D. | Director | Jun 28 '23 | Buy | 2.85 | 918 | 2,616 | 39,778 | Jul 03 11:41 AM | | DiSanto Frederick D. | Director | Jun 23 '23 | Buy | 2.94 | 2,000 | 5,880 | 38,860 | Jun 26 11:35 AM | | DiSanto Frederick D. | Director | Jun 22 '23 | Buy | 2.94 | 5,000 | 14,700 | 36,860 | Jun 26 11:35 AM |
|
|
|
 |
| Market Cap | 91.68M | EPS (ttm) | -19.93 |
| P/E | - | EPS this Y | 16.00% |
| Forward P/E | - | EPS next Y | 47.23% |
| PEG | - | EPS past 5Y | - |
| P/S | 0.02 | EPS next 5Y | 30.29% |
| P/B | - | EPS Q/Q | 27.87% |
| Dividend | 1.54% | Sales Q/Q | -14.12% |
| Insider Own | 4.35% | Inst Own | 82.91% |
| Insider Trans | 3.37% | Inst Trans | -5.89% |
| Short Float | 4.97% | Earnings | May 08/a |
| Analyst Recom | 2.67 | Target Price | 6.00 |
| Avg Volume | 397.02K | 52W Range | 2.61 - 18.71 |
|
|
|
|
Trinseo Plc engages in the manufacture and sale of plastics and latex binders. It operates through the following segments: Engineered Materials, Latex Binders, Base Plastics, Polystyrene, Feedstocks, and Americas Styrenics. The Engineered Materials segment produces rigid thermoplastic compounds and blends products, soft thermoplastic products, and cast and sheet products. The Latex Binders segment creates styrene-butadiene latex. The Base Plastics segment manufactures a variety of compounds and blends, the majority of which are for automotive applications. The Polystyrene segment offers a variety of general-purpose polystyrenes and high impact polystyrenes. The Feedstocks segment deals with the production of styrene monomers in order to provide secure sourcing of this key raw material to the company's other segments. The Americas Styrenics segment is composed of the operations of the company's owned joint venture with Chevron Phillips Chemical Company. The company was founded on October 8, 2021 and is headquartered in Wayne, PA. |
| Insider Trading |
Relationship |
Date |
Transaction |
Cost |
#Shares |
Value ($) |
#Shares Total |
SEC Form 4 |
| FARRELL MATTHEW | Director | Dec 14 '23 | Buy | 7.21 | 50,000 | 360,500 | 79,510 | Dec 18 04:05 PM | | Stasse David Phillip | EVP AND CFO | Sep 14 '23 | Buy | 8.89 | 15,000 | 133,350 | 105,552 | Sep 18 01:53 PM | | Desmond Jeanmarie F. | Director | Sep 13 '23 | Buy | 7.94 | 2,500 | 19,850 | 19,128 | Sep 13 03:01 PM | | Chaclas Angelo N. | SVP, CLO, CCO & CORP. SEC. | Sep 12 '23 | Buy | 8.07 | 20,000 | 161,400 | 88,508 | Sep 13 02:57 PM | | BOZICH FRANK A | CEO AND PRESIDENT | Sep 12 '23 | Buy | 8.07 | 8,000 | 64,560 | 192,653 | Sep 13 02:52 PM |
|
|
| |
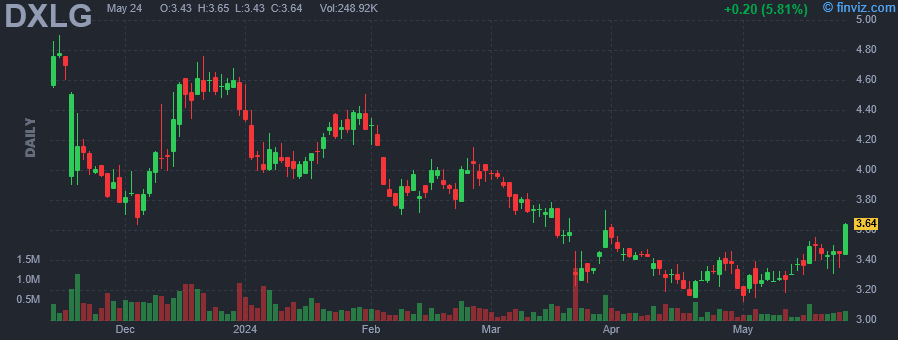 |
| Market Cap | 183.25M | EPS (ttm) | 0.43 |
| P/E | 7.35 | EPS this Y | -48.00% |
| Forward P/E | 10.53 | EPS next Y | 15.38% |
| PEG | 0.49 | EPS past 5Y | - |
| P/S | 0.35 | EPS next 5Y | 15.00% |
| P/B | 1.23 | EPS Q/Q | -33.23% |
| Dividend | - | Sales Q/Q | -4.68% |
| Insider Own | 12.16% | Inst Own | 82.67% |
| Insider Trans | -1.12% | Inst Trans | 8.28% |
| Short Float | 8.78% | Earnings | Mar 21/b |
| Analyst Recom | 2.00 | Target Price | 5.25 |
| Avg Volume | 270.78K | 52W Range | 3.15 - 5.36 |
|
|
|
|
Destination XL Group, Inc. is engaged in the retail of specialty products. It offers shirts, pants, shorts, outerwear, activewear, suiting, underwear and lounge, shoes, and accessories. It distributes its products under the following brand names: Destination X, DXL, DXL Men's Apparel, DXL Outlets, Casual Male XL, and Casual Male XL Outlets. It operates through the Stores, and Direct Businesses segments. The company was founded by Calvin Margolis and Stanley I. Berger in 1976 and is headquartered in Canton, MA. |
| Insider Trading |
Relationship |
Date |
Transaction |
Cost |
#Shares |
Value ($) |
#Shares Total |
SEC Form 4 |
| REATH JAMES | Chief Marketing Officer | Apr 01 '24 | Option Exercise | 0.00 | 2,583 | 0 | 13,463 | Apr 10 04:25 PM | | Stratton Peter H Jr. | EVP, CFO, Treasurer | Apr 01 '24 | Option Exercise | 0.00 | 4,560 | 0 | 231,948 | Apr 10 04:25 PM | | Molloy Robert S | General Counsel & Secretary | Feb 15 '24 | Option Exercise | 0.53 | 20,000 | 10,600 | 260,409 | Feb 16 04:30 PM | | Molloy Robert S | General Counsel & Secretary | Feb 15 '24 | Sale | 4.00 | 20,000 | 80,006 | 240,409 | Feb 16 04:30 PM | | Molloy Robert S | General Counsel & Secretary | Jan 11 '24 | Option Exercise | 0.53 | 20,000 | 10,600 | 260,409 | Jan 12 04:04 PM |
|
|
|
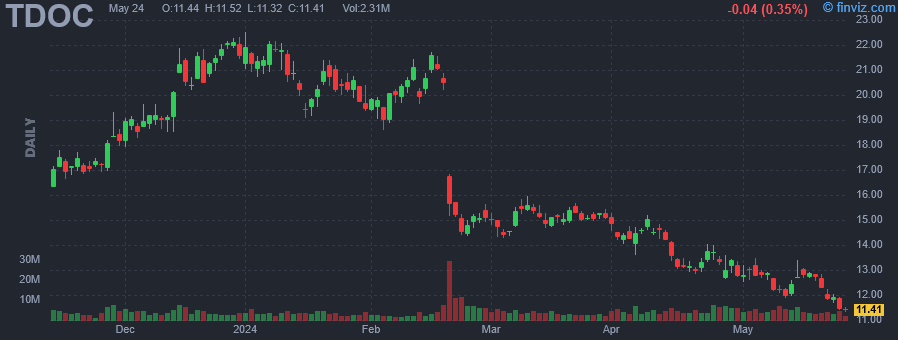 |
| Market Cap | 2.17B | EPS (ttm) | -1.40 |
| P/E | - | EPS this Y | 20.92% |
| Forward P/E | - | EPS next Y | 35.94% |
| PEG | - | EPS past 5Y | 1.91% |
| P/S | 0.83 | EPS next 5Y | - |
| P/B | 0.95 | EPS Q/Q | -14.90% |
| Dividend | - | Sales Q/Q | 2.68% |
| Insider Own | 1.10% | Inst Own | 72.57% |
| Insider Trans | -14.04% | Inst Trans | -3.01% |
| Short Float | 15.98% | Earnings | Apr 25/a |
| Analyst Recom | 2.55 | Target Price | 19.49 |
| Avg Volume | 5.20M | 52W Range | 12.65 - 30.41 |
|
|
|
|
Teladoc Health, Inc. engages in the provision of telehealthcare services using a technology platform via mobile devices, the Internet, video and phone. It operates through the following segments: Teladoc Health Integrated Care, BetterHelp, and Others. The Teladoc Health Integrated Care segment offers virtual medical services. The BetterHelp segment includes virtual mental health and other wellness services. The company was founded in June 2002, by George Byron Brooks, Michael Gorton, and Gary Wald and is headquartered in Purchase, NY. |
| Insider Trading |
Relationship |
Date |
Transaction |
Cost |
#Shares |
Value ($) |
#Shares Total |
SEC Form 4 |
| Trencher Daniel | CHIEF STRATEGY OFFICER | Apr 17 '24 | Sale | 13.21 | 1,000 | 13,210 | 26,192 | Apr 17 04:54 PM | | Nanis Nikolaos P. | Chief Technology Officer | Apr 02 '24 | Sale | 14.31 | 461 | 6,599 | 70,621 | Apr 03 04:05 PM | | Geshuri Arnnon | CHIEF PEOPLE OFFICER | Mar 25 '24 | Option Exercise | 2.73 | 7,500 | 20,475 | 45,970 | Mar 26 04:05 PM | | Geshuri Arnnon | CHIEF PEOPLE OFFICER | Mar 25 '24 | Sale | 15.06 | 7,500 | 112,950 | 38,470 | Mar 26 04:05 PM | | Trencher Daniel | CHIEF STRATEGY OFFICER | Mar 18 '24 | Sale | 15.18 | 1,000 | 15,180 | 27,192 | Mar 18 04:56 PM |
|
|
| |
 |
| Market Cap | 161.46M | EPS (ttm) | 0.12 |
| P/E | 27.67 | EPS this Y | 38.33% |
| Forward P/E | 10.44 | EPS next Y | 92.77% |
| PEG | 2.77 | EPS past 5Y | -0.10% |
| P/S | 0.55 | EPS next 5Y | 10.00% |
| P/B | 1.59 | EPS Q/Q | -168.29% |
| Dividend | 5.39% | Sales Q/Q | -10.76% |
| Insider Own | 30.15% | Inst Own | 62.94% |
| Insider Trans | 0.00% | Inst Trans | -8.78% |
| Short Float | 0.48% | Earnings | May 09/a |
| Analyst Recom | 1.00 | Target Price | 7.97 |
| Avg Volume | 110.28K | 52W Range | 3.35 - 5.87 |
|
|
|
|
Information Services Group, Inc. engages in the provision of sourcing advisory services. It operates through the following geographical segments: Americas, Europe, and Asia Pacific. The firm offers business advisory, human resources technology and delivery services, organizational change management and software advisory services to the aerospace, defense, automotive, banking, energy, healthcare, and insurance industries. The company was founded by Michael P.Connors in 2006 and is headquartered in Stamford, CT. |
| Insider Trading |
Relationship |
Date |
Transaction |
Cost |
#Shares |
Value ($) |
#Shares Total |
SEC Form 4 |
| CONNORS MICHAEL P | CHAIRMAN & CEO | Sep 05 '23 | Sale | 5.00 | 3,688 | 18,440 | 5,164,134 | Sep 06 05:05 PM | | Lavieri Todd D. | VICE CHAIRMAN | Aug 31 '23 | Sale | 5.25 | 15,000 | 78,750 | 886,721 | Aug 31 04:15 PM | | Lavieri Todd D. | VICE CHAIRMAN | Aug 30 '23 | Sale | 5.06 | 10,000 | 50,600 | 901,721 | Aug 31 04:15 PM | | CONNORS MICHAEL P | CHAIRMAN & CEO | Aug 29 '23 | Sale | 5.00 | 43,411 | 217,055 | 5,213,042 | Aug 30 05:11 PM | | Lavieri Todd D. | VICE CHAIRMAN | Aug 29 '23 | Sale | 5.00 | 8,525 | 42,625 | 911,721 | Aug 31 04:15 PM |
|
|
|
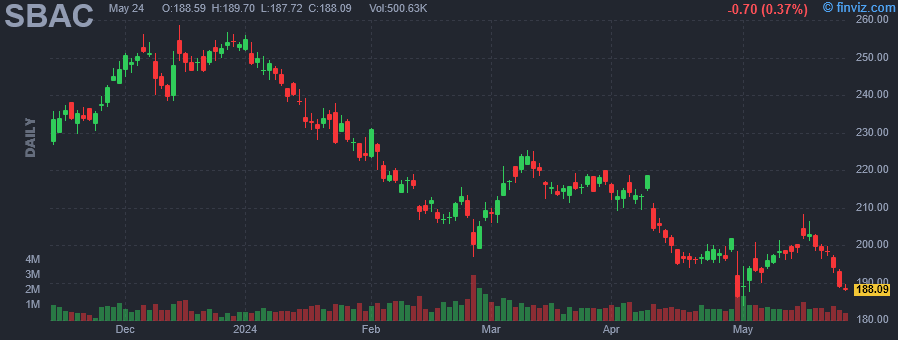 |
| Market Cap | 20.45B | EPS (ttm) | 5.10 |
| P/E | 37.07 | EPS this Y | 47.41% |
| Forward P/E | 23.81 | EPS next Y | 16.90% |
| PEG | 2.87 | EPS past 5Y | 62.23% |
| P/S | 7.59 | EPS next 5Y | 12.90% |
| P/B | - | EPS Q/Q | 53.30% |
| Dividend | 2.09% | Sales Q/Q | -2.61% |
| Insider Own | 1.08% | Inst Own | 98.99% |
| Insider Trans | -13.64% | Inst Trans | -0.20% |
| Short Float | 2.37% | Earnings | Apr 29/a |
| Analyst Recom | 1.50 | Target Price | 247.73 |
| Avg Volume | 1.08M | 52W Range | 185.23 - 263.08 |
|
|
|
|
SBA Communications Corp. is a real estate investment trust, which engages in the provision of wireless communications infrastructures. It operates through the following business segments: Domestic Site Leasing, International Site Leasing, and Site Development. The Domestic Site Leasing segment includes AT&T, Sprint, T-Mobile, and Verizon Wireless. The International Site Leasing segment acquires and develops towers. The Site Development segment is involved in consulting and construction activities. The company was founded by Steven E. Bernstein in 1989 and is headquartered in Boca Raton, FL. |
| Insider Trading |
Relationship |
Date |
Transaction |
Cost |
#Shares |
Value ($) |
#Shares Total |
SEC Form 4 |
| BERNSTEIN STEVEN E | Director | Apr 29 '24 | Option Exercise | 132.00 | 1,977 | 260,964 | 4,880 | May 01 06:15 PM | | LANGER JACK | Director | Apr 19 '24 | Option Exercise | 132.00 | 1,977 | 260,964 | 8,619 | Apr 23 06:15 PM | | SILBERSTEIN JASON V | EVP - SITE LEASING | Mar 06 '24 | Option Exercise | 108.36 | 17,499 | 1,896,274 | 51,460 | Mar 08 06:31 PM | | STOOPS JEFFREY | CHAIRMAN | Mar 06 '24 | Option Exercise | 0.00 | 3,468 | 0 | 160,631 | Mar 08 06:30 PM | | Cavanagh Brendan Thomas | PRESIDENT AND CEO | Mar 06 '24 | Option Exercise | 0.00 | 1,445 | 0 | 49,465 | Mar 08 06:30 PM |
|
|
|
 |
| Market Cap | 16.51M | EPS (ttm) | 1.53 |
| P/E | 5.78 | EPS this Y | -22.40% |
| Forward P/E | - | EPS next Y | - |
| PEG | - | EPS past 5Y | 6.00% |
| P/S | 5.00 | EPS next 5Y | - |
| P/B | 5.44 | EPS Q/Q | -76.50% |
| Dividend | 10.86% | Sales Q/Q | -72.70% |
| Insider Own | - | Inst Own | 11.80% |
| Insider Trans | - | Inst Trans | 2.33% |
| Short Float | 0.37% | Earnings | - |
| Analyst Recom | - | Target Price | - |
| Avg Volume | 11.05K | 52W Range | 8.85 - 29.50 |
|
|
|
|
Mesa Royalty Trust owns net overriding royalty interests in various oil and gas producing properties in the United States. The company has interests in properties located in the Hugoton field of Kansas; and the San Juan Basin of Northwestern New Mexico and Southwestern Colorado. Mesa Royalty Trust was founded in 1979 and is based in Houston, Texas. |
|
|
