Volatility-Based Indicators
The last major part of technical indicators is the group of volatility-based indicators. These indicators monitor changes in market price and compare them to historical values. In case the market price starts to change faster than would be appropriate according to the average of historical volatility or if the price crosses outside of a given range, the indicators will signal an oversold/overbought market.
Introduction
Volatility is in finance represented by the standard deviation computed from the past (historical) prices. It means that the faster the price in the market changes, the higher is the volatility of that market. We recognize 2 kinds of volatility: historical volatility and implied volatility. Historical volatility is volatility that has really been measured and represents real changes in price. Implied volatility is derived from the pricing formula in such a way that we put in the formula the current price of the instrument. It is mostly used for options. It informs us about the volatility that is implied by the option's price for the time of option's maturity. However, for the computation of indicators used in mainstream technical analysis, historical volatility is used.
Purpose and use
The purpose of volatility-based indicators is very similar to the purpose of oscillators: to detect imbalances in the market and generate signals that can help us capitalize on these imbalances. These indicators also generate overbought/oversold signals.
If the price is rising too fast compared to the historical development, it can easily reach a stage in which the rise is no more sustainable. Volatility–based indicators inform us precisely about such situations.
Trading signals
A common trait of all volatility-based indicators is that they generate buy and sell signals that are based on the concept of overbought/oversold market (just like in case of oscillators). In case the price crosses above the upper bound of the range, in which it should be present according to the trends in historical data, a sell signal is generated. Conversely, if the price crosses under the lower bound of the range, a buy signal is generated.
Pros and cons
A signficant advantage of this type of indicators is constituted by the fact that they can clearly show that the rise or fall of the price is too steep as compared to previous periods and hence it is highly probable that it has either to slow down or stop completely. That's why these indicators can complement other technical analysis indicators quite well.
On the other hand, these indicators have the disadvantage of being based only on one thing – the price. They do not reflect any other data (for example as opposed to the volume-based indicators, which take into account both the price and the volume traded in the market). It is also possible that in case some extremely good news about company's fundamentals reaches the market, the price may keep rising in spite of all the signals generated by volatility-based indicators, as these do not reflect information about fundamentals.
Types of volatility-based indicators
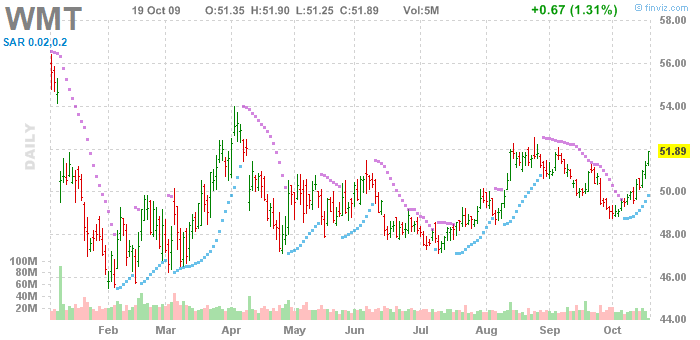
Parabolic SAR (Stop And Reverse) indicator was developed by the famous technical analyst Welles Wilder. In the price chart it takes a form of several dots aligned in shape of a parabola (hence the name Parabolic SAR), which are placed either above or below the current price. The purpose of this indicator is to identify the points, whose attainment implies the end of the current trend or its reversal.
Parabolic SAR is by default computed one day in advance. It means that from today's data we compute the Parabolic SAR for tomorrow. It is computed according to the formula:
Tommorow's SAR = Today's SAR + acceleration factor * (extreme point - today's SAR)
For the acceleration factor, the constant of 0.02 is usually used. This factor determines, how fast will the SAR value apporach the price (converge). Attaining a new high in an uptrend (or a new low in a downtrend) increases the acceleration factor by 0.02. As the upper limit for the acceleration factor, the number 0.20 is usually set. For the extreme point, the value of the last high during an uptrend (or the last low during the downtrend) is taken as the extreme point.
2 specific issues can emerge during the SAR's computation. If the SAR's value for the next day lies within today's or yesterday's price range, the value has to be lowered to the lower bound of this range (i.e. the price low). Further, SAR's values may lie above or even within tomorrow's price range. This signals a trend reversal and thus also a need to change the computation of SAR. If this happens during the uptrend, it means a change to the downtrend. In this case, we start to compute the SAR by using the lows for extreme points and we decrease the acceleration factor to the original value of 0.02.
The signals yielded by the Parabolic SAR are very simple.
In case the SAR is under current market price, there is an upward trend in the market.
If Parabolic SAR is above the current price, there is a downward trend in the market.
Hence, crossing under the current price can be considered a buy signal.
Conversely, if SAR crosses above market price, it implies a sell signal.
SAR is often used in the market for analysis of shorter time periods. However, the main problem of this indicator is that it works properly only in a trending environment. In case there is no clear trend in the market, Parabolic SAR tends to yield a lot of false signals. According to the author of this indicator Welles Wilder, SAR works only about 30% of the time. That's why most traders combine SAR with other indicators that measure trend's strength, such as ADX.
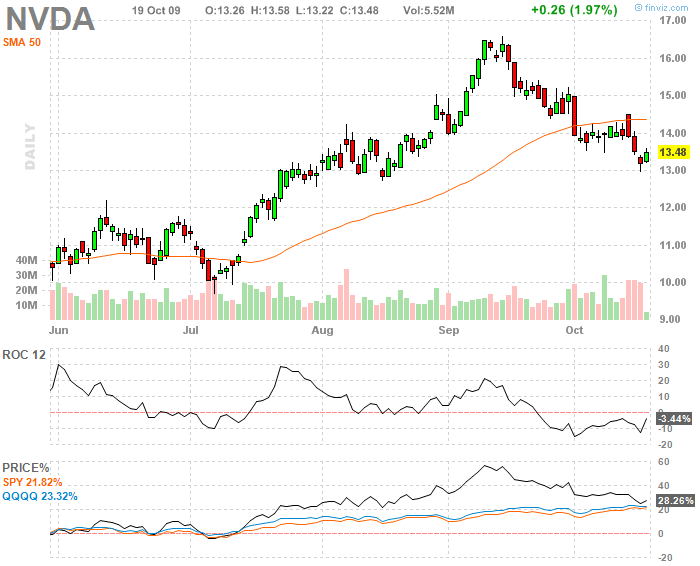
ROC is a technical indicator that measures the percentage change between current price and the price from x –days ago (most often 10). ROC for the 10-day period is computed as follows:
ROC =[(today's close –close from 10 days ago) / close from 10 days ago] *100
If ROC is rising in positive numbers, price is rising faster, and buying pressure is increasing. Conversely, if ROC is decreasing, buying pressure is decreasing, as well, which means that the price rise is slowing down.
If ROC is negative, it implies selling pressure, and hence a decrease in price. The more negative ROC is, the higher is the selling pressure and thus the faster is the decline in price.
ROC'S crossing above 0 is often considered to represent a a buy signal. Conversely, a sell signal occurs when the indicator crosses under 0. However, the chart of ROC is often used for chart analysis, which can also generate trading signals (e.g breaking a trendline). Besides, if ROC attains extremely high/low values compared to the historical data, it can signal an overbought/ oversold condition in the market.
Besides, ROC can be also used to find divergences with the market price.
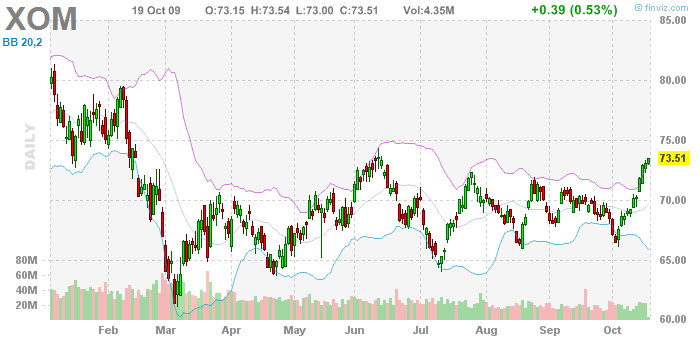
This indicator was developed in 1980's by John Bollinger. In the chart, it takes the form of three lines that constitute a price range. One of the lines is represented by a moving average of market price. The other two lines take the values of the moving average increased (in case of the second line decreased) by the value of two standard deviations for the particular period. Thus, each of these lines is placed two standard deviations away from the moving average. Usually, the moving averages (and hence also the standard deviation) are computed for the period of 20 days. According to statistical theory, the market price should be inside this range for 95% of the time.
When the price moves outside of the range determined by Bollinger bands, it is considered an extreme situation where the market is either overbought (in case the price is above the upper bound of the range) or oversold (if price is under the lower bound of the range).
Hence, if the price crosses above the upper bound, it is considered a sell signal and conversely,
if it crosses under the lower bound, it is considered a buy signal.
Bollinger bands are often used to set the exit point from a trade, when the target prices are being set either a little above the upper bound (for buying) or a little under the lower bound (for selling).
Bollinger bands differ from similar indicators such as Keltner bands or Envelopes in such a way that the width of the range is not constant, but it changes according to historical volatility. If volatility increases, the band becomes wider and conversely, if prices fluctuate less, the band becomes narrower.
According to some traders a significant widening of the range signals the end of a trend, while a significant narrowing of the range implies the start of a new trend.