Volume-Based Indicators
Volume-based indicators represent another important group of indicators used in technical analysis. They help us to spot even very small changes in volume traded in the market, which often precede a trend reversal. Information yielded by these indicators is most valuable during the last stages of a trend.
Introduction
The notion "volume" denotes the overall amount of contracts (stocks, currency lots or futures) that was traded in the market during the given period of time. Volume can be viewed according to selected timeframe, i.e. we can view the volume traded for one minute, one hour or one day.
Technical analysts view volume as an indicator, which informs us about the pressure on change of the price. If volume is high, the pressure to change the price in direction of the current trend is high, which implies that the trend will probably remain in effect for some time. On the other hand, when volume is low, pressure to change the price is low as well, which means that the current trend will probably end soon.
This theory is based on the premise that higher volume traded in the market means that more traders are willing to execute their trades at the current prices. They either believe that current pricing of the contracts is correct or that the trend will still remain in effect for some time. Conversely, if the volume is low, there are only few people willing to execute their trades at the current prices, which means that they either believe that the current pricing of the contract is inadequate or that the trend is going to reverse soon.
This implies that the volume should be rising and be higher when the price is moving in the direction of the trend. For example, if there is an upward trend in the market, then the volume for the days when prices were rising should be higher than for the days where prices were falling. If this is not the case, a divergence between volume and price exists. Such a divergence often precedes the end of the trend.
Purpose and use
Volume-based indicators can be just like the volume considered both leading and confirming indicators. This means that they can detect changes in the trend even before they manifest themselves, but they can also be used to confirm or reject signals generated by other indicators or technical analysis methods (e.g. chart patterns).
Besides, many traders believe that volume precedes the price. According to this idea, every significant move in price should be preceded by either a rise in volume (if a new trend is emerging) or a fall in volume (if a trend is ending).
Some of the volume-based indicators function as oscillators, whereby they help the trader to determine the time when the price is changing very fast and a correction is impending by generating the overbought /oversold signals.
However, probably the most common use of these indicators is represented by finding divergences between price and volume. If the price is still reaching new highs, but the volume is dropping, there is a bearish divergence in the market, which usually precedes the reversal of the upward trend. Conversely, if the price keeps attaining new lows, but the volume is dropping, there is a bullish divergence, which precedes a trend reversal and thus can be considered a buy signal.
Pros and cons
The main advantage of this group of indicators compared to other indicators or methods is that they take into account the two most important kinds of data available in the market, namely the price and the volume. Almost all other indicators take into account only the price. Hence, in theory, volume-based indicators should provide us with better and more precise trading signals.
On the other hand, volume can also distort generated signals, which happens mainly when the trend starts on low volume, which increases only gradually. That's why these indicators should be used together with other tools of technical analysis.
Types of Volume–Based Indicators
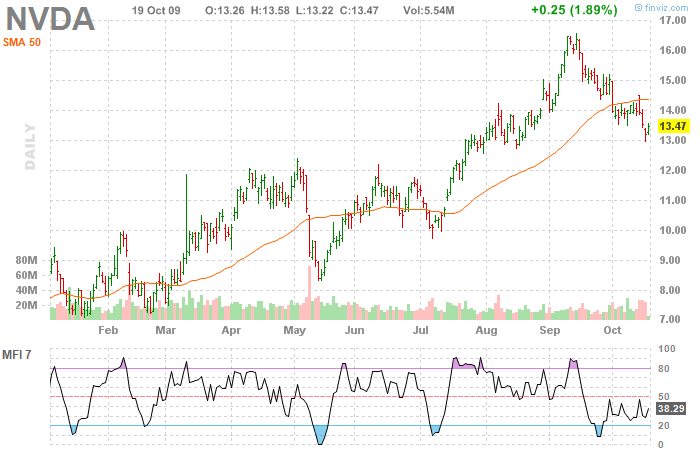
MFI is a special kind of oscillator that reflects changes in price as well as changes in volume in the particular market. Like most of the oscillators, it is primarily used to detect overbought/oversold stages of the market, but it can be also used to find divergences between MFI and price. MFI is computed as follows:
We first compute the typical price for a given day:
Typical price= (day's high + day‘s low + day's close)/3
Subsequently, we use the typical price to compute the money flow for our market on the given day:
Money flow = typical price for the day X volume traded on the day
The money flow approximates to some extent the value of stocks that were traded during the day. We compute money flow for all the days in our selected period (usually 14 days). After this we separate the days into the days with positive money flow (i.e. the days on which the typical price was higher than the previous day's typical price) and the days with negative money flow (typical price lower than the previous day's typical price). In case the day's typical price is equal to the previous day's typical price, the day is ignored.
Positive money flow represents buyers' confidence about rising prices.
Conversely, negative money flow represents sellers' confidence about falling prices.
Subsequently, we compute the money ratio:
Money ratio = (sum of positive money flows ) / (sum of negative money flows)
Finally, we compute the MFI itself as:
MFI = 100 - (100/ (1 + money ratio))
MFI can reach the values from 0 to 100. It works like a standard oscillator and is very similar to RSI.
Readings above 80 represent the overbought zone and thus constitute a sell signal.
Conversely, if the indicator reaches values under 20, it implies an oversold zone and thus represents a buy signal.
Divergences are found in the same manner as with other oscillators. For example, if the price reaches a new, higher high, but the MFI does not attain a new high or even decreases, it constitutes a bearish divergence, which precedes the end of the trend. Similarly, if prices during a downtrend keep reaching new lows, but the MFI does not, a bearish divergence is in place, which usually precedes the end of a downward trend.
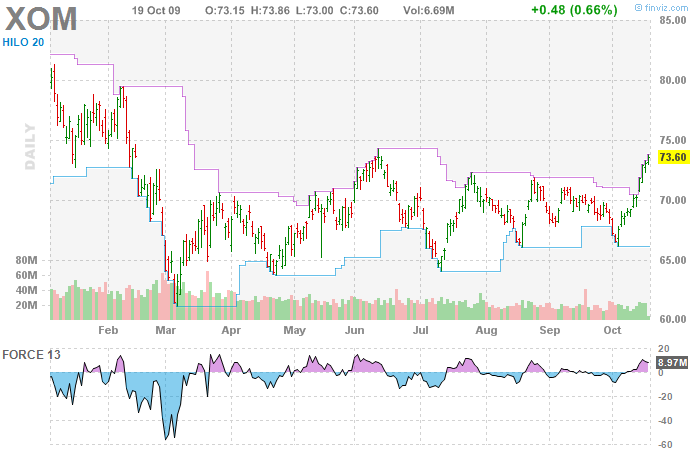
Is an indicator developed by the famous trader Alexander Elder, which measures trend's strength, while recognizing its direction. It reflects both price and volume traded in the market. Force index's values represent buying or selling pressure in the market. If the values are very high (and positive), it means that there is a big buying pressure in the market that is pushing the price upward, and that's why a strong upward trend is in effect. Conversely, very low negative values indicate selling pressure and thus a strong downward trend. Force Index is computed according to this formula:
Force index = (today's close – previous close)* today's volume
The result of this computation is smoothed by the means of an exponential moving average in order to decrease indicator's volatility.
However, Force Index is most often present in the charts in form of a histogram, whose midpoint value is 0. Most traders buy in case the exponential moving average of the Force index is negative and conversely, they sell if this average turns positive. However, according to Elder, the trades should not be made against the direction of the trend that is represented by 13-day exponential moving average of Force index.
If the 13-day average of Force index is positive, traders wait for the 2-day average to cross under 0, in order to be able to buy cheaply and enter into the market in the direction of the trend.
Conversely, if the 13-day average is negative, traders wait for the 2-day average to cross above 0, in order to be able to start selling.
In case the 13-day average is positive, the market is controlled by buyers, who expect the price to rise and hence It is better to buy.
On the other hand, if the 13-day average turns negative, market is controlled by sellers who expect the price to drop. This can constitute a sell signal.
Some traders seek to find divergences between price and Force index and trade accordingly. However, Force index is most commonly used together with other indicators, especially with the moving averages.