|
|
|

|
|||||
|
|
|
The earnings release from Nvidia NVDA is the true highlight of this week’s earnings docket, though there are a few other bellwethers on deck to report results as well, including Best Buy BBY, Ulta Beauty ULTA, and others. We have more than 100 companies reporting results this week, including 15 S&P 500 members.
It is no exaggeration to say that Nvidia has emerged as a leader of the broader artificial intelligence (AI) ecosystem, with its chips running the models. One could envision other chipmakers eventually developing their own offerings. But at this point, Nvidia’s chips are practically unrivalled in running the models.
Nvidia shares had struggled earlier in the year, as sentiment on the AI space soured in the aftermath of the DeepSeek announcement in January. But it has been hard to keep the stock down for any extended period, as its recent performance shows. The chart below shows the year-to-date performance of Nvidia shares relative to the S&P 500 index, the Mag 7 group, and the broader Zacks Tech sector.
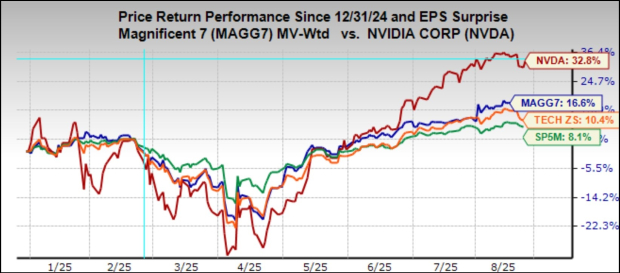
Nvidia is expected to bring in $1.00 in EPS on $46.03 billion in revenues, representing year-over-year changes of +47.1% and +53.2%, respectively. Estimates for the quarter (fiscal quarter ended in July) have been stable, though estimates for the full year have modestly ticked up (fiscal year ends in January).
Shares of this $4 trillion-plus market cap chipmaker aren’t cheap, but they are hardly the nose-bleed valuation of a couple of years back, as the chart below shows.
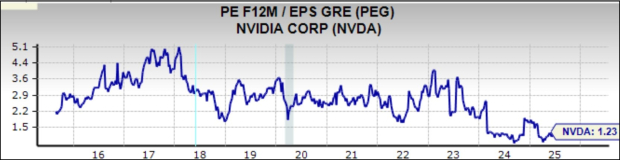
As you can see here, the stock is trading at 1.23X on a forward PEG basis, which compares to a 10-year high of 5.1X, a low of 0.74X, and a median of 2.78X.
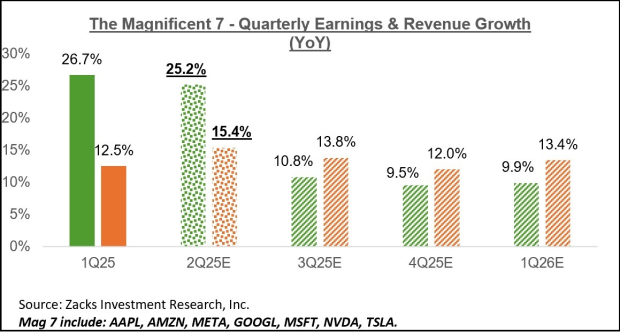
With Nvidia as the only Mag 7 member that has yet to report Q2 results, earnings for the group are on track to increase by +25.2% from the same period last year on +15.4% higher revenues.
You can see this Q2 earnings growth in the chart below, which also shows the deceleration in the Mag 7 group’s earnings growth over the coming periods.
Beyond Nvidia, the earnings focus will remain on the retail space, with Best Buy BBY, Dollar General DG, and Ulta Beauty ULTA as the notable retailers coming out with results.
With respect to the Retail sector 2025 Q2 earnings season scorecard, we now have results from 27 of the 32 retailers in the S&P 500 index. Regular readers know that Zacks has a dedicated stand-alone economic sector for the retail space, which is unlike the placement of the space in the Consumer Staples and Consumer Discretionary sectors in the Standard & Poor’s standard industry classification.
The Zacks Retail sector includes not only Walmart, Target, and other traditional retailers, but also online vendors like Amazon AMZN and restaurant players.
Total Q2 earnings for these 27 retailers that have reported are up +12.9% from the same period last year on +6.6% higher revenues, with 74.1% beating EPS estimates and an equal proportion beating revenue estimates.
The comparison charts below put the Q2 beats percentages for these retailers in a historical context.
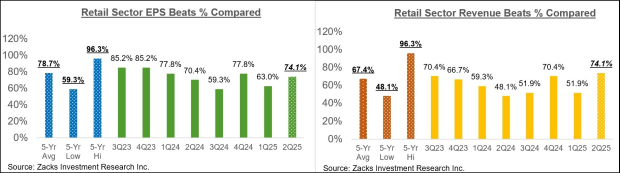
As you can see above, the Q2 EPS beats percentages for these Retail sector companies of 74.1% is tracking below the 20-quarter average for this group of retailers of 78.7%. The revenue beats percentages of 74.1%, on the other hand, compares favorably with the 20-quarter average for the group of 67.4%.
With respect to the elevated earnings growth rate at this stage, we like to show the group’s performance with and without Amazon, whose results are among the 27 companies that have reported already. As we know, Amazon’s Q2 earnings were up +37.9% on +13.3% higher revenues, as it beat EPS and top- line expectations.
As we all know, digital and brick-and-mortar operators have been converging for some time now, with Amazon now a sizable brick-and-mortar operator after acquiring Whole Foods, and Walmart a growing online vendor. This long-standing trend received a significant boost from the COVID-19 lockdowns.
The two comparison charts below display Q2 earnings and revenue growth in relation to other recent periods, both with Amazon’s results (left-side chart) and without Amazon’s numbers (right-side chart).
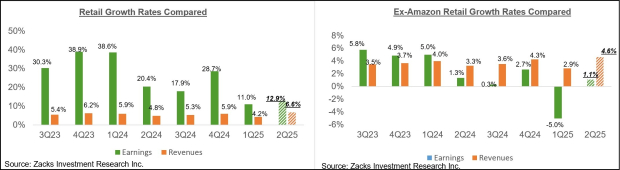
As you can see above, earnings for the group outside of Amazon are up +1.1% on a +4.6% top-line gain, which represents a notable improvement from what we have seen from this ex-Amazon group in the preceding period.
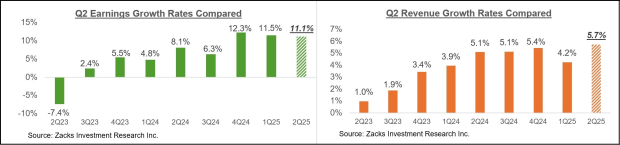
Through Friday, August 22nd, we have seen Q2 results from 477 S&P 500 members or 95.4% of the index’s total membership. Total earnings for these 477 index members are up +11.1% from the same period last year on +5.7% revenue gains, with 80.3% of the companies beating EPS estimates and 78.8% beating revenue estimates.
The comparison charts below put the Q2 earnings and revenue growth rates for these index members in a historical context.
The comparison charts below put the Q2 EPS and revenue beats percentages in a historical context.
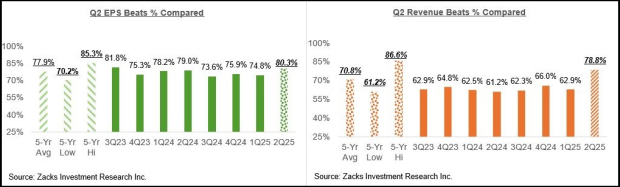
As you can see here, the EPS and revenue beats percentages are tracking above historical averages, with the outperformance on the revenues front particularly notable.
Looking at Q2 as a whole, combining the actuals from the 477 S&P 500 members with estimates for the still-to-come companies, the expectation is that earnings will be up +12.1% from the same period last year on +6.1% higher revenues, which would follow the +12.2% earnings growth on +4.6% revenue gains in the preceding period.
The chart below shows current earnings and revenue growth expectations for 2025 Q2 in the context of where growth has been over the preceding four quarters and what is currently expected for the following three quarters.
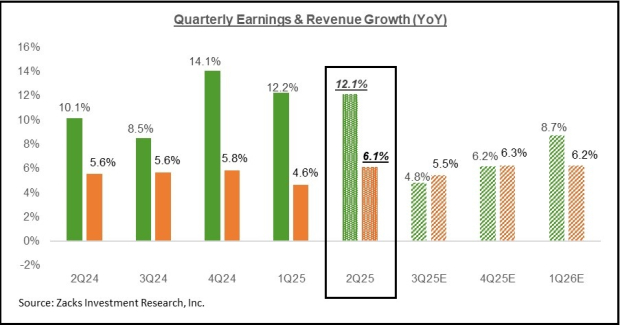
As you can see above, earnings for the current period (2025 Q3) are expected to be up +4.8% from the same period last year on +5.5% higher revenues.
We noted in recent weeks that estimates for the current period have notably firmed up, as you can see in the chart below.
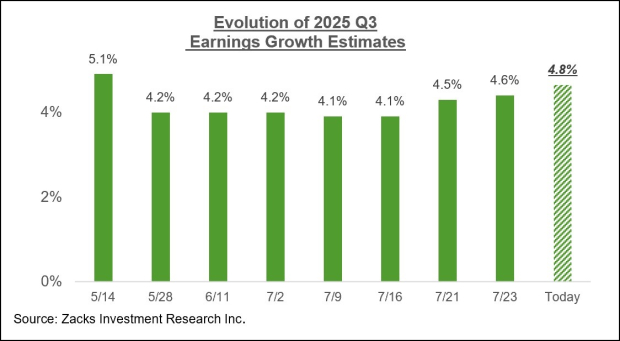
Since the start of the period, estimates have increased for 5 of the 16 Zacks sectors. These include Tech, Finance, Energy, Retail, and Conglomerates. On the negative side, estimates remain under pressure for the remaining 11 sectors, with the biggest pressure at the Medical, Transportation, Basic Materials, Consumer Discretionary, Consumer Staples, and others.
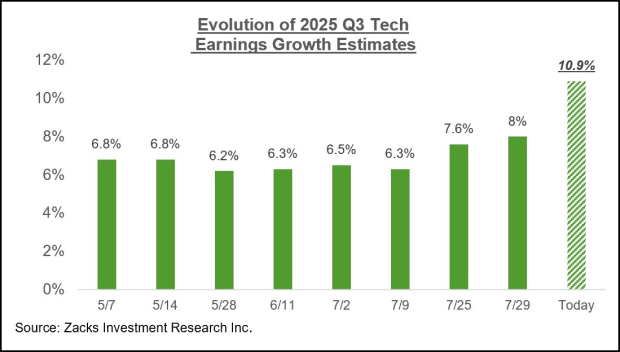
The chart below shows how Tech sector earnings estimates for the period have evolved since the quarter got underway.
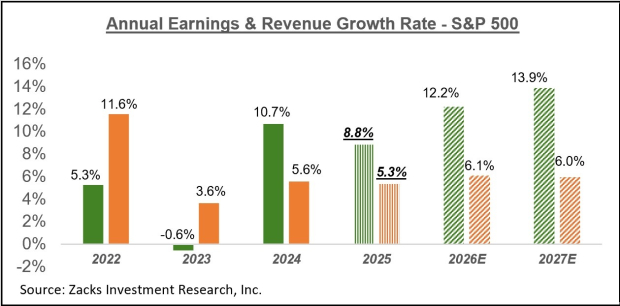
The chart below shows the overall earnings picture on a calendar-year basis.
For more details about the evolving earnings picture, please check out our weekly Earnings Trends report here >>>> Analyzing the Q2 Earnings Season Scorecard
Want the latest recommendations from Zacks Investment Research? Today, you can download 7 Best Stocks for the Next 30 Days. Click to get this free report
This article originally published on Zacks Investment Research (zacks.com).
| 25 min | |
| 56 min | |
| 1 hour | |
| 1 hour | |
| 1 hour | |
| 1 hour | |
| 1 hour | |
| 3 hours | |
| 4 hours | |
| 4 hours | |
| Jul-30 | |
| Jul-30 | |
| Jul-30 | |
| Jul-30 | |
| Jul-30 |
Join thousands of traders who make more informed decisions with our premium features. Real-time quotes, advanced visualizations, alerts, and much more.
Learn more about Finviz Elite