|
|
|

|
|||||
|
|
|
Last Friday, the three most widely followed benchmark indexes closed a winning week. The Dow Jones Industrial Average, the S&P 500 and the Nasdaq Composite added 1%, 1.6% and 2%, respectively.
U.S. stocks rose last week as cooling inflation data and rising jobless claims boosted expectations that the Fed will cut rates at its September meeting. Geopolitical tensions remained contained, while lower oil prices eased inflation worries. Investor sentiment improved on hopes of a soft landing, with tech driving Nasdaq’s gains, defensive sectors supporting the S&P 500 and industrial resilience lifting the Dow, reflecting broad optimism despite global uncertainties.
Markets this week are focused on the Fed’s upcoming policy decision and signals on the timing and size of potential interest rate cuts.
Regardless of market conditions, we, here at Zacks, provide investors with unbiased guidance on how to beat the market.
As usual, Zacks Research guided investors over the past three months with its time-tested methodologies. Given the prevailing market uncertainty, you may want to look at our feats to prepare better for your next action.
Here are some of our key achievements:
Shares of Lemonade, Inc. LMND have gained 23.4% (versus the S&P 500’s 5.9% increase) since it was upgraded to a Zacks Rank #2 (Buy) on July 8.
Another stock, Interactive Brokers Group IBKR, which was upgraded to a Rank #1 (Strong Buy) on July 10, has returned 10.1% (versus the S&P 500’s 5.4% increase) since then.
A hypothetical portfolio of Zacks Rank # 1 (Strong Buy) stocks returned +8.64% in 2025 (through September 1st) vs. +7.60% for the S&P 500 index.
This portfolio returned +22.4% in 2024, vs. +28% for the S&P 500 index and +19.9% for the equal-weight version of the S&P 500 index.
This hypothetical portfolio returned +20.65% in 2023 vs. +24.83% for the S&P 500 index and +15% for the equal-weight S&P 500 index.
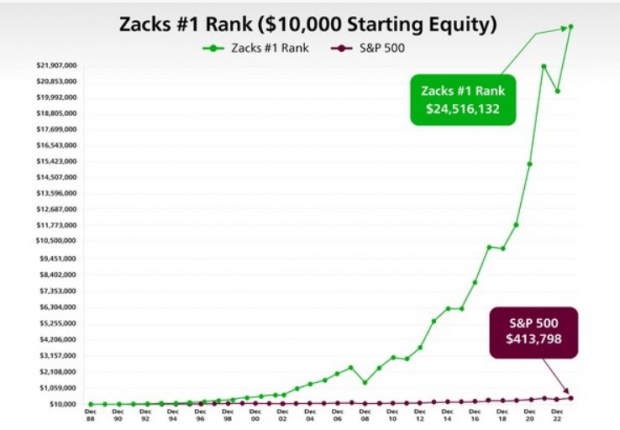
The Zacks Model Portfolio - consisting of Zacks Rank #1 stocks – has outperformed the S&P index by more than 12 percentage points since 1988 (through September 1st, 2025, the Zacks # 1 Rank stocks generated an annualized average return of +23.8% vs. +11.3% for the S&P 500 index).
You can see the complete list of today’s Zacks Rank #1 stocks here >>>
Check Lemonade’s historical EPS and Sales here>>>
Check Interactive Brokers’ historical EPS and Sales here>>>
Shares of CommScope Holding Company, Inc. COMM and Wayfair Inc. W have surged 111.3% (versus the S&P 500’s 4.7% rise) and 55.2% (versus the S&P 500’s 4.8% rise), respectively, since their Zacks Recommendation was upgraded to Outperform on July 18 and July 21.
While the Zacks Rank is our short-term rating system that is most effective over the one- to three-month holding horizon, the Zacks Recommendation aims to predict performance over the next 6 to 12 months. However, just like the Zacks Rank, the foundation for the Zacks Recommendation is trends in earnings estimate revisions.
The Zacks Recommendation classifies stocks into three groups — Outperform, Neutral and Underperform. While these recommendations are determined quantitatively, our analysts have the flexibility to override them for the 1100+ stocks they closely follow based on their better judgment of factors such as valuation, industry conditions and management effectiveness than the quantitative model.
To access our research reports with Zacks Recommendations for the 1100+ stocks we cover, click here>>>
Shares of Micron Technology, Inc. MU, which belongs to the Zacks Focus List, have gained 36% over the past 12 weeks. The stock was added to the Focus List on December 27, 2016. Another Focus-List holding, Lam Research Corporation LRCX, which was added to the portfolio on December 5, 2016, has returned 30.7% over the past 12 weeks. The S&P 500 has advanced 10.2% over this period.
The 50-stock Focus List portfolio returned 13.74% in 2025 (through August 31st, 2025) vs. +10.79% for the S&P 500 index and +8.69% for the equal-weight version of the index.
The Zacks Focus List portfolio returned +18.41% in 2024 vs. +25.04% for the S&P 500 index and +13% for the equal-weight S&P 500 index. The portfolio had returned +29.54% in 2023 vs. +26.28% for the S&P 500 index and +13.61% for the equal-weight S&P 500 index. In 2022, the portfolio returned -15.2% vs. the S&P 500 index’s -17.96%.
The portfolio leads the broader market over the preceding one, three, five and ‘since 2004’ periods. These annualized return comparisons are: +16.20% for the Focus List vs. +15.89% for the index over the one-year period, +21.20% vs. +19.54% over the 3-year period, +16.1% vs. +14.74% over the 5-year period, and +11.9% vs. +10.57% since 2004.
Unlock all of our powerful research, tools and analysis, including the Focus List, Zacks #1 Rank List, Equity Research Reports, Zacks Earnings ESP Filter, Premium Screener and more, as part of Zacks Premium. Gain full access now >>
Oracle Corporation ORCL, a component of our Earnings Certain Admiral Portfolio (ECAP), has jumped 35.8% over the past 12 weeks. Thermo Fisher Scientific Inc. TMO has followed Oracle with 19% returns.
The Zacks Earnings Certain Admiral Portfolio (ECAP), which consists of 30 concentrated, ultra-defensive, long-term Buy-and-Hold stocks, returned +3.20% in the first quarter of 2025 vs. the S&P 500 index’s -4.30% decline (SPY ETF).
For the year 2024, the portfolio returned +16.26% vs. +24.89% for the S&P 500 index (SPY ETF).
In 2023, the portfolio returned +12.17% vs. +26.28% for the S&P 500 index. The portfolio returned -4.7% in 2022 vs. the S&P 500 index’s -17.96%.
With little to no turnover and annual rebalance periodicity, ECAP seeks to minimize capital loss by holding shares of companies whose earnings streams exhibit a proven 20+ year track record of surviving recessionary periods with minimal impact on aggregate earnings growth relative to the overall S&P 500.
The ECAP and many other model portfolios are available as part of Zacks Advisor Tools, a cloud-based solution to access Zacks award-winning stock, mutual fund and ETF research. Click here to schedule a demo.
Fastenal Company FAST, which is part of our Earnings Certain Dividend Portfolio (ECDP), has returned 12.5% over the past 12 weeks. Another ECDP stock, UnitedHealth Group Incorporated UNH, has climbed 12.4% over the same time frame. Of course, the inclination of investors toward quality dividend stocks to secure an income stream amid heightened market volatility contributed to this performance.
Check Fastenal’s dividend history here>>>
Check UnitedHealth’s dividend history here>>>
With an extremely low beta and a history of minimum earnings variability over the last 20+ years, this 25-stock portfolio helps significantly mitigate risk.
The Zacks Earnings Certain Dividend Portfolio (ECDP) returned -3.17% in 2025 Q2 vs. the S&P 500 index’s +10.94% gain and the Dividend Aristocrats ETF’s (NOBL) -0.09% return. Year-to-date (through June 30th), the portfolio returned +2.38% vs. +2.18% gain for the Dividend Aristocrat ETF.
For the full year 2024, the portfolio returned +6.95% vs. +24.89% for the S&P 500 index and +6.72% for NOBL.
Click here to access this portfolio on Zacks Advisor Tools.
MasTec, Inc. MTZ, from the Zacks Top 10 Stocks for 2025, has jumped 39.4% year to date compared with the S&P 500 Index’s 12.2% increase.
The Top 10 portfolio returned +17.72% this year (through the end of August 2025) vs. +10.79% for the S&P 500 index and +8.69% for the equal-weight version of the index.
The Top 10 portfolio returned +62.98% in 2024, vs. +25.04% for the S&P 500 index and +13% for the equal-weight version of the index. The portfolio had returned +25.15% in 2023 vs. +26.28% for the S&P 500 index.
Since 2012, the Top 10 portfolio has produced a cumulative return of +2,369.7% through the end of August 2025 vs. +522.5% for the S&P 500 index and +390.9% for the equal-weight version of the index. The portfolio has produced an average return of +26.1% in the period 2012 through August 31, 2025, vs. +12.86% for the S&P 500 index and +10.49% for the equal-weight version of the index.
Want the latest recommendations from Zacks Investment Research? Today, you can download 7 Best Stocks for the Next 30 Days. Click to get this free report
This article originally published on Zacks Investment Research (zacks.com).
| 1 hour | |
| Jul-19 | |
| Jul-19 | |
| Jul-19 | |
| Jul-19 | |
| Jul-19 | |
| Jul-18 | |
| Jul-18 | |
| Jul-17 | |
| Jul-17 | |
| Jul-17 | |
| Jul-17 | |
| Jul-17 | |
| Jul-17 | |
| Jul-17 |
Join thousands of traders who make more informed decisions with our premium features. Real-time quotes, advanced visualizations, alerts, and much more.
Learn more about Finviz Elite