|
|
|

|
|||||
|
|
|
Last week, the three most widely followed U.S. indexes ended in the red. The Nasdaq Composite, the S&P 500, and the Dow Jones Industrial Average lost ground by 1.34%, 0.75% and 0.29%, respectively. Investors adopted a cautious approach due to moderating labor market conditions and persistent inflation. However, stronger-than-expected Gross Domestic Product (GDP) growth in the prior quarter provided a bullish signal that dispelled fears of an imminent recession.
The Personal Consumption Expenditures (PCE) Index, the Federal Reserve's preferred inflation gauge, rose 2.7% in August, slightly up from 2.6% in July; however, the core PCE Index (excluding food and energy) rose to 2.9% year over year. The Consumer Sentiment Index fell for the third month in a row in September to 55.1, lower than expected, mostly due to tariffs and high prices. Personal income rose by 0.4% and personal consumption expenditures increased by 0.6% in August, indicating continued consumer resilience. The Labor Department report suggests some softening as overall job growth has been slowing in recent months. Jobless claims totaled 218,000 for the week ending Sept. 20, a decrease of 14,000 from the previous week. Continuing claims came in at 1,926,000, a decrease of 2,000 from the previous week’s revised level.
Final estimates for second-quarter GDP growth for 2025 were revised significantly upward to an annual rate of 3.8% from a 0.6% contraction in the first quarter, mostly due to a decrease in imports and stronger-than-expected consumer spending on services. Investors are now closely watching for further inflation and labor market data to gauge the Fed's next move, as the Fed’s dot-plot has shown two more quarter-basis-point rate cuts this year and one rate cut of 25 basis points in both 2026 and 2027.
Regardless of market conditions, we, here at Zacks, provide investors with unbiased guidance on how to beat the market.
As usual, Zacks Research guided investors over the past three months with its time-tested methodologies. Given the prevailing market uncertainty, you may want to look at our feats to prepare better for your next action.
Here are some of our key achievements:
Shares of Helios Technologies, Inc. HLIO have gained 46.9% (versus the S&P 500’s 5.3% increase) since it was upgraded to a Zacks Rank #1 (Strong Buy) on July 22.
Another stock, Clear Channel Outdoor Holdings, Inc. CCO, which was also upgraded to a Zacks Rank #2 (Buy) on July 25, has returned 28.7% (versus the S&P 500’s 4.3% rise) since then.
Zacks Rank, our short-term rating system, has earnings estimate revisions at its core. Empirical research shows a strong correlation between trends in earnings estimate revisions and near-term stock price movements.
Zacks Rank #1 stocks returned +6.51% in May 2025, which compares to +4.47% for the S&P 500 index and +4.12% for the equal-weight version of the index. This follows the Zacks Rank # 1 stocks’ +17.96% return in April vs. +15.04% for the S&P 500 index.
A hypothetical portfolio of Zacks Rank # 1 stocks returned +6.51% in May 2025, which compares to +4.47% for the S&P 500 index and +4.12% for the equal-weight version of the index. This follows the Zacks Rank # 1 stocks’ +17.96% return in April vs. +15.04% for the S&P 500 index.
This hypothetical portfolio has returned -2.59% in 2025 (through June 2) vs. -1.12% for the S&P 500 index and -4.41% for the equal-weight version of the index.
This portfolio returned +22.4% in 2024, vs. +28% for the S&P 500 index and +19.9% for the equal-weight version of the S&P 500 index.
This hypothetical portfolio returned +20.65% in 2023 vs. +24.83% for the S&P 500 index and +15% for the equal-weight S&P 500 index.
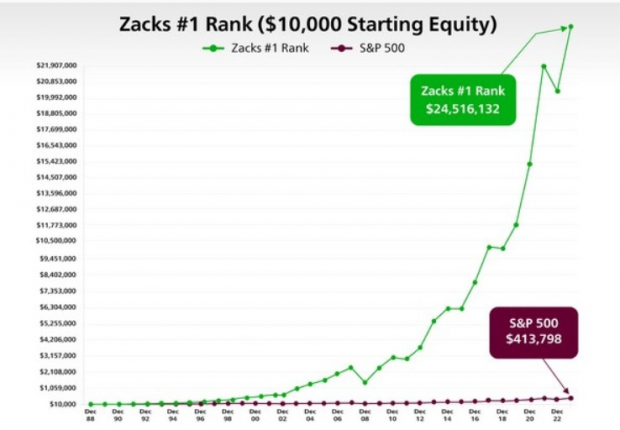
The Zacks Model Portfolio - consisting of Zacks Rank #1 stocks – has outperformed the S&P index by more than 12 percentage points since 1988 (through June 2, 2025, the Zacks # 1 Rank stocks generated an annualized average return of +23.5% vs. +11% for the S&P 500 index).
You can see the complete list of today’s Zacks Rank #1 stocks here >>>
Check Helios Technologies’ historical EPS and Sales here>>>
Check Clear Channel Outdoor’s historical EPS and Sales here>>>
Shares of InterDigital, Inc. IDCC and Kiniksa Pharmaceuticals International, plc KNSA have advanced 40.7% and 21.4% (versus the S&P 500’s 4.3% increase), respectively, since their Zacks Recommendation was upgraded to Outperform on July 31.
While the Zacks Rank is our short-term rating system that is most effective over the one- to three-month holding horizon, the Zacks Recommendation aims to predict performance over the next 6 to 12 months. However, just like the Zacks Rank, the foundation for the Zacks Recommendation is trends in earnings estimate revisions.
The Zacks Recommendation classifies stocks into three groups — Outperform, Neutral and Underperform. While these recommendations are determined quantitatively, our analysts have the flexibility to override them for the 1100+ stocks they closely follow based on their better judgment of factors such as valuation, industry conditions and management effectiveness than the quantitative model.
Shares of Lam Research Corporation LRCX, which belongs to the Zacks Focus List, have gained 32% over the past 12 weeks. The stock was added to the Focus List on December 5, 2016. Another Focus-List holding, Micron Technology, Inc. MU, which was added to the portfolio on December 27, 2016, has returned 26.1% over the past 12 weeks. The S&P 500 has advanced 7.7% over this period.
The 50-stock Focus List portfolio returned 8.84% in 2025 (through June 30, 2025) vs. +6.21% for the S&P 500 index and +4.82% for the equal-weight version of the index.
The Zacks Focus List portfolio returned +18.41% in 2024 vs. +25.04% for the S&P 500 index and +13% for the equal-weight S&P 500 index. The portfolio had returned +29.54% in 2023 vs. +26.28% for the S&P 500 index and +13.61% for the equal-weight S&P 500 index. In 2022, the portfolio returned -15.2% vs. the S&P 500 index’s -17.96%.
The portfolio leads the broader market over the preceding one, three, five and ‘since 2004’ periods. These annualized return comparisons are: +22.27% for the Focus List vs. +15.18% for the index over the one-year period, +22.61% vs. +19.71% over the 3-year period, +17.79% vs. +16.64% over the 5-year period, and +11.85% vs. +11.44% since 2004.
Unlock all of our powerful research, tools and analysis, including the Focus List, Zacks #1 Rank List, Equity Research Reports, Zacks Earnings ESP Filter, Premium Screener and more, as part of Zacks Premium. Gain full access now >>
Oracle Corporation ORCL, a component of our Earnings Certain Admiral Portfolio (ECAP), has jumped 34.8% over the past 12 weeks. Thermo Fisher Scientific Inc. TMO has followed Oracle with 13.7% returns.
The Zacks Earnings Certain Admiral Portfolio (ECAP), which consists of 30 concentrated, ultra-defensive, long-term Buy-and-Hold stocks, returned +3.20% in the first quarter of 2025 vs. the S&P 500 index’s -4.30% decline (SPY ETF).
For the year 2024, the portfolio returned +16.26% vs. +24.89% for the S&P 500 index (SPY ETF).
In 2023, the portfolio returned +12.17% vs. +26.28% for the S&P 500 index. The portfolio returned -4.7% in 2022 vs. the S&P 500 index’s -17.96%.
With little to no turnover and annual rebalance periodicity, ECAP seeks to minimize capital loss by holding shares of companies whose earnings streams exhibit a proven 20+ year track record of surviving recessionary periods with minimal impact on aggregate earnings growth relative to the overall S&P 500.
The ECAP and many other model portfolios are available as part of Zacks Advisor Tools, a cloud-based solution to access Zacks award-winning stock, mutual fund and ETF research. Click here to schedule a demo.
Fastenal Company FAST, which is part of our Earnings Certain Dividend Portfolio (ECDP), has returned 16.1% over the past 12 weeks. Another ECDP stock, UnitedHealth Group Incorporated UNH, has also climbed 11.3% over the same time frame. Of course, the inclination of investors toward quality dividend stocks to secure an income stream amid heightened market volatility contributed to this performance.
Check Fastenal Company's dividend history here>>>
Check UnitedHealth‘s dividend history here>>>
With an extremely low beta and a history of minimum earnings variability over the last 20+ years, this 25-stock portfolio helps to significantly mitigate risk.
The Zacks Earnings Certain Dividend Portfolio (ECDP) returned +5.74% in 2025 Q1 vs. the S&P 500 index’s -2.41% pullback and the Dividend Aristocrats ETF’s (NOBL) +3.11% return.
For the full year 2024, the portfolio returned +6.95% vs. +24.89% for the S&P 500 index and +6.72% for NOBL.
The portfolio returned -0.9% in 2023 vs. +26.28% for the S&P 500 index and +8.11% for NOBL. The portfolio returned -2.3% in 2022 vs. -17.96% for the S&P 500 index and -8.34% for NOBL.
Click here to access this portfolio on Zacks Advisor Tools.
MasTec, Inc. MTZ, from the Zacks Top 10 Stocks for 2025, has jumped 52.9% since the list was released on January 2. During this period, the S&P 500 has increased by +13%.
The Top 10 portfolio returned +11.8% this year (through the end of June 2025) vs. +6.2% for the S&P 500 index and +4.8% for the equal-weight version of the index.
The Top 10 portfolio returned +62.98% in 2024, vs. +25.04% for the S&P 500 index and +13% for the equal-weight version of the index. The portfolio had returned +25.15% in 2023 vs. +26.28% for the S&P 500 index.
Since 2012, the Top 10 portfolio has produced a cumulative return of +2,246.8% through the end of June 2025 vs. +502.3% for the S&P 500 index and +373.4% for the equal-weight version of the index. The portfolio has produced an average return of +26.3% in the period 2012 through June 30, 2025, vs. +14.3% for the S&P 500 index and +12.2% for the equal-weight version of the index.
Want the latest recommendations from Zacks Investment Research? Today, you can download 7 Best Stocks for the Next 30 Days. Click to get this free report
This article originally published on Zacks Investment Research (zacks.com).
| 16 min | |
| 17 min | |
| 30 min | |
| 34 min | |
| 47 min | |
| 49 min | |
| 1 hour | |
| 1 hour | |
| 1 hour | |
| 1 hour | |
| 2 hours | |
| 2 hours | |
| 2 hours | |
| 3 hours | |
| 3 hours |
Join thousands of traders who make more informed decisions with our premium features. Real-time quotes, advanced visualizations, alerts, and much more.
Learn more about Finviz Elite