|
|
|

|
|||||
|
|
|
The Q3 earnings season gets going in earnest this week, with almost 80 companies on deck to report results, including 35 S&P 500 members. The big banks dominate this week’s reporting docket, but we also have several bellwethers from other sectors reporting, including Johnson & Johnson, United Air Lines, CSX Corp., and others.
Regular readers of our earnings commentary are familiar with the notably positive estimate revisions trend that we experienced over the last few months. The positive revisions trend since the start of Q3 in July has contrasted with what we experienced in the comparable periods of the first two quarters of the year.
This shift in the revisions trend has been the most notable in the post-COVID period and provides a positive setup for the Q3 earnings season.
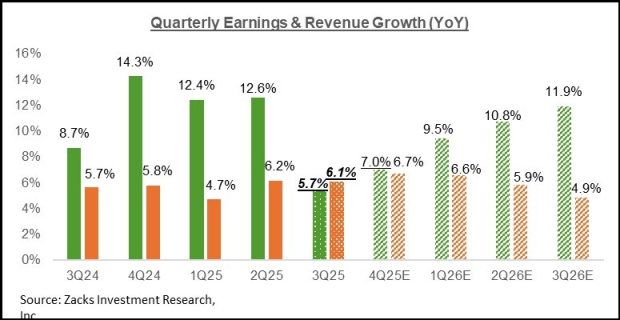
For 2025 Q3, the expectation is for earnings growth of +5.7% relative to the same period last year on +6.1% higher revenues. The expectation was for +4.2% earnings growth at the start of Q3 in July.
If we go by history, then the actual Q3 earnings growth will exceed these expectations. But in the unlikely event that actual Q3 earnings growth turns out to be +5.7%, then this will be the slowest growth pace for the S&P 500 index in the last two years (since 2023 Q3).
Q3 estimates increased for 6 of the 16 Zacks sectors, including Tech, Finance, and Energy (Business Services, Retail, and Conglomerates were the other sectors).
On the negative side, estimates were under pressure across the remaining 10 sectors, with significant declines in Basic Materials, Medical, Consumer Staples, and Transportation.
The favorable revisions trend for the Finance and Tech sectors has been critical to keeping the aggregate revisions trend on the positive side, since these two sectors alone account for almost half of the index’s total earnings.
This positive revisions trend has been in place for 2025 Q4 as well, with estimates for half of the 16 Zacks sectors enjoying favorable revisions since the start of July. These sectors are Finance, Tech, Energy, Business Services, Retail, Conglomerates, Utilities, and Construction.
This week’s results from JPMorgan JPM, Bank of America BAC, and others will be key to validating these Q4 revisions trends.
JPMorgan is expected to report $4.83 per share in earnings on $44.86 billion in revenues, representing year-over-year changes of +10.5% and +5.2%, respectively. The revisions trend has been positive, with the current $4.83 earnings estimate up from $4.72 a month ago and $4.50 three months back.
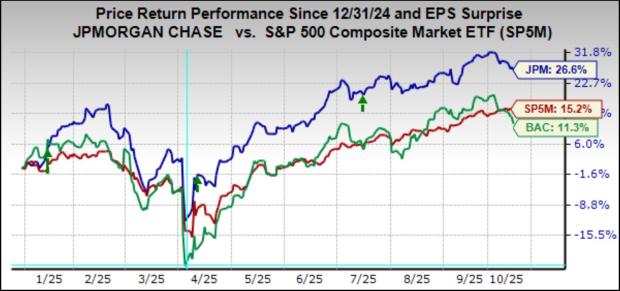
JPMorgan shares have lost some ground lately, but have nevertheless been stellar performers lately, up +26.7% this year vs. +15.3% gain for the S&P 500 index. JPMorgan will be reporting Q3 results before the market’s open on Tuesday, October 14th.
Bank of America will be reporting Q3 results before the market’s open on Wednesday, October 15th, with the company expected to bring in $0.94 per share in EPS on $27.1 billion in revenues, representing year-over-year changes of +16.1% and +7%, respectively. Unlike JPMorgan, Q3 estimates for Bank of America are essentially unchanged since the quarter got underway.
The chart below shows the year-to-date performance of JPMorgan, Bank of America, and the S&P 500 index.
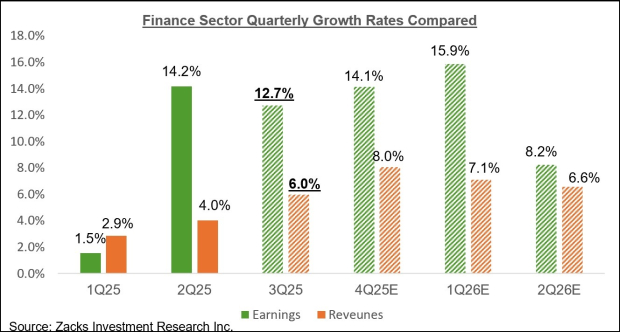
For the Finance sector as a whole, Q3 earnings are expected to increase by +12.7% from the same period last year on +6% higher revenues, as the chart below shows.
This week’s line-up of Q3 earnings releases is dominated by the Finance sector, with a host of banks, brokers, and insurers reporting results. In addition to JPMorgan and Bank of America, we have Citigroup, Wells Fargo, Goldman Sachs, Travelers, American Express, and other sector players reporting results. Notable reporters outside the Finance sector include JNJ, CSX Corp., United Airlines, SLB (formerly Schlumberger), and others.
In total, we have almost 80 companies reporting results this week, including 35 S&P 500 members.
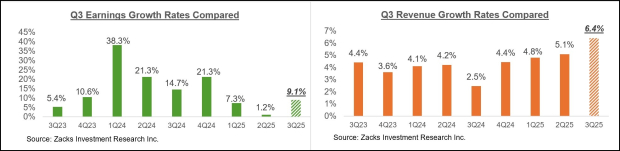
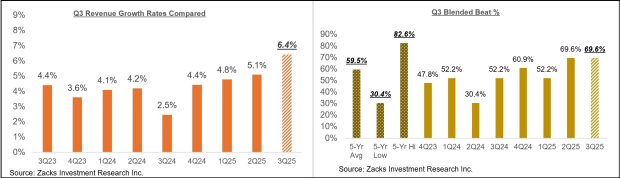
We have already seen results for fiscal quarters ending in August from 23 S&P 500 members, which we count as part of our September-quarter tally. Total earnings for these 23 index members are up +9.1% from the same period last year on +6.4% higher revenues, with 78.3% beating EPS estimates and 82.6% beating revenue estimates.
The comparison charts below put the Q3 earnings and revenue growth rates from these companies in a historical context.
The comparison charts below put the Q3 EPS and revenue beats percentages in a historical context.
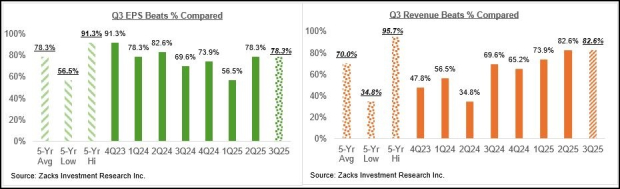
It is premature to draw any conclusions from this small sample of Q3 results. But these early results show signs of momentum on the revenue side, as the charts below show.
The chart below shows current Q3 earnings and revenue growth expectations for the S&P 500 index in the context of the preceding 4 quarters and the coming three quarters.
The chart below shows the overall earnings picture on a calendar-year basis.
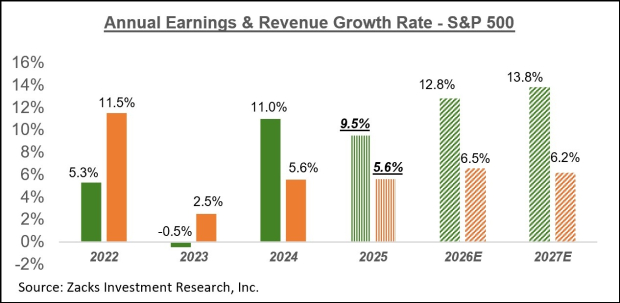
In terms of S&P 500 index ‘EPS’, these growth rates approximate to $257.42 for 2025 and $290.46 for 2026.
For a detailed view of the evolving earnings picture, please check out our weekly Earnings Trends report here >>>>The Q3 Earnings Season Gets Underway: A Closer Look
Want the latest recommendations from Zacks Investment Research? Today, you can download 7 Best Stocks for the Next 30 Days. Click to get this free report
This article originally published on Zacks Investment Research (zacks.com).
| 1 hour | |
| Jul-30 | |
| Jul-30 | |
| Jul-30 | |
| Jul-30 | |
| Jul-30 | |
| Jul-30 | |
| Jul-30 | |
| Jul-30 | |
| Jul-30 | |
| Jul-30 | |
| Jul-30 | |
| Jul-30 | |
| Jul-30 | |
| Jul-30 |
Join thousands of traders who make more informed decisions with our premium features. Real-time quotes, advanced visualizations, alerts, and much more.
Learn more about Finviz Elite