|
|
|

|
|||||

|
|
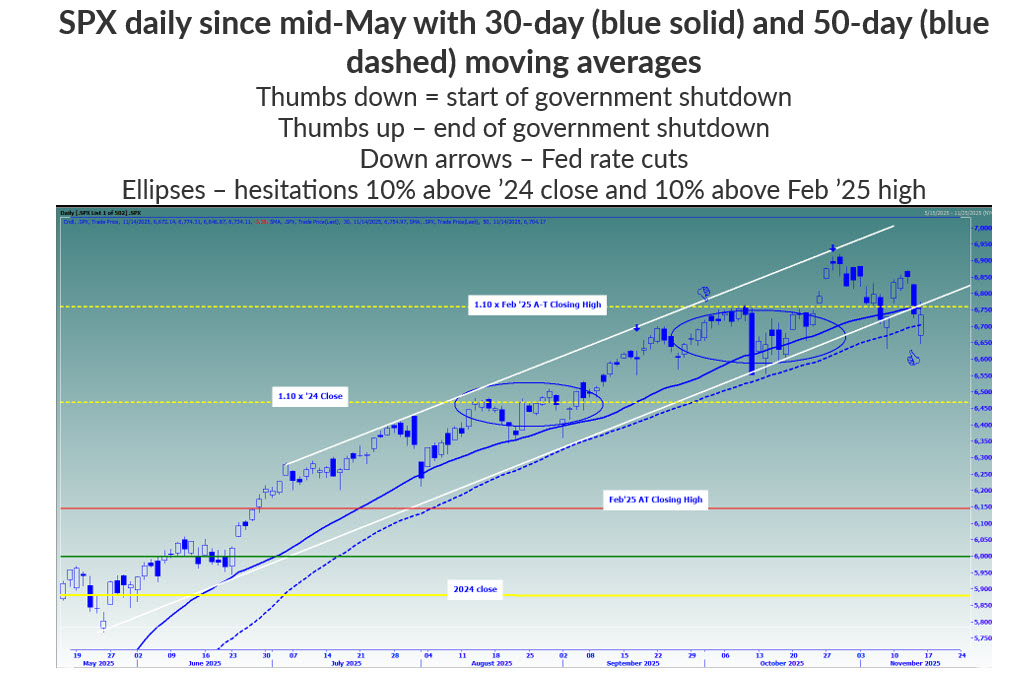
“…the SPX has been moving higher in an orderly fashion, as depicted by a channel connecting higher lows since May 23 …and higher highs since early July defining the upper boundary of this channel. There have been hesitations within this channel at levels 10% above the 2024 close and 10% above the previous all-time high in February and only one major close below the 30-day moving average, which was quickly resolved to the upside, until there is a firm break below the lower boundary of the bull channel, which is currently in the vicinity of the important 30-day and 50-day moving averages, I consider the bulls to be in control.”
-Monday Morning Outlook, November 3, 2025
The S&P 500 Index’s (SPX--6,734.11) “orderly” trend higher has suddenly become a little less orderly, with a slight close below the bull channel on Thursday. In fact, this past Friday was a “déjà vu” of sorts of the previous Friday’s price action, with sharp intraday movement below both the bottom rail of the channel and the 50-day moving average, but a close back above this popular moving average and in the vicinity of the lower boundary of the bull channel.
As of now, the SPX’s price action looks like January 2021 and May-July 2021, with one-off moves below the lower boundary of a bullish channel that was in play from November 2020 through September 2021. Those one-off moves below channel support were greeted by troughs at the 50-day moving average that quickly preceded further movement within the bull channel boundaries.
We have moved through the heart of earnings season, and last week brought an end to the government shutdown, which ran from Oct. 1 through Nov. 13. As of Friday’s close, the SPX is up 23 points above its Oct. 1 close of 6,711.
The highest close during the shutdown was 179 points above that Oct.1 6,711 level and the lowest close was 159 points below it. In other words, amid the shutdown and the absence of key economic data from government agencies, plus a heavy dose of earnings releases, there was little net directional movement in the SPX, but a decent amount of day-to-day volatility.

While the SPX recovered on Friday to close above its 50-day moving average, it was notable that it could not take advance above the 6,760 level. This is a level you have heard me talk about before, as it is 10% above the February 2025 high. Moreover, the lower boundary of the bull channel was sitting around 6,760 on Friday, and so too was the 30-day moving average, which is flattening out.
Therefore, the SPX comes into the week wedged between support from the 50-day moving average, and last week/the prior week’s intraday lows in the 6,630-6,650 area.
Looking ahead to this week and beyond, key “known, unknowns” on the calendar include Nvidia (NVDA) earnings Wednesday evening and reports this week from well-known retailers Home Depot (HD), Walmart (WMT), and Target (TGT).
After a long period of being starved of economic data, reports on employment and the inflation situation will begin in the next two weeks, which will be used for clues as to whether the Federal Open Market Committee (FOMC) will deliver another rate cut on Dec. 10. In fact, the U.S. Labor Department announced Friday afternoon that the September employment report will be released this Thursday before the market open.
Stocks, in particular the tech sector, were pressured last week as expectations for a rate cut declined, with Fed funds futures traders assigning a 44% probability of a rate cut at Friday’s close, compared to a 67% probability at the previous Friday’s close. For bulls, the good news is that even with rate cut expectations declining to less than a coin flip, the SPX bent but did not break.
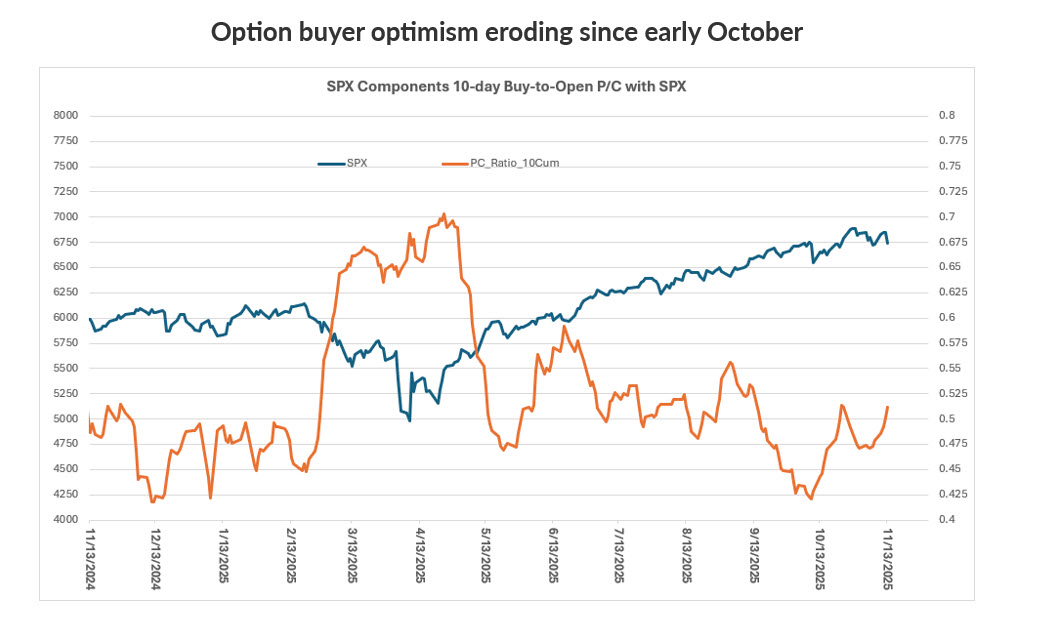
Speaking of expectations, the extreme optimism among option buyers on SPX component stocks that was reached about one week after the shutdown began has eroded significantly. Per the chart below, the 10-day buy-to-open put/call volume ratio has increased from a trough of 0.42 on Oct. 8 to the current 0.51 reading.
While a 0.51 reading is far from a pessimistic extreme, note that the SPX is trading around the same level it was when the ratio troughed. In other words, expectations among option buyers are lower even though stocks have not declined to the point that necessarily warrants a significant change in the outlook. But the momentum higher has slowed, and this may be giving more option buyers pause.

It is standard November expiration, and per the graph below, note that there is big put and call open interest in the immediate vicinity of where the SPX is trading. In fact, call and put open interest are big and about equal at the 6,700 and 6,750 strikes, both of which could be the site of pinning action. Note that the 6,750 strike is where the SPX found resistance on Friday. From an options-related perspective, tune to these strikes as potential pinning levels on Friday if there is little directional movement in the week ahead.

Todd Salamone is Schaeffer's Senior V.P. of Research
| 6 min |
Walmart To Report Results, Fresh Off New Highs, A New CEO And $1 Trillion Market Cap
WMT
Investor's Business Daily
|
| 13 min | |
| 24 min |
Stock Market Today: Nasdaq Rallies; Solar Stocks Shine But These Breakout Stocks Wither (Live Coverage)
NVDA
Investor's Business Daily
|
| 26 min | |
| 33 min | |
| 33 min | |
| 38 min | |
| 40 min | |
| 42 min | |
| 45 min | |
| 1 hour | |
| 1 hour | |
| 1 hour | |
| 2 hours | |
| 2 hours |
Join thousands of traders who make more informed decisions with our premium features. Real-time quotes, advanced visualizations, backtesting, and much more.
Learn more about FINVIZ*Elite