Psychologically-Significant Levels Could be a Trojan Horse
Subscribers to our Substack, The Contrarian Edge, received this commentary on Saturday, July 18 .
Despite all the daunting equations, formulas, and algorithms out there investors are inundated with, I was shocked – as a liberal arts kid starting to work in finance nine years ago -- to see that there’s just as much an emphasis on simple, digestible round numbers.
Senior V.P. of Research Todd Salamone has repeatedly hammered home their psychological significance in his Monday Morning Outlook newsletter, to the point that it’s the first thing I look at every morning. Here’s a recent example from early May that proved prophetic.
Here’s a recent example from early May that proved prophetic.
A potential resistance area could be in the 7,500-7,530 area. The 7,500 mark is a clean round number and 7,530 is exactly 10% above last year’s close. As such, anyone anchoring to the SPX’s year-to-date gain may look to slightly reduce risk. Round-number percentage levels often represent hesitation or pivot levels, and there is likely a psychology around this phenomenon.”
-Monday Morning Outlook, May 11, 2026
Right now, there are a lot of round numbers in play on Wall Street worth monitoring:
The psychological impact of these numbers can cut through a lot of technical noise. They can alternate between resistance and support in the blink of an eye. They’re like earned run average (ERA) for a pitcher; it doesn’t tell the whole story, but you get enough of an actionable gist.
Are these round-numbers really indicators of future market performance? I tapped Senior Quantitative Analyst Rocky White to look at the history of the three major indexes crossing over psychologically-significant, even-1K levels.
The Dow Jones Industrial Average (DJIA)
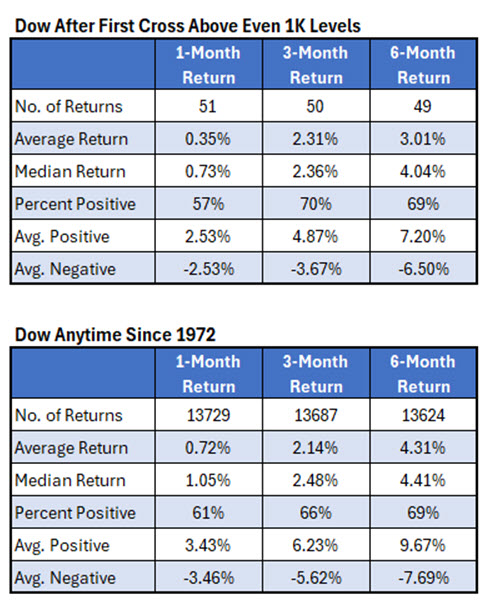
The one- and three-month returns are higher because we just crossed 52K in the last month. Overall, there’s not a huge jailbreak trend for bulls, with slightly more anytime outperformance six months later.
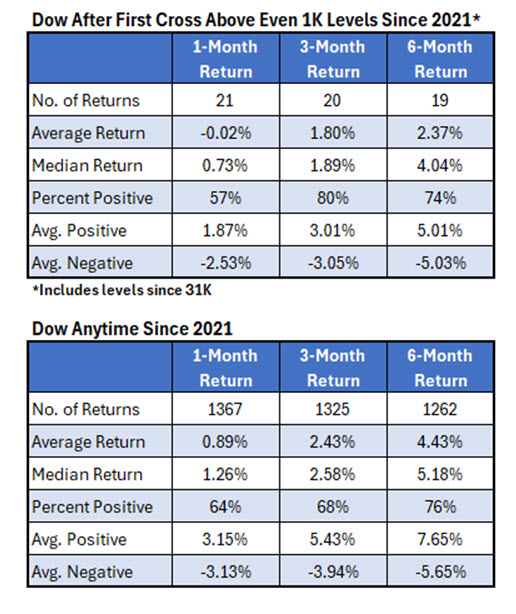
Narrowing the scope a little to 202 though, and there is some serious underperformance.
There have been 19 crossovers since 2021, and the Dow underperformed anytime returns across three- and six-month timeframes. The percent positive of crossovers is steady, but there’s a lack of upside indicated, a sort of pause in the post-Covid era when these milestones are cleared.
The Nasdaq Composite (IXIC)
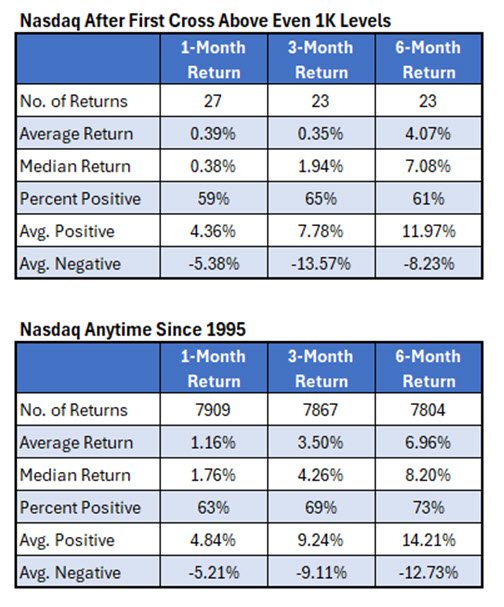
Clearing 1K levels has been tough sledding for the Nasdaq, with only 23 instances going back to 1995. Once more, there’s clear underperformance compared to average anytime returns, even this time with percent positive. These levels aren’t milestones per say; they’re psychological hurdles and possibly even profit-taking levels.
S&P 500 Index (SPX)
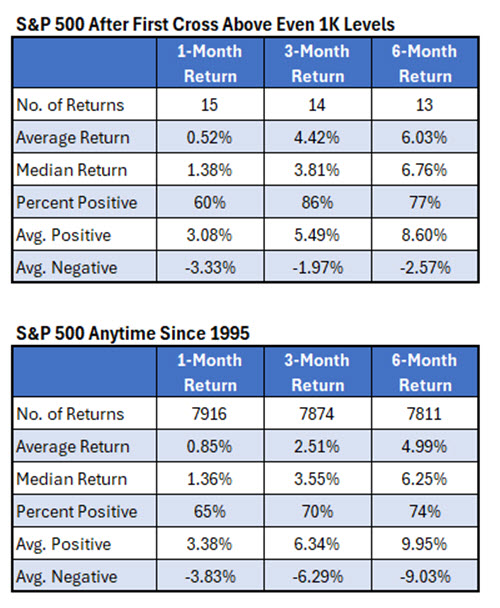
The SPX tells a different story than its peers. Milestone crossovers yield slight underperformance in the short term, but that pivots to outperformance across three- and six-month returns. For some reason, these levels are less of a barrier than the Dow or Nasdaq.
White conducted a similar study back in January for his Indicator of the Week series. The only difference was he ran the study for the Dow and S&P 500 getting within 1% of these increment levels, not crossing them. The results were similar though; the Dow showed weakness heading to 10K increment levels, while the SPX brushed off short-term weakness.
White speculated that the blue-chip index being referenced more often made those psychological areas more of a pain point. My theory is simpler; 53,000 and 26,000 are larger, scarier numbers than the S&P 500 at 7,500. Whatever the reason, if you’re just starting to read the market tea leaves or are looking to declutter your macro analysis, keep it simple with psychology.
What About Small Caps?
For brevity’s sake, let’s quickly run a similar study on the RUT.
Click Here to view the rest on Schaeffer’s Substack!
Mentioned In This Article
Latest News
| 4 hours | |
| Oct-07 | |
| Oct-06 | |
| Oct-05 | |
| Oct-02 | |
| Oct-01 | |
| Sep-30 | |
| Sep-29 | |
| Sep-28 | |
| Sep-24 | |
| Sep-23 | |
| Sep-22 | |
| Sep-21 | |
| Sep-18 | |
| Sep-17 |
