 |
| Market Cap | 45.97B | EPS (ttm) | 5.45 |
| P/E | 25.07 | EPS this Y | 8.01% |
| Forward P/E | 18.31 | EPS next Y | 5.10% |
| PEG | 4.20 | EPS past 5Y | 5.26% |
| P/S | 2.26 | EPS next 5Y | 5.96% |
| P/B | 44.04 | EPS Q/Q | 14.41% |
| Dividend | 3.56% | Sales Q/Q | -0.89% |
| Insider Own | 0.17% | Inst Own | 78.26% |
| Insider Trans | -7.30% | Inst Trans | 1.12% |
| Short Float | 1.25% | Earnings | Apr 23/b |
| Analyst Recom | 2.86 | Target Price | 137.54 |
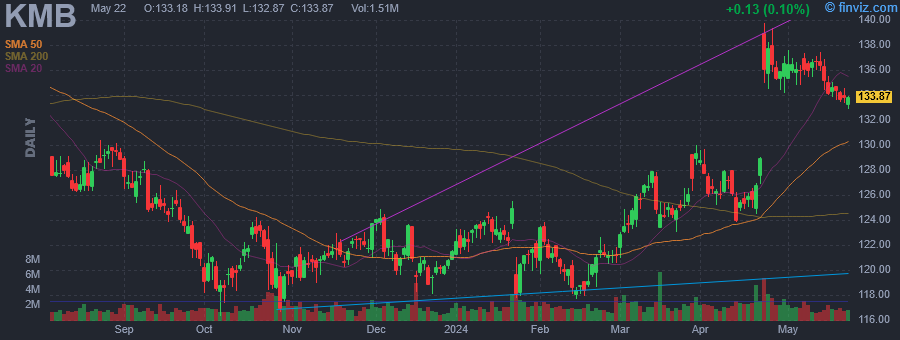
| Avg Volume | 2.26M | 52W Range | 116.32 - 147.02 |
|
|
|
|
Kimberly-Clark Corp. engages in the manufacture and marketing of products made from natural or synthetic fibers. It operates through the following segments: Personal Care, Consumer Tissue, and K-C Professional. The Personal Care segment offers disposable diapers, training and youth pants, swim pants, baby wipes, feminine and incontinence care products, and other related products. The Consumer Tissue segment produces and sells facial and bathroom tissue, paper towels, napkins, and related products for household use. The K-C Professional segment supplies workplace supporting products such as wipers, tissue, towels, apparel, soaps, and sanitizers. The company was founded by John A. Kimberly, Havilah Babcock, Charles B. Clark, and Frank C. Shattuck in 1872 and is headquartered in Irving, TX. |
| Insider Trading |
Relationship |
Date |
Transaction |
Cost |
#Shares |
Value ($) |
#Shares Total |
SEC Form 4 |
| Melucci Jeffrey P. | Chief Bus. & Transf. Officer | Apr 30 '24 | Sale | 135.53 | 13,714 | 1,858,621 | 19,935 | Apr 30 05:20 PM | | LONG ROBERT EDWARD | Chief R&D Officer | Apr 29 '24 | Option Exercise | 0.00 | 1,399 | 0 | 3,331 | Apr 30 05:13 PM | | Melucci Jeffrey P. | Chief Bus. & Transf. Officer | Apr 29 '24 | Sale | 135.59 | 6,390 | 866,444 | 33,649 | Apr 29 06:13 PM | | Fenske Tamera | Chief Supply Chain Officer | Apr 29 '24 | Sale | 135.37 | 717 | 97,058 | 2,284 | Apr 29 06:11 PM | | Hicks Zackery A | Chief Digital & Technology Off | Apr 26 '24 | Option Exercise | 0.00 | 2,602 | 0 | 2,602 | Apr 29 06:11 PM |
|
|
 |
 |
| Market Cap | 3.34B | EPS (ttm) | 1.39 |
| P/E | 41.07 | EPS this Y | - |
| Forward P/E | - | EPS next Y | - |
| PEG | - | EPS past 5Y | 20.89% |
| P/S | 8.27 | EPS next 5Y | - |
| P/B | 4.84 | EPS Q/Q | 33.84% |
| Dividend | 0.80% | Sales Q/Q | 20.27% |
| Insider Own | 1.33% | Inst Own | 80.98% |
| Insider Trans | -17.97% | Inst Trans | -4.78% |
| Short Float | 1.14% | Earnings | Apr 24/a |
| Analyst Recom | 2.00 | Target Price | 19.00 |
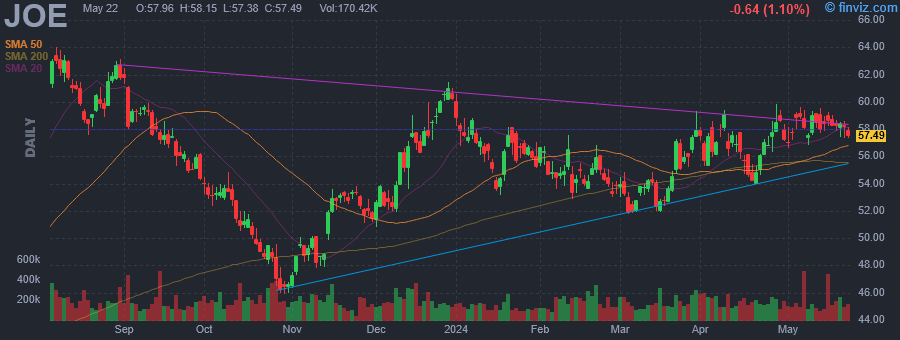
| Avg Volume | 194.64K | 52W Range | 39.68 - 65.99 |
|
|
|
|
The St. Joe Co. engages in real estate development and asset management. It operates through the following segments: Residential, Hospitality, and Commercial. The Residential segment is involved in planning and developing residential communities of various sizes across a wide range of price points and selling home sites to builders and retail consumers. The Hospitality segment focuses on private membership clubs, hotel operations, lodging, restaurants, golf courses, beach clubs, marinas, and other entertainment assets. The Commercial segment includes construction and leasing of multi-family, retail, office and commercial property, cell towers, and other assets. The company was founded in 1936 and is headquartered in Panama City Beach, FL. |
| Insider Trading |
Relationship |
Date |
Transaction |
Cost |
#Shares |
Value ($) |
#Shares Total |
SEC Form 4 |
| BERKOWITZ BRUCE R | Director | Apr 29 '24 | Sale | 59.05 | 2,600 | 153,530 | 19,224,624 | Apr 30 05:16 PM | | BERKOWITZ BRUCE R | Director | Apr 26 '24 | Sale | 59.19 | 1,500 | 88,785 | 19,227,224 | Apr 30 05:16 PM | | BERKOWITZ BRUCE R | Director | Mar 04 '24 | Sale | 54.28 | 7,300 | 396,244 | 19,228,724 | Mar 06 05:10 PM | | BERKOWITZ BRUCE R | Director | Mar 01 '24 | Sale | 54.03 | 88,700 | 4,792,461 | 19,236,024 | Mar 01 05:27 PM | | BERKOWITZ BRUCE R | Director | Feb 29 '24 | Sale | 54.05 | 2,700 | 145,935 | 19,324,724 | Mar 01 05:27 PM |
|
|
|
 |
| Market Cap | 50.91B | EPS (ttm) | 2.33 |
| P/E | 36.39 | EPS this Y | 10.39% |
| Forward P/E | 27.20 | EPS next Y | 12.35% |
| PEG | 3.90 | EPS past 5Y | 15.35% |
| P/S | 8.29 | EPS next 5Y | 9.34% |
| P/B | 7.17 | EPS Q/Q | 4.50% |
| Dividend | - | Sales Q/Q | 9.50% |
| Insider Own | 1.58% | Inst Own | 82.55% |
| Insider Trans | -4.22% | Inst Trans | -0.08% |
| Short Float | 1.25% | Earnings | Apr 25/a |
| Analyst Recom | 2.12 | Target Price | 95.95 |
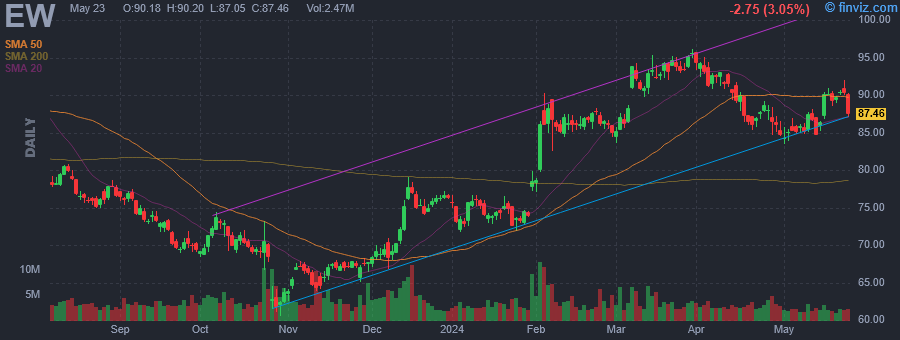
| Avg Volume | 4.05M | 52W Range | 60.57 - 96.12 |
|
|
|
|
Edwards Lifesciences Corp. engages in patient-focused medical innovations for heart disease and critical care monitoring. Its products are categorized into four main areas: Transcatheter Aortic Valve Replacement, Transcatheter Mitral and Tricuspid Therapies, Surgical Structural Heart, and Critical Care. It operates through the following geographical segments: United States, Europe, Japan, and Rest of World. The company was founded by Miles Lowell Edwards in 1958 and is headquartered in Irvine, CA. |
| Insider Trading |
Relationship |
Date |
Transaction |
Cost |
#Shares |
Value ($) |
#Shares Total |
SEC Form 4 |
| Ullem Scott B. | CVP, Chief Financial Officer | Apr 30 '24 | Option Exercise | 36.75 | 7,250 | 266,438 | 26,324 | Apr 30 04:56 PM | | Ullem Scott B. | CVP, Chief Financial Officer | Apr 30 '24 | Sale | 85.80 | 7,250 | 622,062 | 19,074 | Apr 30 04:56 PM | | Lippis Daniel J. | CVP, JAPAC | Apr 09 '24 | Option Exercise | 36.75 | 857 | 31,495 | 18,345 | Apr 09 05:33 PM | | Lippis Daniel J. | CVP, JAPAC | Apr 09 '24 | Sale | 92.34 | 857 | 79,135 | 17,488 | Apr 09 05:33 PM | | Lemercier Jean-Luc M | CVP, EMEACLA | Apr 08 '24 | Option Exercise | 36.75 | 14,400 | 529,200 | 188,249 | Apr 08 05:10 PM |
|
|
| |
 |
| Market Cap | 15.89B | EPS (ttm) | 12.63 |
| P/E | 33.01 | EPS this Y | 10.17% |
| Forward P/E | 23.72 | EPS next Y | 9.66% |
| PEG | 3.37 | EPS past 5Y | 12.16% |
| P/S | 7.38 | EPS next 5Y | 9.80% |
| P/B | 8.82 | EPS Q/Q | 8.02% |
| Dividend | 0.97% | Sales Q/Q | 5.99% |
| Insider Own | 0.22% | Inst Own | 92.56% |
| Insider Trans | -42.24% | Inst Trans | 0.94% |
| Short Float | 4.32% | Earnings | Mar 21/b |
| Analyst Recom | 3.04 | Target Price | 460.98 |
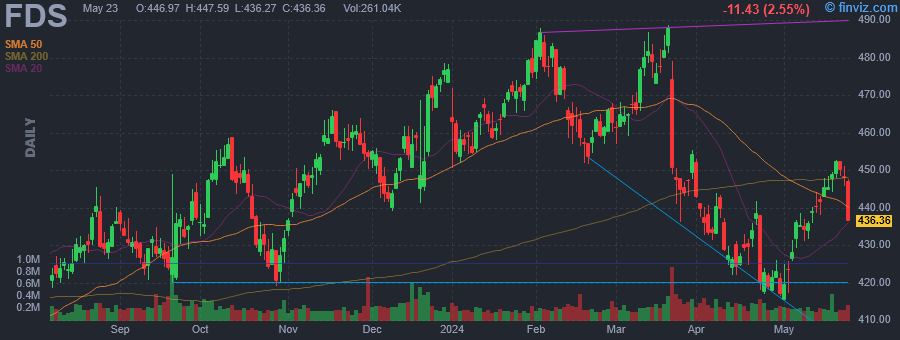
| Avg Volume | 260.84K | 52W Range | 380.96 - 488.64 |
|
|
|
|
FactSet Research Systems Inc. (the Company or FactSet) is a global provider of integrated financial information, analytical applications and services for the investment and corporate communities. Since inception, global financial professionals have utilized the Company's content and multi-asset class solutions across each stage of the investment process. FactSet's goal is to provide a seamless user experience spanning idea generation, research, portfolio construction, trade execution, performance measurement, risk management, reporting, and portfolio analysis, in which the Company serves the front, middle, and back offices to drive productivity and improved performance. FactSet's flexible, open data and technology solutions can be implemented both across the investment portfolio lifecycle or as standalone components serving different workflows in the organization. FactSet is focused on growing the business throughout each of its three segments, the Americas, EMEA (formerly known as Europe), and Asia Pacific. The Company primarily delivers insight and information through the workflow solutions of Research, Analytics and Trading, Content and Technology Solutions (CTS) and Wealth. FactSet currently serves financial professionals, which include portfolio managers, investment research professionals, investment bankers, risk and performance analysts, wealth advisors and corporate clients. FactSet provides both insights on global market trends and intelligence on companies and industries, as well as capabilities to monitor portfolio risk and performance and to execute trades. The Company combines dedicated client service with open and flexible technology offerings, such as a configurable desktop and mobile platform, comprehensive data feeds, an open marketplace and digital portals and application programming interfaces (APIs). The Company's revenue is primarily derived from subscriptions to products and services such as workstations, analytics, enterprise data, and research management. FactSet Research Systems was founded by Howard E. Wille and Charles J. Snyder in September 1978 and is headquartered in Norwalk, CT. |
| Insider Trading |
Relationship |
Date |
Transaction |
Cost |
#Shares |
Value ($) |
#Shares Total |
SEC Form 4 |
| Moskoff Gregory T | MD,Controller and CAO | Apr 30 '24 | Sale | 419.50 | 330 | 138,435 | 72 | Apr 30 04:50 PM | | Snow Frederick Philip | Chief Executive Officer | Apr 01 '24 | Option Exercise | 164.90 | 3,000 | 494,700 | 15,915 | Apr 01 05:10 PM | | Snow Frederick Philip | Chief Executive Officer | Apr 01 '24 | Sale | 452.10 | 3,000 | 1,356,300 | 12,915 | Apr 01 05:10 PM | | Snow Frederick Philip | Chief Executive Officer | Mar 01 '24 | Option Exercise | 164.90 | 3,000 | 494,700 | 15,915 | Mar 01 04:02 PM | | Snow Frederick Philip | Chief Executive Officer | Mar 01 '24 | Sale | 461.55 | 3,000 | 1,384,650 | 12,915 | Mar 01 04:02 PM |
|
|
|
 |
| Market Cap | 4.42B | EPS (ttm) | -0.39 |
| P/E | - | EPS this Y | 144.76% |
| Forward P/E | 64.69 | EPS next Y | 43.80% |
| PEG | - | EPS past 5Y | 0.37% |
| P/S | 14.80 | EPS next 5Y | 10.00% |
| P/B | 51.30 | EPS Q/Q | 739.99% |
| Dividend | - | Sales Q/Q | -10.56% |
| Insider Own | 4.31% | Inst Own | 100.69% |
| Insider Trans | 4.53% | Inst Trans | 7.36% |
| Short Float | 12.45% | Earnings | Apr 24/a |
| Analyst Recom | 1.00 | Target Price | 156.00 |
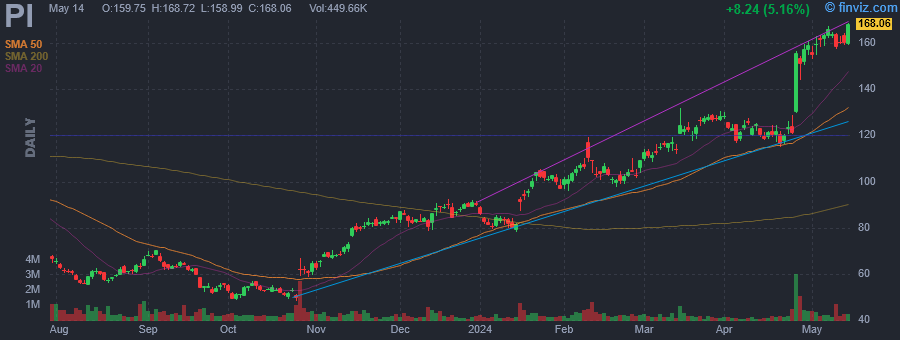
| Avg Volume | 444.99K | 52W Range | 48.39 - 159.62 |
|
|
|
|
IImpinj, Inc. engages in the development and sale of radio frequency identification solutions. The company was founded by Christopher Diorio in April 2000 and is headquartered in Seattle, WA. |
| Insider Trading |
Relationship |
Date |
Transaction |
Cost |
#Shares |
Value ($) |
#Shares Total |
SEC Form 4 |
| DIORIO CHRIS PH.D. | CHIEF EXECUTIVE OFFICER | Apr 26 '24 | Option Exercise | 21.81 | 26,661 | 581,476 | 312,891 | Apr 30 04:43 PM | | DOSSETT JEFFREY | CHIEF REVENUE OFFICER | Apr 26 '24 | Option Exercise | 17.33 | 8,000 | 138,640 | 68,850 | Apr 30 04:45 PM | | DIORIO CHRIS PH.D. | CHIEF EXECUTIVE OFFICER | Apr 26 '24 | Sale | 147.02 | 26,661 | 3,919,790 | 286,230 | Apr 30 04:43 PM | | PHELAN CATHAL G | CHIEF INNOVATION OFFICER | Apr 26 '24 | Sale | 147.94 | 10,000 | 1,479,359 | 15,801 | Apr 30 04:47 PM | | DOSSETT JEFFREY | CHIEF REVENUE OFFICER | Apr 26 '24 | Sale | 145.77 | 8,000 | 1,166,128 | 60,850 | Apr 30 04:45 PM |
|
|
| |
 |
| Market Cap | 136.38M | EPS (ttm) | -0.51 |
| P/E | - | EPS this Y | 2941.09% |
| Forward P/E | 7.92 | EPS next Y | 11.06% |
| PEG | - | EPS past 5Y | - |
| P/S | 0.91 | EPS next 5Y | - |
| P/B | 1.35 | EPS Q/Q | -115.14% |
| Dividend | - | Sales Q/Q | -19.00% |
| Insider Own | 48.23% | Inst Own | 39.26% |
| Insider Trans | 0.30% | Inst Trans | -1.53% |
| Short Float | 4.97% | Earnings | May 09/a |
| Analyst Recom | 2.67 | Target Price | 2.75 |
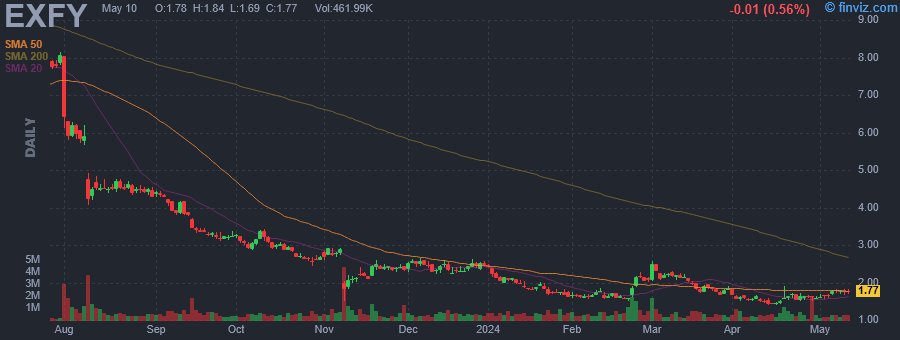
| Avg Volume | 664.45K | 52W Range | 1.40 - 8.25 |
|
|
|
|
Expensify, Inc. engages in the provision of a cloud-based expense management software platform that helps the smallest to the largest businesses simplify the way they manage money. It operates under the United States and All Other Locations geographical segments. The company was founded by David Barrett and Witold Stankiewicz on May 1, 2008 and is headquartered in Portland, OR. |
| Insider Trading |
Relationship |
Date |
Transaction |
Cost |
#Shares |
Value ($) |
#Shares Total |
SEC Form 4 |
| Barrett David Michael | Chief Executive Officer | Apr 30 '24 | Sale | 1.59 | 1,500 | 2,385 | 1,024,411 | Apr 30 04:47 PM | | Barrett David Michael | Chief Executive Officer | Apr 29 '24 | Sale | 1.61 | 1,500 | 2,415 | 1,025,911 | Apr 30 04:47 PM | | McLaughlin Steven J. | 10% Owner | Apr 26 '24 | Buy | 1.60 | 200 | 320 | 9,015,836 | Apr 29 04:38 PM | | Barrett David Michael | Chief Executive Officer | Apr 26 '24 | Sale | 1.63 | 12,437 | 20,272 | 1,027,411 | Apr 30 04:47 PM | | McLaughlin Steven J. | 10% Owner | Apr 25 '24 | Buy | 1.59 | 17,511 | 27,842 | 9,015,636 | Apr 29 04:38 PM |
|
|
|
 |
| Market Cap | 4.07B | EPS (ttm) | 2.75 |
| P/E | 27.21 | EPS this Y | 10.81% |
| Forward P/E | 15.14 | EPS next Y | 15.05% |
| PEG | 1.87 | EPS past 5Y | -4.70% |
| P/S | 1.16 | EPS next 5Y | 14.52% |
| P/B | 2.30 | EPS Q/Q | 39.96% |
| Dividend | 1.11% | Sales Q/Q | 0.15% |
| Insider Own | 0.41% | Inst Own | 96.33% |
| Insider Trans | -22.52% | Inst Trans | 1.04% |
| Short Float | 1.34% | Earnings | Mar 27/a |
| Analyst Recom | 2.14 | Target Price | 90.29 |
| Avg Volume | 284.96K | 52W Range | 62.57 - 84.31 |
|
|
|
|
H.B. Fuller Co. engages in the manufacture and marketing of adhesives, sealants, and other chemical products. It operates through the following business segments: Hygiene, Health, and Consumable Adhesives, Engineering Adhesives, and Construction Adhesives. The Hygiene, Health, and Consumable Adhesives segment supplies adhesive products in the assembly, packaging, converting, nonwoven, hygiene, health and beauty, flexible packaging, graphic arts, and envelope markets. The Engineering Adhesives segment provides adhesives to the transportation, electronics, medical, clean energy, aerospace and defense, performance wood, insulating glass, textile, appliance, and heavy machinery markets. The Construction Adhesives segment manufactures adhesives, sealants, tapes, mortars, and grouts for construction activities. The company was founded by Harvey Benjamin Fuller in 1887 and is headquartered in St. Paul, MN. |
| Insider Trading |
Relationship |
Date |
Transaction |
Cost |
#Shares |
Value ($) |
#Shares Total |
SEC Form 4 |
| Cai Zhiwei | Executive Vice President, EA | Apr 29 '24 | Sale | 75.15 | 4,645 | 349,049 | 30,663 | Apr 30 04:44 PM | | Weaver Nathan D. | Sr. VP, Human Resources | Apr 09 '24 | Option Exercise | 41.00 | 7,292 | 298,972 | 12,095 | Apr 10 01:54 PM | | Weaver Nathan D. | Sr. VP, Human Resources | Apr 09 '24 | Sale | 78.64 | 7,292 | 573,478 | 4,803 | Apr 10 01:54 PM | | East James J. | Executive Vice President, HHC | Apr 08 '24 | Option Exercise | 63.74 | 18,806 | 1,198,753 | 22,316 | Apr 10 01:54 PM | | East James J. | Executive Vice President, HHC | Apr 08 '24 | Sale | 78.27 | 22,316 | 1,746,577 | 0 | Apr 10 01:54 PM |
|
|
| |
 |
| Market Cap | 9.64B | EPS (ttm) | 0.74 |
| P/E | 111.68 | EPS this Y | -474.25% |
| Forward P/E | - | EPS next Y | 28.25% |
| PEG | - | EPS past 5Y | - |
| P/S | 0.90 | EPS next 5Y | - |
| P/B | 38.98 | EPS Q/Q | 86.87% |
| Dividend | - | Sales Q/Q | -14.56% |
| Insider Own | 17.23% | Inst Own | 98.05% |
| Insider Trans | -1.69% | Inst Trans | 1.15% |
| Short Float | 29.68% | Earnings | May 01/a |
| Analyst Recom | 3.14 | Target Price | 64.74 |
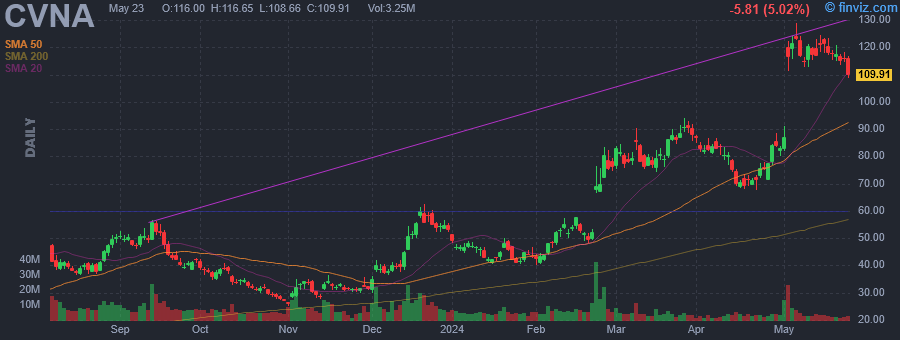
| Avg Volume | 6.14M | 52W Range | 6.70 - 94.04 |
|
|
|
|
Carvana Co. is a holding company and an eCommerce platform, which engages in the buying and selling of used cars. The company was founded by Ernest Garcia, III, Benjamin Huston and Ryan Keeton in 2012 and is headquartered in Tempe, AZ. |
| Insider Trading |
Relationship |
Date |
Transaction |
Cost |
#Shares |
Value ($) |
#Shares Total |
SEC Form 4 |
| GARCIA ERNEST C. II | 10% Owner | Apr 29 '24 | Sale | 85.38 | 50,000 | 4,268,962 | 3,212,500 | Apr 30 04:44 PM | | GARCIA ERNEST C. II | 10% Owner | Apr 26 '24 | Sale | 80.09 | 50,000 | 4,004,640 | 3,262,500 | Apr 30 04:44 PM | | GARCIA ERNEST C. II | 10% Owner | Apr 11 '24 | Sale | 80.13 | 50,000 | 4,006,495 | 3,312,500 | Apr 15 07:46 PM | | GILL DANIEL J. | Chief Product Officer | Apr 02 '24 | Sale | 82.85 | 10,335 | 856,234 | 392,038 | Apr 03 07:00 PM | | GARCIA ERNEST C. III | Chief Executive Officer | Apr 02 '24 | Sale | 82.83 | 9,390 | 777,764 | 861,458 | Apr 03 07:01 PM |
|
|
|
 |
| Market Cap | 3.65B | EPS (ttm) | 2.73 |
| P/E | 8.05 | EPS this Y | -21.73% |
| Forward P/E | 7.16 | EPS next Y | 23.69% |
| PEG | - | EPS past 5Y | 11.79% |
| P/S | 0.80 | EPS next 5Y | -1.00% |
| P/B | 1.93 | EPS Q/Q | -46.82% |
| Dividend | 1.39% | Sales Q/Q | -14.97% |
| Insider Own | 3.68% | Inst Own | 100.13% |
| Insider Trans | -7.31% | Inst Trans | -7.19% |
| Short Float | 10.23% | Earnings | Apr 17/a |
| Analyst Recom | 2.06 | Target Price | 25.21 |
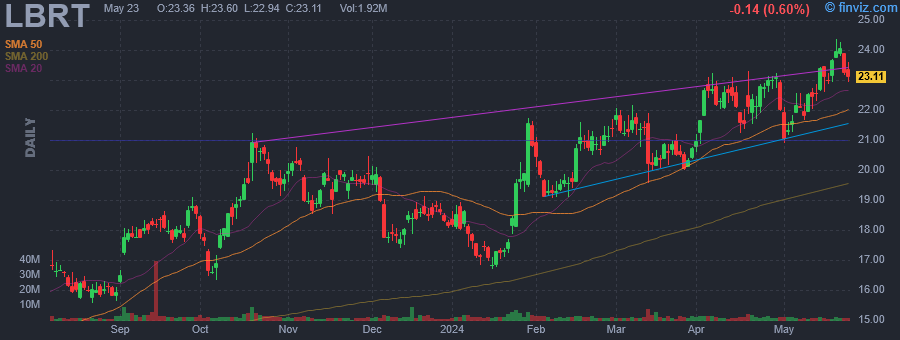
| Avg Volume | 2.76M | 52W Range | 11.62 - 23.31 |
|
|
|
|
Liberty Energy, Inc. engages in the provision of hydraulic fracturing services to onshore oil and natural gas exploration for production companies in North America. The company was founded on December 21, 2016 and is headquartered in Denver, CO. |
| Insider Trading |
Relationship |
Date |
Transaction |
Cost |
#Shares |
Value ($) |
#Shares Total |
SEC Form 4 |
| Gusek Ron | President | Apr 30 '24 | Sale | 22.70 | 42,397 | 962,539 | 1,170,862 | Apr 30 04:36 PM | | Gusek Ron | President | Apr 29 '24 | Sale | 22.99 | 50,000 | 1,149,470 | 1,213,259 | Apr 30 04:36 PM | | ELLIOTT R SEAN | Chief Legal Officer | Apr 29 '24 | Sale | 23.10 | 20,000 | 462,024 | 259,108 | Apr 30 04:38 PM | | Wright Christopher A | Chairman of the Board and CEO | Apr 04 '24 | Sale | 22.66 | 20,000 | 453,200 | 2,858,814 | Apr 04 06:37 PM | | Wright Christopher A | Chairman of the Board and CEO | Apr 03 '24 | Sale | 22.49 | 20,000 | 449,800 | 2,878,814 | Apr 04 06:37 PM |
|
|
|
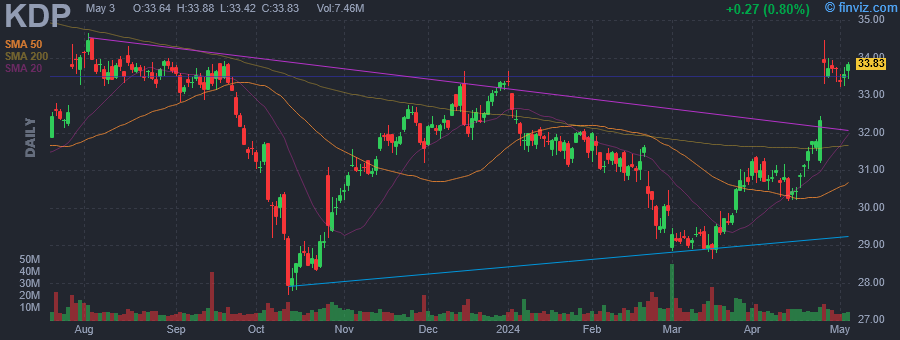 |
| Market Cap | 45.68B | EPS (ttm) | 1.55 |
| P/E | 21.78 | EPS this Y | 7.35% |
| Forward P/E | 16.27 | EPS next Y | 7.76% |
| PEG | 3.06 | EPS past 5Y | 23.74% |
| P/S | 3.06 | EPS next 5Y | 7.12% |
| P/B | 1.85 | EPS Q/Q | -0.73% |
| Dividend | 2.59% | Sales Q/Q | 3.43% |
| Insider Own | 22.00% | Inst Own | 66.60% |
| Insider Trans | -40.06% | Inst Trans | -0.97% |
| Short Float | 1.44% | Earnings | Apr 25/b |
| Analyst Recom | 2.18 | Target Price | 36.56 |
| Avg Volume | 11.34M | 52W Range | 27.66 - 34.65 |
|
|
|
|
Keurig Dr Pepper, Inc. engages in the manufacture, marketing, distribution, and sales of non-alcoholic beverages. It operates through the following segments: U.S. Refreshment Beverages, U.S. Coffee, and International. The U.S. Refreshment Beverages segment manufactures and distributes beverage concentrates, syrups, and finished beverages including the brands Dr Pepper, Canada Dry, Mott's, Snapple, A&W, 7UP, Sunkist soda, Squirt, Hawaiian Punch, Core Hydration, Bai, C4 Energy, Clamato, Evian, Yoo-Hoo, Big Red, and Vita Coco. The U.S. Coffee segment involves single serve brewers, specialty, hot and iced varieties, and ready-to-drink beverages. The International segment includes sales in Canada, Mexico, and other markets. The company was founded in 2018 and is headquartered in Burlington, MA. |
| Insider Trading |
Relationship |
Date |
Transaction |
Cost |
#Shares |
Value ($) |
#Shares Total |
SEC Form 4 |
| Johnson Roger Frederick | Chief Supply Chain Officer | Apr 26 '24 | Sale | 33.82 | 31,227 | 1,056,097 | 100,000 | Apr 30 04:36 PM | | JAB BevCo B.V. | 10% Owner | Mar 15 '24 | Sale | 28.90 | 13,043,478 | 376,956,514 | 283,443,879 | Mar 18 08:07 PM | | JAB Holdings B.V. | 10% Owner | Mar 15 '24 | Sale | 28.90 | 13,043,478 | 376,956,514 | 283,443,879 | Mar 18 08:08 PM | | Gamgort Robert James | CEO & Executive Chairman | Mar 12 '24 | Option Exercise | 0.00 | 40,888 | 0 | 3,048,984 | Mar 14 05:32 PM | | Archambault Matthew Andrew | President, US Refreshment Bev. | Mar 12 '24 | Option Exercise | 0.00 | 3,698 | 0 | 25,767 | Mar 14 05:34 PM |
|
|
|
