 |
| Market Cap | 42.26M | EPS (ttm) | -18.25 |
| P/E | - | EPS this Y | 41.06% |
| Forward P/E | - | EPS next Y | 41.09% |
| PEG | - | EPS past 5Y | 7.97% |
| P/S | 0.87 | EPS next 5Y | - |
| P/B | 2.30 | EPS Q/Q | 47.27% |
| Dividend | - | Sales Q/Q | -33.59% |
| Insider Own | 11.14% | Inst Own | 64.87% |
| Insider Trans | -43.59% | Inst Trans | -66.79% |
| Short Float | 9.69% | Earnings | Mar 27/b |
| Analyst Recom | 1.33 | Target Price | 33.00 |
| Avg Volume | 127.78K | 52W Range | 8.25 - 27.02 |
|
|
| Today | Initiated |
Guggenheim |
Buy |
$19 |
|
|
|
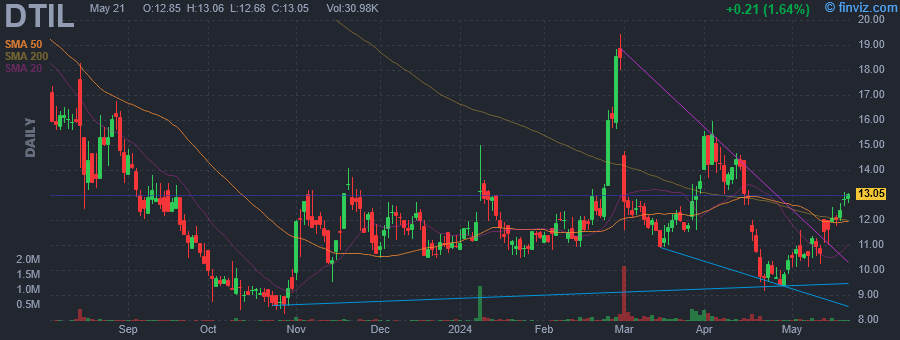
Precision BioSciences, Inc. is a biotechnology company, which engages in the development of genome editing technologies. It operates through the Therapeutics and Food segments. The Therapeutics segment focuses on the development of products in the field of immuno-oncology and of novel products outside immuno-oncology to treat human diseases. The Food segment applies ARCUS, the company's proprietary genome editing platform, to develop food and nutrition products through collaboration agreements with consumer-facing companies. The company was founded by Derek N. Jantz, Jeff Smith, and Matthew R. Kane on January 26, 2006 and is headquartered in Durham, NC. |
| Insider Trading |
Relationship |
Date |
Transaction |
Cost |
#Shares |
Value ($) |
#Shares Total |
SEC Form 4 |
| List Alan | Chief Medical Officer | Apr 30 '24 | Sale | 10.03 | 238 | 2,386 | 3,796 | Apr 30 06:34 PM | | SMITH J. JEFFERSON | Chief Research Officer | Jan 23 '24 | Sale | 0.37 | 28,000 | 10,360 | 1,987,269 | Jan 23 07:11 PM | | Amoroso Michael | President and CEO | Jan 22 '24 | Sale | 0.36 | 137,390 | 49,460 | 356,433 | Jan 23 07:17 PM | | List Alan | Chief Medical Officer | Jan 22 '24 | Sale | 0.36 | 21,526 | 7,749 | 94,982 | Jan 23 07:13 PM | | Scimeca Dario | General Counsel and Secretary | Jan 22 '24 | Sale | 0.36 | 21,287 | 7,663 | 151,028 | Jan 23 07:15 PM |
|
|
 |
 |
| Market Cap | 713.03M | EPS (ttm) | -2.65 |
| P/E | - | EPS this Y | -11.80% |
| Forward P/E | - | EPS next Y | -8.82% |
| PEG | - | EPS past 5Y | -59.00% |
| P/S | 8.81 | EPS next 5Y | - |
| P/B | 3.50 | EPS Q/Q | -0.31% |
| Dividend | - | Sales Q/Q | 30.74% |
| Insider Own | 7.90% | Inst Own | 69.68% |
| Insider Trans | -0.76% | Inst Trans | -4.59% |
| Short Float | 12.88% | Earnings | Apr 10/b |
| Analyst Recom | 1.36 | Target Price | 25.09 |
| Avg Volume | 1.03M | 52W Range | 4.22 - 18.12 |
|
|
|
|
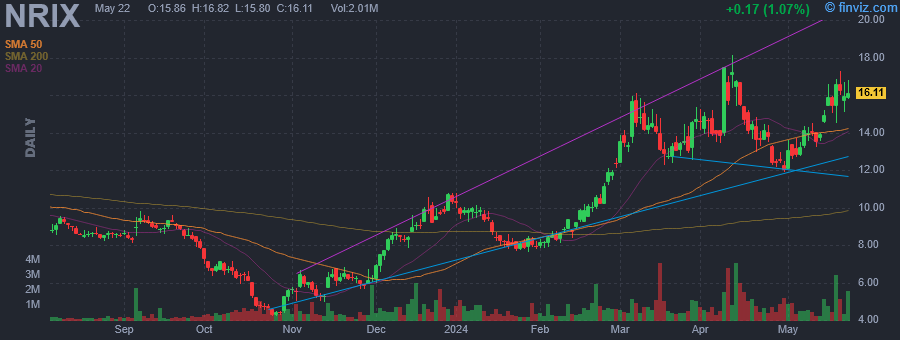
Nurix Therapeutics, Inc. is a clinical stage biopharmaceutical company. It engages in the business of discovering, developing, and commercializing innovative small molecules and antibody therapies based on the modulation of cellular protein levels as a novel treatment approach for cancer, inflammatory conditions, and other challenging diseases. The company was founded by John Kuriyan, Michael Rape, and Arthur Weiss in 2009 and is headquartered in San Francisco, CA. |
| Insider Trading |
Relationship |
Date |
Transaction |
Cost |
#Shares |
Value ($) |
#Shares Total |
SEC Form 4 |
| Hansen Gwenn | Chief Scientific Officer | Apr 30 '24 | Option Exercise | 0.00 | 5,206 | 0 | 41,608 | Apr 30 06:33 PM | | Ring Christine | Chief Legal Officer | Apr 30 '24 | Option Exercise | 0.00 | 3,924 | 0 | 21,351 | Apr 30 06:33 PM | | van Houte Hans | Chief Financial Officer | Apr 30 '24 | Option Exercise | 0.00 | 4,886 | 0 | 73,219 | Apr 30 06:33 PM | | Hansen Gwenn | Chief Scientific Officer | Apr 30 '24 | Sale | 12.04 | 2,007 | 24,169 | 39,601 | Apr 30 06:33 PM | | Ring Christine | Chief Legal Officer | Apr 30 '24 | Sale | 12.04 | 1,513 | 18,220 | 19,838 | Apr 30 06:33 PM |
|
|
|
 |
| Market Cap | 2046.64B | EPS (ttm) | 6.52 |
| P/E | 25.25 | EPS this Y | 27.58% |
| Forward P/E | 19.44 | EPS next Y | 14.43% |
| PEG | 1.31 | EPS past 5Y | 21.56% |
| P/S | 6.44 | EPS next 5Y | 19.23% |
| P/B | 6.96 | EPS Q/Q | 60.92% |
| Dividend | 0.18% | Sales Q/Q | 15.44% |
| Insider Own | 57.57% | Inst Own | 27.80% |
| Insider Trans | -0.01% | Inst Trans | - |
| Short Float | 0.70% | Earnings | Apr 25/a |
| Analyst Recom | 1.59 | Target Price | 188.17 |
| Avg Volume | 24.00M | 52W Range | 104.50 - 176.42 |
|
|
|
|
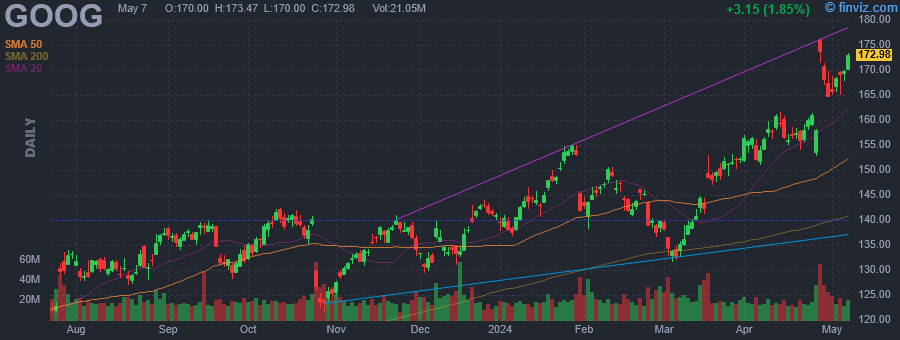
Alphabet, Inc. is a holding company, which engages in software, health care, transportation, and other technologies. It operates through the following segments: Google Services, Google Cloud, and Other Bets. The Google Services segment includes products and services such as ads, Android, Chrome, devices, Google Maps, Google Play, Search, and YouTube. The Google Cloud segment refers to infrastructure and platform services, collaboration tools, and other services for enterprise customers. The Other Bets segment relates to the sale of healthcare-related services and internet services. The company was founded by Lawrence E. Page and Sergey Mikhaylovich Brin on October 2, 2015 and is headquartered in Mountain View, CA. |
| Insider Trading |
Relationship |
Date |
Transaction |
Cost |
#Shares |
Value ($) |
#Shares Total |
SEC Form 4 |
| ARNOLD FRANCES | Director | Apr 30 '24 | Sale | 167.38 | 80 | 13,390 | 15,551 | Apr 30 05:59 PM | | HENNESSY JOHN L | Director | Apr 26 '24 | Sale | 175.76 | 2,100 | 369,096 | 5,891 | Apr 26 06:53 PM | | Pichai Sundar | Chief Executive Officer | Apr 17 '24 | Sale | 157.41 | 22,500 | 3,541,763 | 2,303,011 | Apr 17 07:30 PM | | HENNESSY JOHN L | Director | Apr 12 '24 | Sale | 159.56 | 800 | 127,648 | 7,991 | Apr 15 08:17 PM | | Pichai Sundar | Chief Executive Officer | Apr 03 '24 | Sale | 155.67 | 22,500 | 3,502,640 | 2,325,513 | Apr 04 03:07 PM |
|
|
| |
 |
| Market Cap | 2023.52B | EPS (ttm) | 6.52 |
| P/E | 24.97 | EPS this Y | 27.65% |
| Forward P/E | 19.23 | EPS next Y | 14.36% |
| PEG | 1.30 | EPS past 5Y | 21.56% |
| P/S | 6.36 | EPS next 5Y | 19.23% |
| P/B | 6.88 | EPS Q/Q | 60.92% |
| Dividend | 0.17% | Sales Q/Q | 15.44% |
| Insider Own | 52.77% | Inst Own | 37.68% |
| Insider Trans | -0.01% | Inst Trans | -0.22% |
| Short Float | 1.00% | Earnings | Apr 25/a |
| Analyst Recom | 1.58 | Target Price | 188.21 |
| Avg Volume | 32.62M | 52W Range | 103.71 - 174.71 |
|
|
|
|
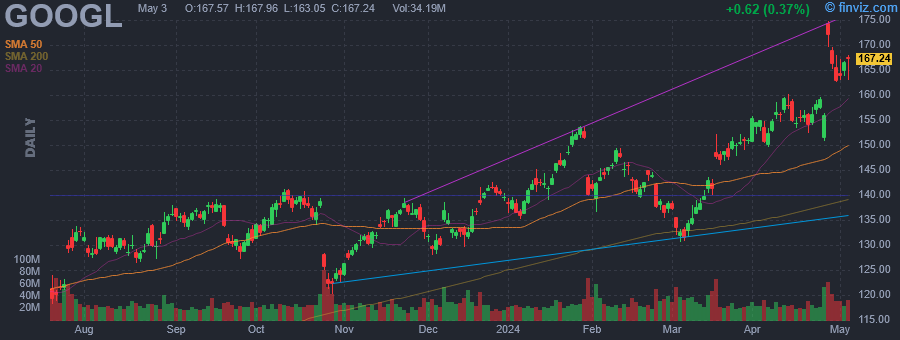
Alphabet, Inc. is a holding company, which engages in software, health care, transportation, and other technologies. It operates through the following segments: Google Services, Google Cloud, and Other Bets. The Google Services segment includes products and services such as ads, Android, Chrome, devices, Google Maps, Google Play, Search, and YouTube. The Google Cloud segment refers to infrastructure and platform services, collaboration tools, and other services for enterprise customers. The Other Bets segment relates to the sale of healthcare-related services and internet services. The company was founded by Lawrence E. Page and Sergey Mikhaylovich Brin on October 2, 2015 and is headquartered in Mountain View, CA. |
| Insider Trading |
Relationship |
Date |
Transaction |
Cost |
#Shares |
Value ($) |
#Shares Total |
SEC Form 4 |
| ARNOLD FRANCES | Director | Apr 30 '24 | Sale | 167.38 | 80 | 13,390 | 15,551 | Apr 30 05:59 PM | | HENNESSY JOHN L | Director | Apr 26 '24 | Sale | 175.76 | 2,100 | 369,096 | 5,891 | Apr 26 06:53 PM | | Pichai Sundar | Chief Executive Officer | Apr 17 '24 | Sale | 157.41 | 22,500 | 3,541,763 | 2,303,011 | Apr 17 07:30 PM | | HENNESSY JOHN L | Director | Apr 12 '24 | Sale | 159.56 | 800 | 127,648 | 7,991 | Apr 15 08:17 PM | | Pichai Sundar | Chief Executive Officer | Apr 03 '24 | Sale | 155.67 | 22,500 | 3,502,640 | 2,325,513 | Apr 04 03:07 PM |
|
|
|
 |
| Market Cap | 4.46B | EPS (ttm) | 4.32 |
| P/E | 22.34 | EPS this Y | -12.62% |
| Forward P/E | 16.05 | EPS next Y | 12.90% |
| PEG | 3.66 | EPS past 5Y | 8.66% |
| P/S | 1.02 | EPS next 5Y | 6.10% |
| P/B | 2.38 | EPS Q/Q | -18.51% |
| Dividend | - | Sales Q/Q | -7.07% |
| Insider Own | 3.65% | Inst Own | 97.37% |
| Insider Trans | -7.15% | Inst Trans | -1.59% |
| Short Float | 2.66% | Earnings | Apr 24/a |
| Analyst Recom | 2.62 | Target Price | 94.00 |
| Avg Volume | 253.90K | 52W Range | 63.27 - 106.42 |
|
|
|
|
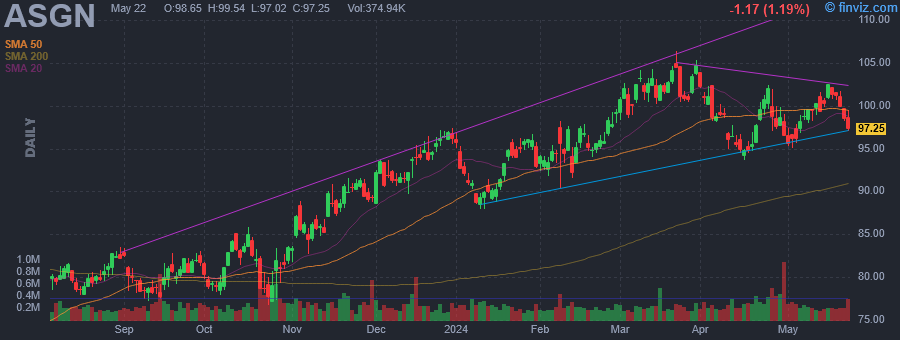
ASGN Incorporated engages in the provision of information technology services and solutions. It operates through the Commercial and Federal Government segments. The Commercial segment involves the provision of consulting, creative digital marketing, and permanent placement services. The Federal Government segment provides mission-critical solutions. The company was founded on December 30, 1985 and is headquartered in Glen Allen, VA. |
| Insider Trading |
Relationship |
Date |
Transaction |
Cost |
#Shares |
Value ($) |
#Shares Total |
SEC Form 4 |
| Lindstrom Carol | Director | Apr 30 '24 | Sale | 97.04 | 1,000 | 97,038 | 5,639 | Apr 30 05:43 PM | | KITTRELL MARTY R | Director | Apr 26 '24 | Sale | 98.61 | 1,000 | 98,613 | 4,316 | Apr 30 04:33 PM | | Sheridan Edwin A. | Director | Mar 08 '24 | Sale | 103.78 | 13,442 | 1,395,011 | 616,972 | Mar 08 05:02 PM | | Sheridan Edwin A. | Director | Mar 07 '24 | Sale | 101.93 | 50,000 | 5,096,660 | 630,414 | Mar 08 05:02 PM | | Sheridan Edwin A. | Director | Mar 06 '24 | Sale | 99.64 | 10,000 | 996,417 | 680,414 | Mar 08 05:02 PM |
|
|
| |
 |
| Market Cap | 21.72M | EPS (ttm) | 5.61 |
| P/E | 0.29 | EPS this Y | -110.17% |
| Forward P/E | - | EPS next Y | 58.14% |
| PEG | - | EPS past 5Y | - |
| P/S | 0.12 | EPS next 5Y | - |
| P/B | 2.25 | EPS Q/Q | 654.04% |
| Dividend | - | Sales Q/Q | -13.59% |
| Insider Own | 26.15% | Inst Own | 18.63% |
| Insider Trans | -0.83% | Inst Trans | - |
| Short Float | 1.29% | Earnings | May 13/a |
| Analyst Recom | 1.00 | Target Price | 5.00 |
| Avg Volume | 64.65K | 52W Range | 1.47 - 12.00 |
|
|
|
|
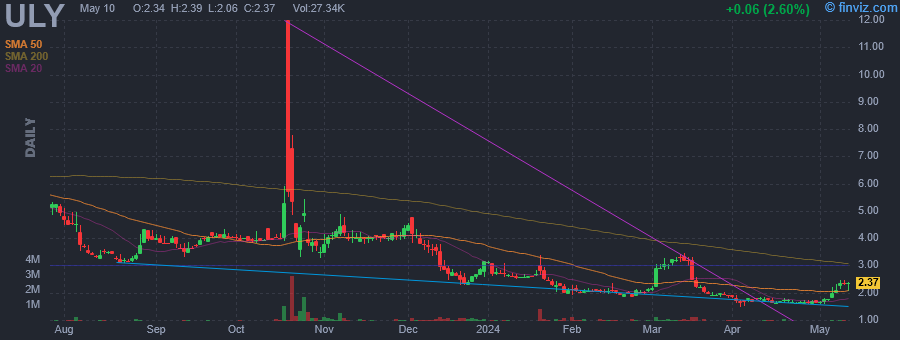
Urgent.ly, Inc. develops a mobile application for roadside assistance. The firm's industry solutions include insurance, automotive, financial, parking, wireless, fleets and rental. It specializes in on demand mobile services, mobile apps, mobile web, roadside assistance, towing services, and global digital roadside assistance solutions. The company was founded by Ric Fleisher, Surendra Goel, Luke Kathol, Lokesh Kumar, Rick Robinson and Christopher Spanos in 2013 and is headquartered in Vienna, VA. |
| Insider Trading |
Relationship |
Date |
Transaction |
Cost |
#Shares |
Value ($) |
#Shares Total |
SEC Form 4 |
| Ben Volkow | Director | Apr 29 '24 | Sale | 1.66 | 1,600 | 2,654 | 536,844 | Apr 30 05:41 PM | | Ben Volkow | Director | Apr 26 '24 | Sale | 1.63 | 3,000 | 4,879 | 538,444 | Apr 30 05:41 PM | | Ben Volkow | Director | Apr 25 '24 | Sale | 1.64 | 1,900 | 3,121 | 541,444 | Apr 26 06:46 PM | | Ben Volkow | Director | Apr 24 '24 | Sale | 1.64 | 1,700 | 2,789 | 543,344 | Apr 26 06:46 PM | | Ben Volkow | Director | Apr 23 '24 | Sale | 1.64 | 600 | 981 | 545,044 | Apr 24 04:43 PM |
|
|
|
 |
| Market Cap | 32.31B | EPS (ttm) | 7.79 |
| P/E | 6.43 | EPS this Y | 5.33% |
| Forward P/E | 6.61 | EPS next Y | 15.08% |
| PEG | 0.67 | EPS past 5Y | 4.80% |
| P/S | 0.55 | EPS next 5Y | 9.62% |
| P/B | 2.90 | EPS Q/Q | 110.10% |
| Dividend | 0.75% | Sales Q/Q | 7.75% |
| Insider Own | 0.39% | Inst Own | 69.49% |
| Insider Trans | -9.45% | Inst Trans | -1.80% |
| Short Float | 2.93% | Earnings | Apr 10/b |
| Analyst Recom | 1.29 | Target Price | 59.10 |
| Avg Volume | 9.86M | 52W Range | 30.60 - 50.74 |
|
|
|
|
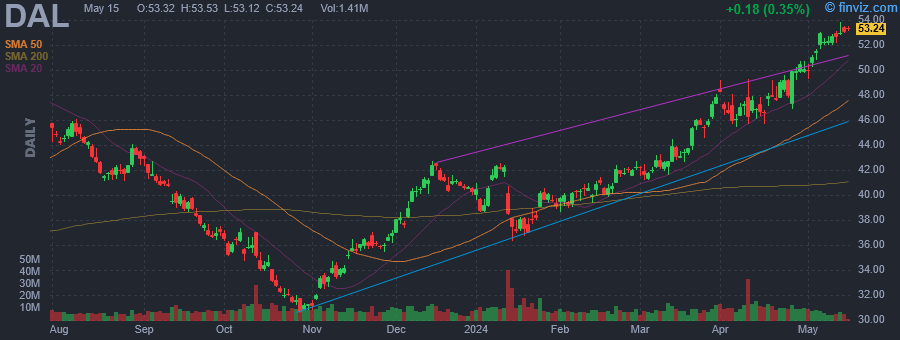
Delta Air Lines, Inc. engages in the provision of scheduled air transportation for passengers and cargo. It operates through the Airline and Refinery segments. The Airline segment provides scheduled air transportation for passengers and cargo. The Refinery segment provides jet fuel to the airline segment. The company was founded by Collett Everman Woolman in 1928 and is headquartered in Atlanta, GA. |
| Insider Trading |
Relationship |
Date |
Transaction |
Cost |
#Shares |
Value ($) |
#Shares Total |
SEC Form 4 |
| Carter Peter W | EVP - External Affairs | Apr 29 '24 | Sale | 50.00 | 50,000 | 2,500,000 | 143,328 | Apr 30 05:30 PM | | Sear Steven M | EVP - Global Sales | Apr 24 '24 | Sale | 47.90 | 15,806 | 757,028 | 88,738 | Apr 25 04:30 PM | | BELLEMARE ALAIN | EVP & Pres. - International | Apr 23 '24 | Sale | 48.86 | 24,073 | 1,176,183 | 141,451 | Apr 24 04:30 PM | | HAUENSTEIN GLEN W | President | Apr 22 '24 | Sale | 49.05 | 100,000 | 4,904,600 | 217,584 | Apr 23 04:30 PM | | Smith Joanne D | EVP & Chief People Officer | Feb 27 '24 | Sale | 42.02 | 4,876 | 204,904 | 117,267 | Feb 29 04:01 PM |
|
|
| |
 |
| Market Cap | 260.87B | EPS (ttm) | 4.21 |
| P/E | 63.96 | EPS this Y | 19.16% |
| Forward P/E | 24.29 | EPS next Y | 13.04% |
| PEG | 3.94 | EPS past 5Y | 24.06% |
| P/S | 7.48 | EPS next 5Y | 16.22% |
| P/B | 4.38 | EPS Q/Q | 1576.91% |
| Dividend | 0.13% | Sales Q/Q | 10.77% |
| Insider Own | 3.08% | Inst Own | 81.50% |
| Insider Trans | -10.41% | Inst Trans | -0.97% |
| Short Float | 1.07% | Earnings | Feb 28/a |
| Analyst Recom | 1.65 | Target Price | 336.93 |
| Avg Volume | 5.65M | 52W Range | 190.76 - 318.71 |
|
|
|
|
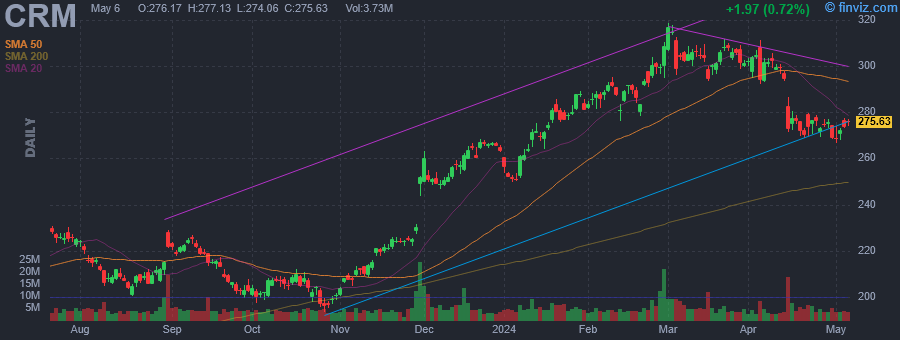
Salesforce, Inc. engages in the design and development of cloud-based enterprise software for customer relationship management. Its solutions include sales force automation, customer service and support, marketing automation, digital commerce, community management, collaboration, industry-specific solutions, and salesforce platform. The firm also provides guidance, support, training, and advisory services. The company was founded by Marc Russell Benioff and Parker Harris in 1999 and is headquartered in San Francisco, CA. |
| Insider Trading |
Relationship |
Date |
Transaction |
Cost |
#Shares |
Value ($) |
#Shares Total |
SEC Form 4 |
| Benioff Marc | Chair and CEO | Apr 29 '24 | Sale | 274.79 | 15,000 | 4,121,914 | 12,737,327 | Apr 30 05:28 PM | | Benioff Marc | Chair and CEO | Apr 26 '24 | Sale | 275.07 | 15,000 | 4,126,113 | 12,752,327 | Apr 29 05:41 PM | | Benioff Marc | Chair and CEO | Apr 25 '24 | Sale | 271.63 | 15,000 | 4,074,497 | 12,767,327 | Apr 26 04:16 PM | | Benioff Marc | Chair and CEO | Apr 24 '24 | Sale | 276.65 | 15,000 | 4,149,748 | 12,782,327 | Apr 25 04:25 PM | | Millham Brian | President and COO | Apr 24 '24 | Sale | 278.00 | 4,204 | 1,168,712 | 0 | Apr 25 04:29 PM |
|
|
|
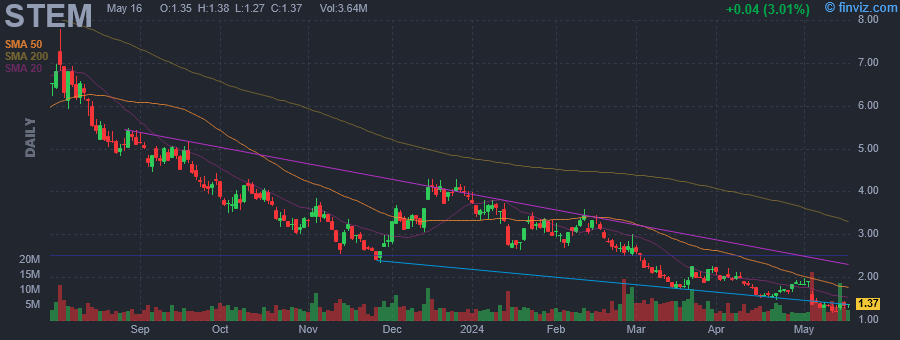 |
| Market Cap | 290.30M | EPS (ttm) | -1.28 |
| P/E | - | EPS this Y | 37.81% |
| Forward P/E | - | EPS next Y | 53.86% |
| PEG | - | EPS past 5Y | -438.13% |
| P/S | 0.63 | EPS next 5Y | - |
| P/B | 0.67 | EPS Q/Q | -5.92% |
| Dividend | - | Sales Q/Q | 7.71% |
| Insider Own | 7.83% | Inst Own | 67.51% |
| Insider Trans | -5.28% | Inst Trans | 2.03% |
| Short Float | 26.05% | Earnings | May 02/a |
| Analyst Recom | 2.33 | Target Price | 4.78 |
| Avg Volume | 4.87M | 52W Range | 1.46 - 7.78 |
|
|
|
|
Stem, Inc. engages in the provision of an energy storage system, hardware, ongoing software platform and professional services, and solar asset performance monitoring and control. The company was founded in 2009 and is headquartered in San Francisco, CA. |
| Insider Trading |
Relationship |
Date |
Transaction |
Cost |
#Shares |
Value ($) |
#Shares Total |
SEC Form 4 |
| Russo Alan | Chief Revenue Officer | Apr 30 '24 | Sale | 1.87 | 24,142 | 45,146 | 212,910 | Apr 30 05:21 PM | | BUSH WILLIAM JOHN | Chief Financial Officer | Apr 30 '24 | Sale | 1.87 | 24,035 | 44,945 | 390,217 | Apr 30 05:21 PM | | Patel Prakesh | Chief Strategy Officer | Apr 30 '24 | Sale | 1.87 | 23,863 | 44,624 | 181,668 | Apr 30 05:22 PM | | Laureles Saul R. | Chief Legal Officer | Apr 30 '24 | Sale | 1.87 | 822 | 1,537 | 150,990 | Apr 30 05:21 PM | | Russo Alan | Chief Revenue Officer | Apr 28 '24 | Option Exercise | 0.00 | 69,254 | 0 | 237,052 | Apr 30 05:21 PM |
|
|
|
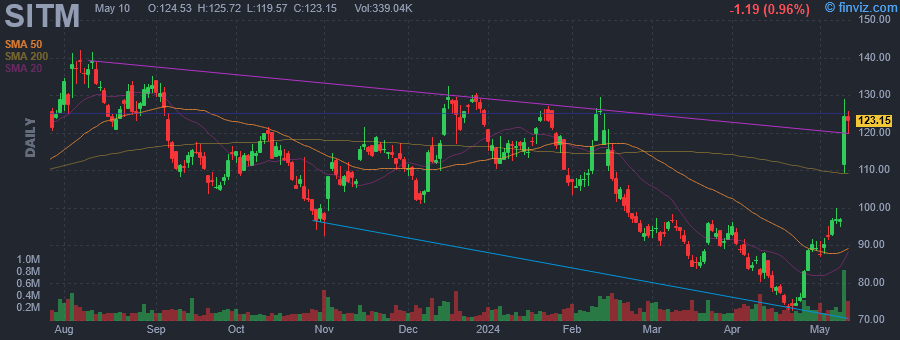 |
| Market Cap | 2.04B | EPS (ttm) | -3.63 |
| P/E | - | EPS this Y | 224.35% |
| Forward P/E | 51.54 | EPS next Y | 196.18% |
| PEG | - | EPS past 5Y | -42.16% |
| P/S | 14.15 | EPS next 5Y | 6.90% |
| P/B | 2.86 | EPS Q/Q | -1150.63% |
| Dividend | - | Sales Q/Q | -30.30% |
| Insider Own | 24.09% | Inst Own | 83.47% |
| Insider Trans | -7.81% | Inst Trans | 3.62% |
| Short Float | 7.45% | Earnings | May 08/a |
| Analyst Recom | 1.71 | Target Price | 143.50 |
| Avg Volume | 225.78K | 52W Range | 72.39 - 141.99 |
|
|
|
|
SiTime Corp.is a micro-electromechanical system-based silicon timing solution. The company is transforming the timing industry with configurable solutions that replace legacy quartz devices and enable customers to differentiate their products with performance, smaller size, lower power, and reliability. The company was founded by Markus Lutz and Aaron Partridge on December 3, 2003 and is headquartered in Santa Clara, CA. |
| Insider Trading |
Relationship |
Date |
Transaction |
Cost |
#Shares |
Value ($) |
#Shares Total |
SEC Form 4 |
| Assaderaghi Fariborz | See Remarks | Apr 26 '24 | Sale | 84.25 | 1,288 | 108,514 | 110,203 | Apr 30 05:20 PM | | Assaderaghi Fariborz | See Remarks | Mar 27 '24 | Sale | 90.57 | 1,288 | 116,661 | 111,491 | Mar 28 04:10 PM | | Assaderaghi Fariborz | See Remarks | Feb 29 '24 | Sale | 92.33 | 1,026 | 94,725 | 90,887 | Mar 01 05:30 PM | | Bonnot Lionel | See Remarks | Feb 29 '24 | Sale | 95.09 | 260 | 24,723 | 77,188 | Mar 01 05:28 PM | | MEGACHIPS CORP /FI | 10% Owner | Feb 15 '24 | Sale | 104.25 | 450,000 | 46,912,500 | 4,250,000 | Feb 20 04:30 PM |
|
|
|
