 |
| Market Cap | 4.23B | EPS (ttm) | -0.69 |
| P/E | - | EPS this Y | -174.80% |
| Forward P/E | - | EPS next Y | -11.44% |
| PEG | - | EPS past 5Y | 24.56% |
| P/S | 71.92 | EPS next 5Y | - |
| P/B | 11.89 | EPS Q/Q | 124.03% |
| Dividend | - | Sales Q/Q | 1011.42% |
| Insider Own | 27.77% | Inst Own | 68.90% |
| Insider Trans | -16.46% | Inst Trans | 37.66% |
| Short Float | 10.01% | Earnings | Mar 18/a |
| Analyst Recom | 2.75 | Target Price | 65.00 |
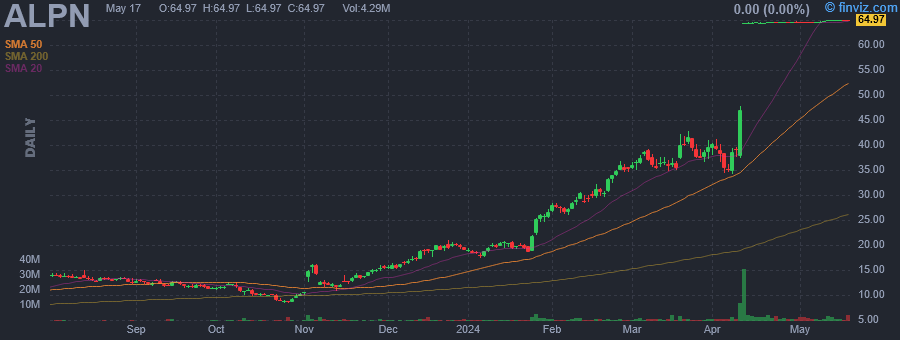
| Avg Volume | 2.20M | 52W Range | 6.71 - 64.70 |
|
|
|
|
Alpine Immune Sciences, Inc. is a clinical-stage biopharmaceutical company, which focusses on discovering and developing innovative, protein-based immunotherapies to treat autoimmune and inflammatory diseases. Its product pipeline includes inflammatory diseases, immuno-oncology, and engineered cellular therapies. The company was founded in March 2007 and is headquartered in Seattle, WA. |
| Insider Trading |
Relationship |
Date |
Transaction |
Cost |
#Shares |
Value ($) |
#Shares Total |
SEC Form 4 |
| Topper James N | Director | Apr 25 '24 | Sale | 64.57 | 19 | 1,227 | 2,829,347 | Apr 29 04:32 PM | | Rickey James Paul | See Remarks | Jan 26 '24 | Option Exercise | 8.30 | 117,764 | 977,844 | 73,764 | Jan 29 07:04 PM | | Rickey James Paul | See Remarks | Jan 26 '24 | Sale | 23.32 | 117,764 | 2,745,830 | 0 | Jan 29 07:04 PM | | Rickey James Paul | See Remarks | Jan 25 '24 | Option Exercise | 6.51 | 236 | 1,536 | 236 | Jan 29 07:04 PM | | Rickey James Paul | See Remarks | Jan 25 '24 | Sale | 22.00 | 236 | 5,192 | 0 | Jan 29 07:04 PM |
|
|
 |
 |
| Market Cap | 106.90M | EPS (ttm) | 0.42 |
| P/E | 48.62 | EPS this Y | - |
| Forward P/E | - | EPS next Y | - |
| PEG | - | EPS past 5Y | 168.54% |
| P/S | 2.40 | EPS next 5Y | - |
| P/B | 0.94 | EPS Q/Q | -99.45% |
| Dividend | - | Sales Q/Q | 39.18% |
| Insider Own | 49.31% | Inst Own | 44.27% |
| Insider Trans | 4.80% | Inst Trans | -0.56% |
| Short Float | 0.92% | Earnings | - |
| Analyst Recom | - | Target Price | - |
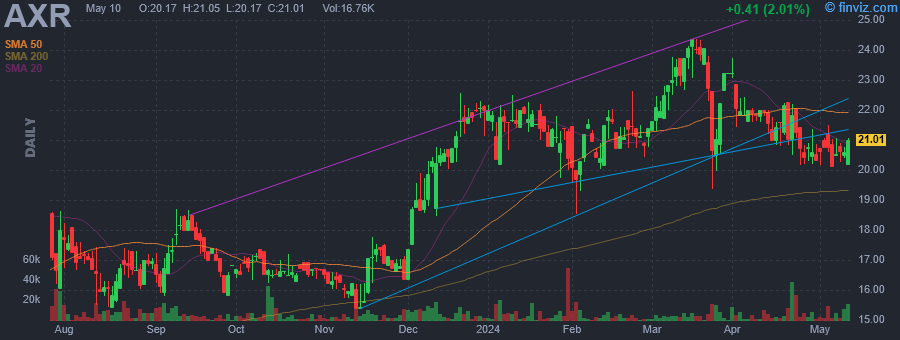
| Avg Volume | 7.28K | 52W Range | 13.46 - 24.36 |
|
|
|
|
AMREP Corp. engages in the real estate businesses. It focuses on the entitlement, development and sale of land for residential, commercial, and industrial uses. The firm operates through the following segments: Land Development, Homebuilding, and Corporate. The company was founded in 1961 and is headquartered in Havertown, PA. |
| Insider Trading |
Relationship |
Date |
Transaction |
Cost |
#Shares |
Value ($) |
#Shares Total |
SEC Form 4 |
| DAHL JAMES H | 10% Owner | Apr 29 '24 | Buy | 21.04 | 5,000 | 105,200 | 366,207 | Apr 30 04:41 PM | | Uleau Adrienne | VP, Finance and Accounting | Apr 29 '24 | Sale | 20.79 | 1,700 | 35,339 | 4,334 | Apr 29 04:31 PM | | Uleau Adrienne | VP, Finance and Accounting | Apr 25 '24 | Sale | 20.26 | 1,833 | 37,137 | 6,034 | Apr 25 04:31 PM | | Uleau Adrienne | VP, Finance and Accounting | Apr 23 '24 | Sale | 21.12 | 1,833 | 38,705 | 7,867 | Apr 25 04:31 PM | | DAHL JAMES H | 10% Owner | Apr 18 '24 | Buy | 21.82 | 2,400 | 52,359 | 361,207 | Apr 18 04:52 PM |
|
|
|
 |
| Market Cap | 11.03B | EPS (ttm) | 19.84 |
| P/E | 11.81 | EPS this Y | 19.53% |
| Forward P/E | 9.52 | EPS next Y | 3.91% |
| PEG | 1.22 | EPS past 5Y | 8.15% |
| P/S | 4.74 | EPS next 5Y | 9.70% |
| P/B | 1.84 | EPS Q/Q | 63.02% |
| Dividend | - | Sales Q/Q | 25.07% |
| Insider Own | 7.84% | Inst Own | 95.31% |
| Insider Trans | -11.07% | Inst Trans | 1.04% |
| Short Float | 9.96% | Earnings | May 01/b |
| Analyst Recom | 1.59 | Target Price | 292.81 |
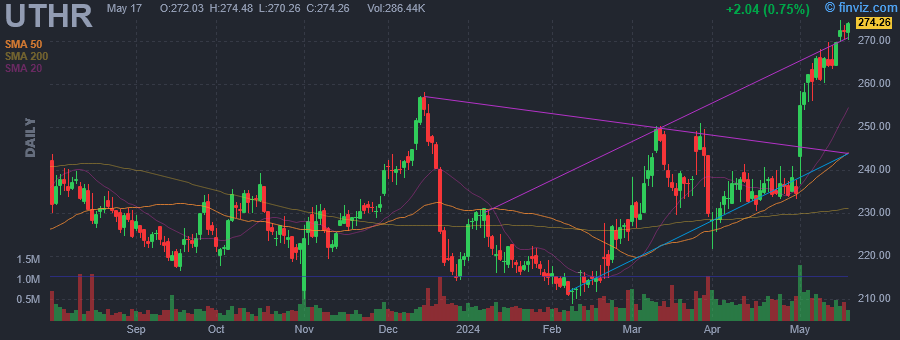
| Avg Volume | 470.95K | 52W Range | 204.44 - 261.54 |
|
|
|
|
United Therapeutics Corp. is a biotechnology company, which engages in the development and commercialization of products for patients with chronic and life-threatening conditions. Its products include Adcirca, Orenitram, Remodulin, TYVASO, and Unituxin. The company was founded by Martine A. Rothblatt on June 26, 1996 and is headquartered in Silver Spring, MD. |
| Insider Trading |
Relationship |
Date |
Transaction |
Cost |
#Shares |
Value ($) |
#Shares Total |
SEC Form 4 |
| ROTHBLATT MARTINE A | CHAIRPERSON & CEO | Apr 26 '24 | Option Exercise | 129.49 | 3,600 | 466,164 | 3,730 | Apr 29 04:30 PM | | ROTHBLATT MARTINE A | CHAIRPERSON & CEO | Apr 26 '24 | Sale | 235.20 | 3,600 | 846,705 | 130 | Apr 29 04:30 PM | | ROTHBLATT MARTINE A | CHAIRPERSON & CEO | Apr 25 '24 | Option Exercise | 129.49 | 3,600 | 466,164 | 3,730 | Apr 29 04:30 PM | | ROTHBLATT MARTINE A | CHAIRPERSON & CEO | Apr 25 '24 | Sale | 235.53 | 3,600 | 847,920 | 130 | Apr 29 04:30 PM | | ROTHBLATT MARTINE A | CHAIRPERSON & CEO | Apr 24 '24 | Option Exercise | 129.49 | 3,600 | 466,164 | 3,730 | Apr 25 04:30 PM |
|
|
| |
 |
| Market Cap | 478.35B | EPS (ttm) | 1.91 |
| P/E | 31.02 | EPS this Y | 4.63% |
| Forward P/E | 23.37 | EPS next Y | 9.49% |
| PEG | 3.88 | EPS past 5Y | 20.49% |
| P/S | 0.74 | EPS next 5Y | 8.00% |
| P/B | 5.70 | EPS Q/Q | -12.26% |
| Dividend | 1.41% | Sales Q/Q | 5.69% |
| Insider Own | 46.32% | Inst Own | 34.78% |
| Insider Trans | -1.40% | Inst Trans | -0.19% |
| Short Float | 0.83% | Earnings | May 16/b |
| Analyst Recom | 1.51 | Target Price | 65.66 |
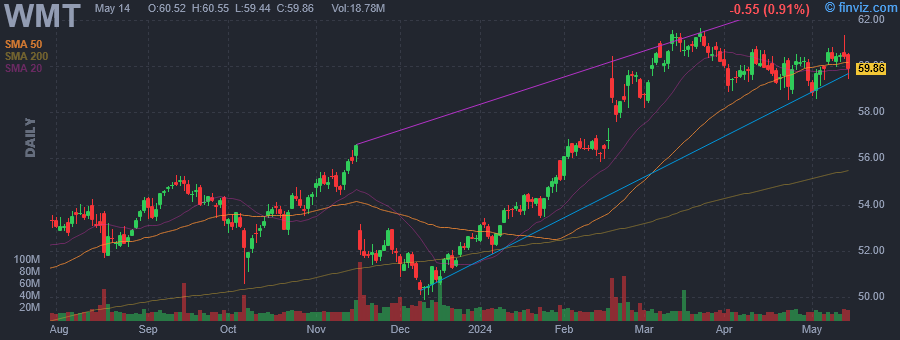
| Avg Volume | 18.96M | 52W Range | 48.34 - 61.65 |
|
|
|
|
Walmart, Inc. engages in retail and wholesale business. The company offers an assortment of merchandise and services at everyday low prices. It operates through the following business segments: Walmart U.S., Walmart International, and Sam's Club. The Walmart U.S. segment operates as a merchandiser of consumer products, operating under the Walmart, Wal-Mart, and Walmart Neighborhood Market brands, as well as walmart.com and other eCommerce brands. The Walmart International segment manages supercenters, supermarkets, hypermarkets, warehouse clubs, and cash and carry outside of the United States. The Sam's Club segment consists of membership-only warehouse clubs and samsclubs.com. The company was founded by Samuel Moore Walton and James Lawrence Walton in 1945 and is headquartered in Bentonville, AR. |
| Insider Trading |
Relationship |
Date |
Transaction |
Cost |
#Shares |
Value ($) |
#Shares Total |
SEC Form 4 |
| McMillon C Douglas | President and CEO | Apr 25 '24 | Sale | 60.03 | 29,124 | 1,748,325 | 4,018,650 | Apr 29 04:30 PM | | Rainey John D | Executive Vice President | Apr 01 '24 | Sale | 60.26 | 3,000 | 180,782 | 524,613 | Apr 02 04:53 PM | | McMillon C Douglas | President and CEO | Mar 28 '24 | Sale | 60.45 | 29,124 | 1,760,400 | 4,047,767 | Apr 01 04:32 PM | | Furner John R. | Executive Vice President | Mar 27 '24 | Sale | 60.81 | 13,125 | 798,131 | 645,517 | Apr 01 04:33 PM | | WALTON S ROBSON | Director | Mar 14 '24 | Sale | 60.93 | 345,000 | 21,020,505 | 652,044,261 | Mar 14 05:56 PM |
|
|
|
 |
| Market Cap | 4.06B | EPS (ttm) | 12.12 |
| P/E | 11.81 | EPS this Y | 13.64% |
| Forward P/E | 8.98 | EPS next Y | 13.96% |
| PEG | 1.20 | EPS past 5Y | 38.28% |
| P/S | 1.21 | EPS next 5Y | 9.80% |
| P/B | 3.09 | EPS Q/Q | 0.43% |
| Dividend | 1.24% | Sales Q/Q | 8.65% |
| Insider Own | 2.00% | Inst Own | 94.71% |
| Insider Trans | -6.65% | Inst Trans | -2.04% |
| Short Float | 2.00% | Earnings | Apr 23/b |
| Analyst Recom | 2.11 | Target Price | 191.88 |
| Avg Volume | 211.30K | 52W Range | 93.97 - 171.00 |
|
|
|
|
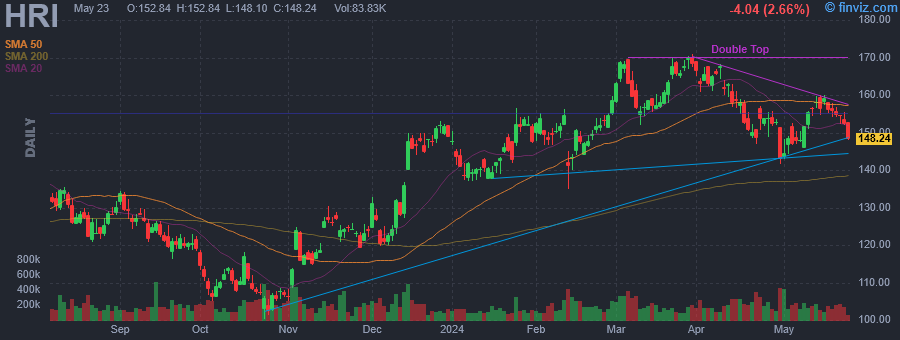
Herc Holdings, Inc. engages in the provision of equipment rental services. It also sells used equipment and contractor supplies, and provides repair, maintenance, equipment management services, safety training, and ancillary services. Its equipment for rent includes aerial, earthmoving, material handling, trucks and trailers, air compressors, compaction, and lighting. The company was founded in 1965 and is headquartered in Bonita Springs, FL. |
| Insider Trading |
Relationship |
Date |
Transaction |
Cost |
#Shares |
Value ($) |
#Shares Total |
SEC Form 4 |
| Birnbaum Aaron | SVP & Chief Operating Officer | Apr 25 '24 | Option Exercise | 70.14 | 1,278 | 89,639 | 54,076 | Apr 29 04:28 PM | | Birnbaum Aaron | SVP & Chief Operating Officer | Apr 25 '24 | Sale | 152.33 | 5,844 | 890,228 | 48,232 | Apr 29 04:28 PM | | Peres Tamir | SVP&Chief Information Officer | Mar 15 '24 | Sale | 159.10 | 3,545 | 564,010 | 41,236 | Mar 18 04:26 PM | | Cunningham Christian J | SVP & Chief HR Officer | Mar 06 '24 | Sale | 165.33 | 2,597 | 429,362 | 60,029 | Mar 08 04:33 PM | | Schumacher Mark Alan | VP & Chief Accounting Officer | Mar 05 '24 | Sale | 168.84 | 1,500 | 253,260 | 3,474 | Mar 06 04:28 PM |
|
|
| |
 |
| Market Cap | 5.24B | EPS (ttm) | 1.85 |
| P/E | 8.94 | EPS this Y | -10.39% |
| Forward P/E | 8.08 | EPS next Y | 11.45% |
| PEG | 1.12 | EPS past 5Y | 9.72% |
| P/S | 1.98 | EPS next 5Y | 8.00% |
| P/B | 0.87 | EPS Q/Q | -18.32% |
| Dividend | 3.39% | Sales Q/Q | 18.91% |
| Insider Own | 1.06% | Inst Own | 77.92% |
| Insider Trans | -1.45% | Inst Trans | -0.84% |
| Short Float | 3.06% | Earnings | Apr 23/b |
| Analyst Recom | 1.88 | Target Price | 20.00 |
| Avg Volume | 2.29M | 52W Range | 11.66 - 17.64 |
|
|
|
|
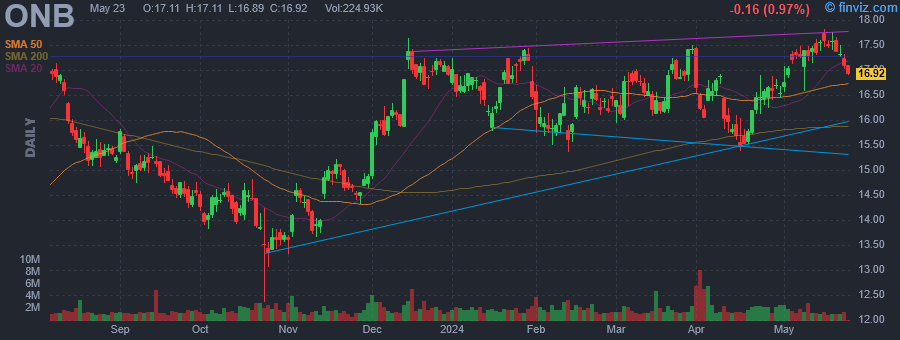
Old National Bancorp operates as a financial holding company. It engages in the provision of financial and banking solutions. The firm's Community Banking segment provides commercial, real estate and consumer loans, time deposits, checking and savings accounts, cash management, brokerage, trust and investment advisory services. The company was founded in 1982 and is headquartered in Evansville, IN. |
| Insider Trading |
Relationship |
Date |
Transaction |
Cost |
#Shares |
Value ($) |
#Shares Total |
SEC Form 4 |
| FALCONER BRENDON B | CHIEF FINANCIAL OFFICER | Apr 25 '24 | Sale | 16.28 | 49,375 | 803,825 | 88,712 | Apr 29 04:23 PM | | SCUDDER MICHAEL L | EXECUTIVE CHAIRMAN | Aug 11 '23 | Sale | 16.81 | 50,000 | 840,500 | 215,796 | Aug 15 02:41 PM | | Moran John V | EVP, CHIEF STRATEGY OFFICER | May 09 '23 | Buy | 19.85 | 2,500 | 49,625 | 2,500 | May 11 04:59 PM | | Ryan James C III | CHIEF EXECUTIVE OFFICER | May 04 '23 | Buy | 12.22 | 8,200 | 100,203 | 625,066 | May 04 04:24 PM |
|
|
|
 |
| Market Cap | 6.34B | EPS (ttm) | 4.98 |
| P/E | 11.20 | EPS this Y | -15.09% |
| Forward P/E | 11.75 | EPS next Y | 5.56% |
| PEG | 0.93 | EPS past 5Y | 42.21% |
| P/S | 1.92 | EPS next 5Y | 12.00% |
| P/B | 2.62 | EPS Q/Q | -21.07% |
| Dividend | 1.70% | Sales Q/Q | -12.51% |
| Insider Own | 3.63% | Inst Own | 96.41% |
| Insider Trans | -5.42% | Inst Trans | -0.44% |
| Short Float | 4.69% | Earnings | Apr 23/b |
| Analyst Recom | 1.00 | Target Price | 50.00 |
| Avg Volume | 713.91K | 52W Range | 34.96 - 59.59 |
|
|
|
Apr-30-24 02:24AM
|
Insider Sell: EVP, CFO & Treasurer Jeffrey Martin Sells Shares of Mueller Industries Inc (MLI)
(GuruFocus.com) |
|
Apr-29-24 04:21PM
|
Mueller Industries Insider Sold Shares Worth $3,002,050, According to a Recent SEC Filing
(MT Newswires) |
|
Apr-26-24 06:37AM
|
Marriott Vacations, Carrols Restaurant Group, and More Stocks See Action From Activist Investors
(Barrons.com) |
|
Apr-23-24 01:53PM
|
MLI Stock Earnings: Mueller Industries Beats EPS, Misses Revenue for Q1 2024
(InvestorPlace) +7.28% |
|
11:25AM
|
Mueller Industries Shares Rise Following Q1 Financial Results
(MT Newswires) |
|
07:11AM
|
Mueller Industries: Q1 Earnings Snapshot
(Associated Press Finance) |
|
07:00AM
|
Mueller Industries, Inc. Reports First Quarter 2024 Earnings
(Business Wire) |
|
Apr-22-24 07:00AM
|
Mueller Industries, Inc. Agrees to Acquire Nehring Electrical Works Company
(Business Wire) |
|
Apr-04-24 08:00AM
|
Double Your Shares, Double Your Gains: 3 Stock Split Plays for 2024
(InvestorPlace) |
|
Mar-28-24 04:18PM
|
Bares Capital's Top 12 Stock Picks
(Insider Monkey) |
|
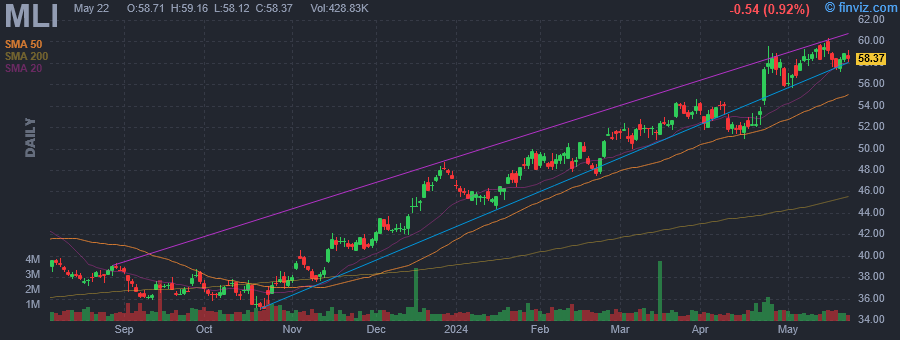
Mueller Industries, Inc. engages in the manufacture of copper, brass, aluminum, and plastic products. It operates through the following segments: Piping Systems, Industrial Metals, and Climate. The Piping Systems segment consists of Domestic Piping Systems Group, Great Lakes Copper, Heatlink Group, European Operations, Trading Group, Jungwoo-Mueller, and Mueller Middle East. The Industrial Metals segment includes Brass Rod, Impacts & Micro Gauge, and Brass Value-Added Products. The Climate segment offers Refrigeration Products, Westermeyer, Turbotec, Flex Duct, and Linesets, Inc. The company was founded on October 3, 1990 and is headquartered in Memphis, TN. |
| Insider Trading |
Relationship |
Date |
Transaction |
Cost |
#Shares |
Value ($) |
#Shares Total |
SEC Form 4 |
| GLADSTEIN GARY S | Director | Apr 29 '24 | Option Exercise | 11.76 | 9,778 | 114,940 | 11,378 | Apr 29 04:17 PM | | Martin Jeffrey Andrew | EVP, CFO & Treasurer | Apr 26 '24 | Sale | 57.25 | 52,436 | 3,002,050 | 313,529 | Apr 29 04:06 PM | | GLADSTEIN GARY S | Director | Apr 26 '24 | Sale | 58.58 | 4,250 | 248,965 | 292,206 | Apr 29 04:17 PM | | HANSEN JOHN B | Director | Apr 25 '24 | Sale | 57.29 | 4,000 | 229,178 | 104,214 | Apr 25 03:28 PM | | GOLDMAN SCOTT JAY | Director | Feb 12 '24 | Option Exercise | 11.76 | 9,778 | 114,940 | 57,852 | Feb 14 10:22 AM |
|
|
| |
 |
| Market Cap | 105.64B | EPS (ttm) | 1.20 |
| P/E | 60.05 | EPS this Y | 13.39% |
| Forward P/E | 27.26 | EPS next Y | 13.44% |
| PEG | 4.84 | EPS past 5Y | -2.05% |
| P/S | 7.18 | EPS next 5Y | 12.40% |
| P/B | 5.46 | EPS Q/Q | 61.01% |
| Dividend | - | Sales Q/Q | 13.78% |
| Insider Own | 0.44% | Inst Own | 93.77% |
| Insider Trans | -5.52% | Inst Trans | 0.92% |
| Short Float | 0.90% | Earnings | Apr 24/b |
| Analyst Recom | 1.41 | Target Price | 81.46 |
| Avg Volume | 6.62M | 52W Range | 48.35 - 74.39 |
|
|
|
|
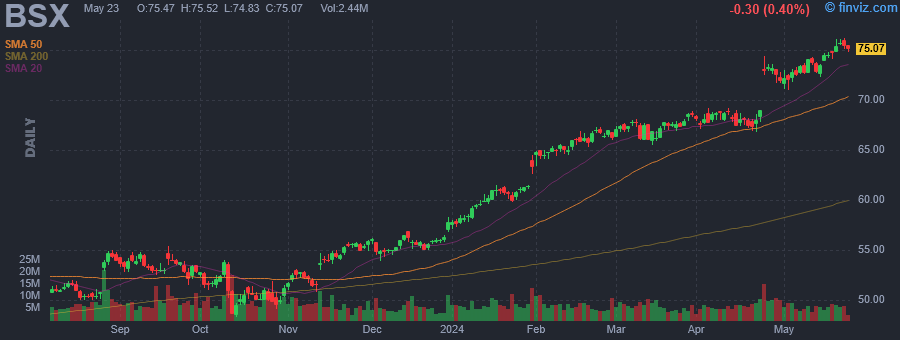
Boston Scientific Corp. engages in the development, manufacture, and marketing of medical devices that are used in interventional medical procedures. It operates through the MedSurg and Cardiovascular segments. The MedSurg segment includes Endoscopy, Urology, and Neuromodulation. The Cardiovascular segment consists of Cardiology and Peripheral Interventions. The company was founded by John E. Abele and Pete Michael Nicholas on June 29, 1979 and is headquartered in Marlborough, MA. |
| Insider Trading |
Relationship |
Date |
Transaction |
Cost |
#Shares |
Value ($) |
#Shares Total |
SEC Form 4 |
| LUDWIG EDWARD J | Director | Apr 26 '24 | Option Exercise | 17.37 | 9,818 | 170,539 | 51,192 | Apr 29 04:12 PM | | LUDWIG EDWARD J | Director | Apr 26 '24 | Sale | 73.29 | 9,818 | 719,562 | 41,374 | Apr 29 04:12 PM | | Sorenson John Bradley | EVP, Global Operations | Apr 01 '24 | Option Exercise | 16.31 | 16,351 | 266,685 | 66,989 | Apr 02 06:57 PM | | Carruthers Wendy | EVP, Human Resources | Apr 01 '24 | Option Exercise | 19.31 | 4,263 | 82,306 | 58,051 | Apr 02 06:57 PM | | Sorenson John Bradley | EVP, Global Operations | Apr 01 '24 | Sale | 69.30 | 16,351 | 1,133,069 | 50,638 | Apr 02 06:57 PM |
|
|
|
 |
| Market Cap | 842.45M | EPS (ttm) | 0.47 |
| P/E | 33.75 | EPS this Y | 0.93% |
| Forward P/E | 13.35 | EPS next Y | 26.42% |
| PEG | 1.69 | EPS past 5Y | 4.87% |
| P/S | 2.30 | EPS next 5Y | 20.00% |
| P/B | 3.26 | EPS Q/Q | 37.44% |
| Dividend | - | Sales Q/Q | -9.00% |
| Insider Own | 19.61% | Inst Own | 77.44% |
| Insider Trans | -0.30% | Inst Trans | -1.94% |
| Short Float | 6.71% | Earnings | Apr 25/b |
| Analyst Recom | 1.60 | Target Price | 22.25 |
| Avg Volume | 911.56K | 52W Range | 13.20 - 21.45 |
|
|
|
|
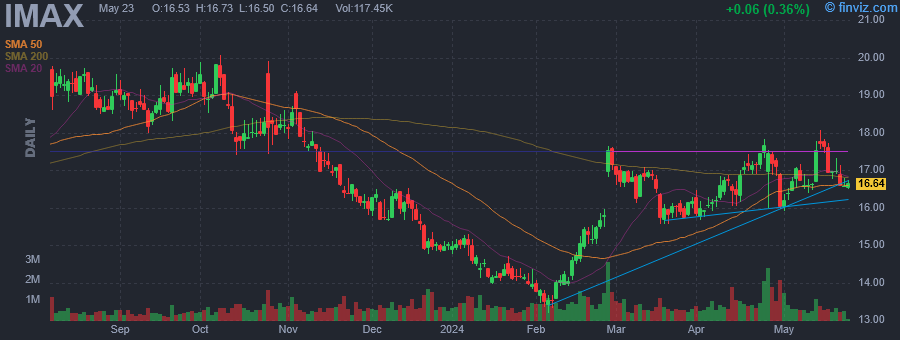
IMAX Corp. is an entertainment technology company, which engages in the business of motion picture technologies and presentations. It operates through the Content Solutions and Technology Products and Services segments. The Content Solutions segment includes content enhancement and distribution services. The Technology Products and Services segment focuses on the sale, lease, and maintenance of IMAX Systems. The company was founded by Graeme Ferguson, Roman Kroitor, Robert P. Kerr and William Shaw in 1967 and is headquartered in Mississauga, Canada. |
| Insider Trading |
Relationship |
Date |
Transaction |
Cost |
#Shares |
Value ($) |
#Shares Total |
SEC Form 4 |
| PABLO CALAMERA | CTO & EVP | Apr 26 '24 | Sale | 17.05 | 6,130 | 104,528 | 42,269 | Apr 29 04:05 PM | | LISTER ROBERT D | Chief Legal & Sr Exec VP | Mar 14 '24 | Sale | 16.87 | 25,000 | 421,825 | 138,889 | Mar 15 04:05 PM | | Dolci Giovanni M. | Chief Sales Officer | Mar 07 '24 | Option Exercise | 0.00 | 8,667 | 0 | 32,285 | Mar 11 04:05 PM | | Weissman Kenneth Ian | Deputy GC & Corp. Secretary | Mar 07 '24 | Option Exercise | 0.00 | 8,381 | 0 | 25,939 | Mar 11 04:10 PM | | Gitajn Elizabeth | SVP, Finance & Controller | Mar 07 '24 | Option Exercise | 0.00 | 1,787 | 0 | 1,787 | Mar 11 04:15 PM |
|
|
|
 |
| Market Cap | 25.50B | EPS (ttm) | 8.32 |
| P/E | 14.67 | EPS this Y | 14.20% |
| Forward P/E | 12.07 | EPS next Y | 6.67% |
| PEG | 0.95 | EPS past 5Y | 15.76% |
| P/S | 1.82 | EPS next 5Y | 15.40% |
| P/B | 2.32 | EPS Q/Q | 17.63% |
| Dividend | 1.45% | Sales Q/Q | 15.02% |
| Insider Own | 9.80% | Inst Own | 75.26% |
| Insider Trans | -0.36% | Inst Trans | 0.72% |
| Short Float | 2.13% | Earnings | Apr 24/a |
| Analyst Recom | 2.35 | Target Price | 131.69 |
| Avg Volume | 1.05M | 52W Range | 82.00 - 131.19 |
|
|
|
|
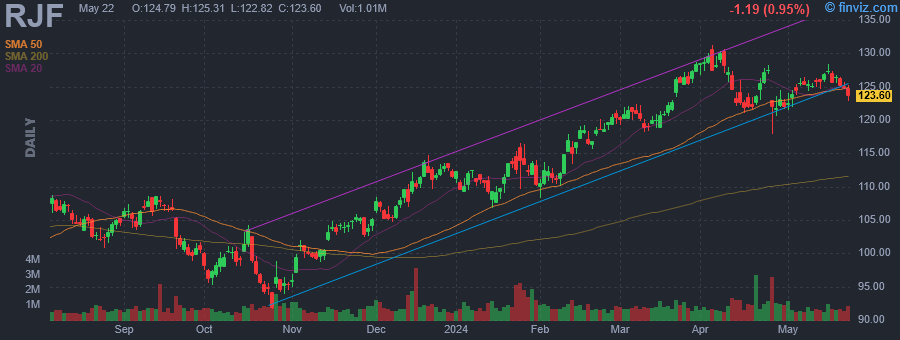
Raymond James Financial, Inc. is an investment holding company, which engages in the provision of financial and investment services. Its services include investment management, merger and acquisition and advisory, the underwriting, distribution, trading and brokerage of equity and debt securities, sale of mutual funds, corporate and retail banking, and trust services. It operates through the following segments: Private Client Group, Capital Markets, Asset Management, Bank, and Other. The Private Client Group segment provides financial planning, investment advisory, and securities transaction services to clients through financial advisors. The Capital Markets segment focuses on investment banking, institutional sales, securities trading, equity research and the syndication, and management of investments in low-income housing funds and funds of a similar nature. The Asset Management segment is involved in asset management, portfolio management, and related administrative services to retail and institutional clients. The Bank segment refers to the results of banking operations. The Other segment includes private equity investments, which predominantly consist of investments in third-party funds. The company was founded by Robert A. James in 1962 and is headquartered in St. Petersburg, FL. |
| Insider Trading |
Relationship |
Date |
Transaction |
Cost |
#Shares |
Value ($) |
#Shares Total |
SEC Form 4 |
| Raney Steven M | President & CEO RJBank | Apr 26 '24 | Sale | 121.01 | 4,174 | 505,107 | 51,009 | Apr 29 02:41 PM | | GARCIA ART A | Director | Apr 10 '24 | Option Exercise | 0.00 | 1,846 | 0 | 2,725 | Apr 12 10:22 AM | | MCDANIEL RAYMOND W | Director | Apr 10 '24 | Option Exercise | 0.00 | 1,846 | 0 | 1,846 | Apr 12 04:04 PM | | Johnson Gordon L | Director | Feb 22 '24 | Option Exercise | 0.00 | 2,281 | 0 | 40,642 | Feb 26 04:06 PM | | DUTKOWSKY ROBERT M | Director | Feb 22 '24 | Option Exercise | 0.00 | 1,643 | 0 | 11,149 | Feb 26 09:41 AM |
|
|
|
