 |
| Market Cap | 1.26B | EPS (ttm) | 5.92 |
| P/E | 7.98 | EPS this Y | -13.42% |
| Forward P/E | 9.70 | EPS next Y | -7.24% |
| PEG | 2.66 | EPS past 5Y | 17.76% |
| P/S | 3.86 | EPS next 5Y | 3.00% |
| P/B | 1.59 | EPS Q/Q | -9.33% |
| Dividend | 3.74% | Sales Q/Q | -1.66% |
| Insider Own | 4.66% | Inst Own | 76.85% |
| Insider Trans | -7.51% | Inst Trans | -1.69% |
| Short Float | 1.28% | Earnings | Apr 18/b |
| Analyst Recom | 2.33 | Target Price | 56.33 |
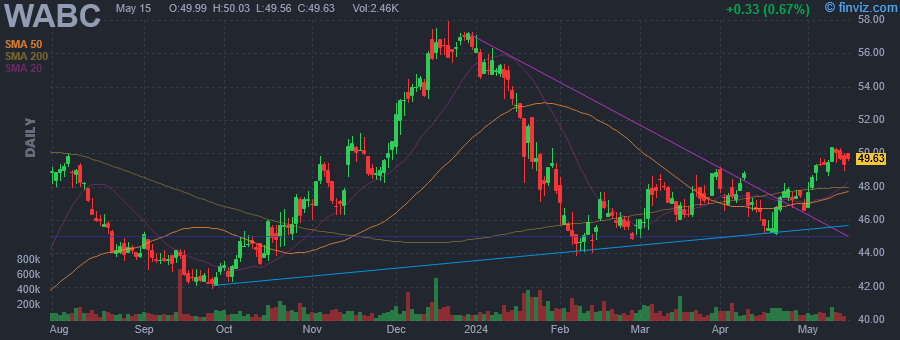
| Avg Volume | 150.08K | 52W Range | 35.52 - 57.96 |
|
|
|
|
Westamerica Bancorporation operates as a bank holding company. It provides range of banking services to individual and corporate customers in Northern and Central California. It offers loans and lines of credit, online services, mobile banking, checking, savings, credit cards, cash management, overdraft services, merchant services, professional banking, bank owned property, preventing business loans, payroll services, and trust services. The company was founded in 1972 and is headquartered in San Rafael, CA. |
| Insider Trading |
Relationship |
Date |
Transaction |
Cost |
#Shares |
Value ($) |
#Shares Total |
SEC Form 4 |
| Belew Alisa Jane | Director | Apr 23 '24 | Buy | 47.80 | 208 | 9,943 | 208 | Apr 24 03:04 PM | | THORSON JOHN A | SVP/CFO | Apr 22 '24 | Sale | 47.24 | 1,100 | 51,964 | 0 | Apr 24 03:24 PM | | PAYNE DAVID L | Chairman, President & CEO | Feb 01 '24 | Sale | 46.79 | 11,272 | 527,413 | 242,417 | Feb 01 08:25 PM | | PAYNE DAVID L | Chairman, President & CEO | Jan 31 '24 | Sale | 49.00 | 15,000 | 735,000 | 253,689 | Feb 01 08:25 PM | | PAYNE DAVID L | Chairman, President & CEO | Jan 30 '24 | Sale | 49.51 | 10,000 | 495,133 | 268,689 | Jan 30 07:32 PM |
|
|
 |
 |
| Market Cap | 40.35B | EPS (ttm) | 2.96 |
| P/E | 18.89 | EPS this Y | -7.24% |
| Forward P/E | 12.32 | EPS next Y | 2.75% |
| PEG | 2.36 | EPS past 5Y | -4.67% |
| P/S | 0.27 | EPS next 5Y | 8.00% |
| P/B | 3.47 | EPS Q/Q | 63.09% |
| Dividend | 2.13% | Sales Q/Q | 6.44% |
| Insider Own | 0.81% | Inst Own | 82.55% |
| Insider Trans | -2.20% | Inst Trans | -0.01% |
| Short Float | 2.15% | Earnings | Mar 07/b |
| Analyst Recom | 2.48 | Target Price | 58.37 |
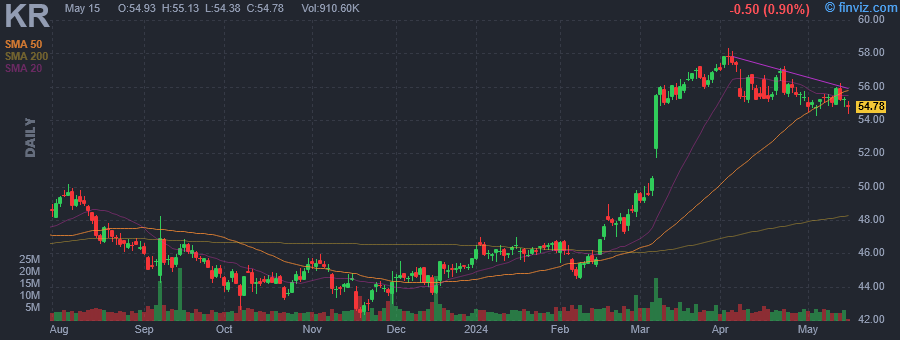
| Avg Volume | 5.20M | 52W Range | 42.10 - 58.34 |
|
|
|
|
The Kroger Co. engages in the operation of supermarkets, multi-department stores and fulfillment centers. Its brands include Big K, Smart Way, Heritage Farm, Simple Truth, and Simple Truth Organic. The company was founded by Barney Kroger in 1883 and is headquartered in Cincinnati, OH. |
| Insider Trading |
Relationship |
Date |
Transaction |
Cost |
#Shares |
Value ($) |
#Shares Total |
SEC Form 4 |
| Adcock Mary Ellen | Senior Vice President | Apr 23 '24 | Option Exercise | 24.75 | 82,806 | 2,049,243 | 276,275 | Apr 24 02:46 PM | | Massa Timothy A | Senior Vice President | Apr 23 '24 | Option Exercise | 38.33 | 29,970 | 1,148,750 | 260,831 | Apr 24 02:49 PM | | FIKE CARIN L | Vice President and Treasurer | Apr 23 '24 | Option Exercise | 38.33 | 2,672 | 102,418 | 7,697 | Apr 24 03:03 PM | | Adcock Mary Ellen | Senior Vice President | Apr 23 '24 | Sale | 55.61 | 82,806 | 4,605,194 | 193,469 | Apr 24 02:46 PM | | Massa Timothy A | Senior Vice President | Apr 23 '24 | Sale | 57.18 | 29,970 | 1,713,685 | 230,861 | Apr 24 02:49 PM |
|
|
|
 |
| Market Cap | 132.35B | EPS (ttm) | 5.54 |
| P/E | 67.32 | EPS this Y | 9.95% |
| Forward P/E | 50.71 | EPS next Y | 17.21% |
| PEG | 5.36 | EPS past 5Y | 9.71% |
| P/S | 18.08 | EPS next 5Y | 12.56% |
| P/B | 9.48 | EPS Q/Q | 51.45% |
| Dividend | - | Sales Q/Q | 11.46% |
| Insider Own | 0.69% | Inst Own | 85.39% |
| Insider Trans | -11.64% | Inst Trans | -0.44% |
| Short Float | 0.91% | Earnings | Apr 18/a |
| Analyst Recom | 2.00 | Target Price | 425.03 |
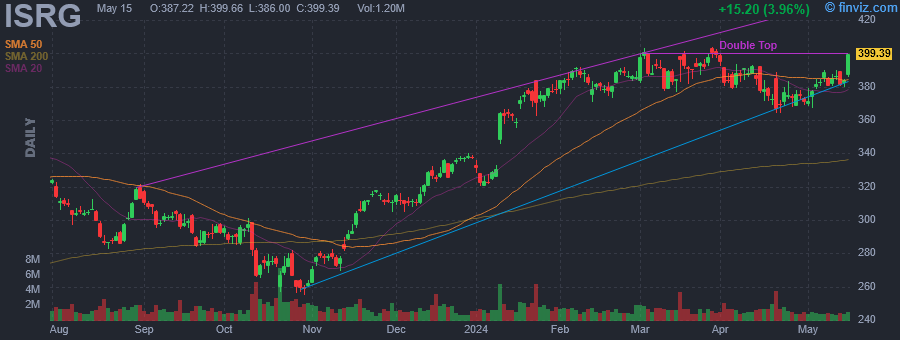
| Avg Volume | 1.56M | 52W Range | 254.85 - 403.76 |
|
|
|
|
Intuitive Surgical, Inc. engages in the provision of robotic-assisted surgical solutions and invasive care through a comprehensive ecosystem of products and services. Its products include Da Vinci Surgical and Ion Endoluminal systems. The company was founded by Frederic H. Moll, John Gordon Freund, and Robert G. Younge in November 1995 and is headquartered in Sunnyvale, CA. |
| Insider Trading |
Relationship |
Date |
Transaction |
Cost |
#Shares |
Value ($) |
#Shares Total |
SEC Form 4 |
| Curet Myriam | EVP & Chief Medical Officer | Apr 23 '24 | Option Exercise | 180.27 | 5,318 | 958,650 | 3,116 | Apr 24 01:18 PM | | LEVY ALAN J | Director | Apr 23 '24 | Option Exercise | 154.24 | 2,000 | 308,473 | 27,319 | Apr 24 02:22 PM | | Curet Myriam | EVP & Chief Medical Officer | Apr 23 '24 | Sale | 370.66 | 5,318 | 1,971,160 | 298 | Apr 24 01:18 PM | | LEVY ALAN J | Director | Apr 23 '24 | Sale | 370.70 | 2,000 | 741,398 | 25,319 | Apr 24 02:22 PM | | Widman Fredrik | VP Corporate Controller | Mar 15 '24 | Option Exercise | 59.23 | 1,224 | 72,495 | 722 | Mar 18 02:35 PM |
|
|
| |
 |
| Market Cap | 8.41B | EPS (ttm) | 0.31 |
| P/E | 68.23 | EPS this Y | 15.25% |
| Forward P/E | 14.43 | EPS next Y | 15.27% |
| PEG | 4.94 | EPS past 5Y | -3.14% |
| P/S | 1.39 | EPS next 5Y | 13.80% |
| P/B | 4.25 | EPS Q/Q | -109.28% |
| Dividend | 2.47% | Sales Q/Q | -7.59% |
| Insider Own | 78.00% | Inst Own | 20.60% |
| Insider Trans | -0.10% | Inst Trans | 0.93% |
| Short Float | 10.93% | Earnings | Apr 03/a |
| Analyst Recom | 2.14 | Target Price | 21.98 |
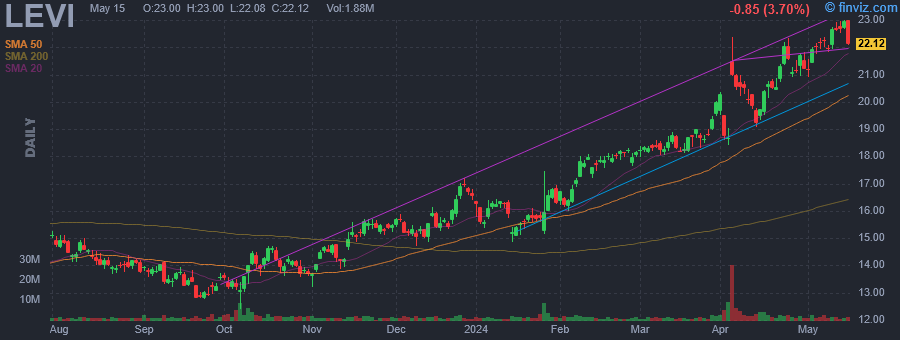
| Avg Volume | 2.88M | 52W Range | 12.41 - 22.39 |
|
|
|
|
Levi Strauss & Co. engages in the design, marketing, and sale of apparel products. The company offers jeans, casual and dress pants, tops, shorts, skirts, jackets, footwear, and related accessories. It operates through the following geographical segments: Americas, Europe, and Asia. The company was founded by Levi Strauss in 1853 and is headquartered in San Francisco, CA. |
| Insider Trading |
Relationship |
Date |
Transaction |
Cost |
#Shares |
Value ($) |
#Shares Total |
SEC Form 4 |
| Haas Bradley J. | 10% Owner | Apr 23 '24 | Sale | 22.06 | 85,985 | 1,896,545 | 0 | Apr 24 12:07 PM | | Haas Bradley J. | 10% Owner | Apr 04 '24 | Sale | 22.05 | 14,015 | 309,081 | 0 | Apr 05 04:36 PM | | Haas Bradley J. | 10% Owner | Apr 01 '24 | Sale | 20.14 | 26,959 | 542,871 | 0 | Apr 02 12:38 PM | | Friedman David A | Director | Apr 01 '24 | Sale | 20.00 | 10,422 | 208,470 | 169,008 | Apr 01 06:13 PM | | Friedman David A | Director | Mar 28 '24 | Sale | 20.00 | 35,415 | 708,449 | 179,430 | Apr 01 06:13 PM |
|
|
|
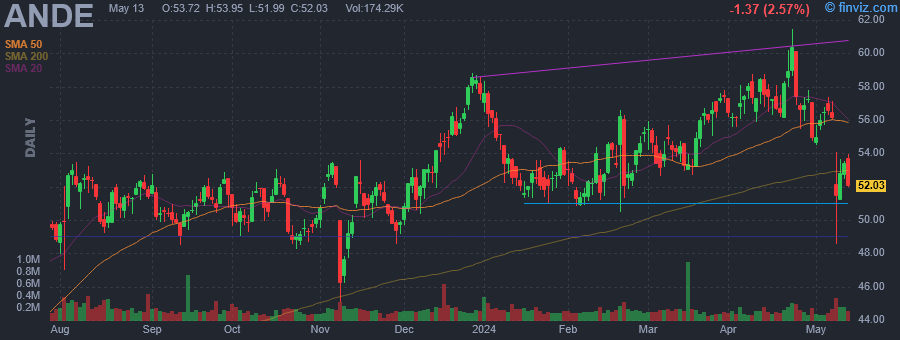 |
| Market Cap | 1.91B | EPS (ttm) | 2.95 |
| P/E | 19.21 | EPS this Y | 0.85% |
| Forward P/E | 14.57 | EPS next Y | 31.03% |
| PEG | 2.40 | EPS past 5Y | 15.08% |
| P/S | 0.13 | EPS next 5Y | 8.00% |
| P/B | 1.49 | EPS Q/Q | 473.08% |
| Dividend | 1.34% | Sales Q/Q | -31.31% |
| Insider Own | 5.25% | Inst Own | 89.47% |
| Insider Trans | -8.00% | Inst Trans | -0.96% |
| Short Float | 2.38% | Earnings | May 07/a |
| Analyst Recom | 1.00 | Target Price | 67.50 |
| Avg Volume | 178.64K | 52W Range | 35.69 - 61.46 |
|
|
|
|
The Andersons, Inc. is an agriculturally rooted diversified company, which engages in railcar leasing and repair, turf products production, and consumer retailing. It operates through the following segments: Trade, Renewables, and Plant Nutrient. The Trade segment includes commodity merchandising and the operation of terminal grain elevator facilities. The Renewables segment produces, purchases and sells ethanol and co-products. This segment also operates a merchandising and trade portfolio of ethanol, ethanol co-products and other biofuels such as renewable diesel. The Plant Nutrient segment manufactures and distributes agricultural inputs, primary nutrients and specialty fertilizers, to dealers and farmers, along with turf care and corncob-based products. The company was founded by Harold Anderson and Margaret Anderson in 1947 and is headquartered in Maumee, OH. |
| Insider Trading |
Relationship |
Date |
Transaction |
Cost |
#Shares |
Value ($) |
#Shares Total |
SEC Form 4 |
| Bowe Patrick E. | President & CEO | Apr 23 '24 | Sale | 60.56 | 5,419 | 328,175 | 79,740 | Apr 24 11:11 AM | | Bowe Patrick E. | President & CEO | Apr 22 '24 | Sale | 60.01 | 3,387 | 203,254 | 85,159 | Apr 24 11:11 AM | | ANDERSON MICHAEL J | Director | Apr 22 '24 | Sale | 59.00 | 3,000 | 177,014 | 209,968 | Apr 24 11:09 AM | | Bowe Patrick E. | President & CEO | Mar 20 '24 | Sale | 55.69 | 769 | 42,826 | 88,546 | Mar 21 11:56 AM | | Bowe Patrick E. | President & CEO | Mar 19 '24 | Sale | 55.12 | 1,338 | 73,751 | 89,315 | Mar 21 11:56 AM |
|
|
| |
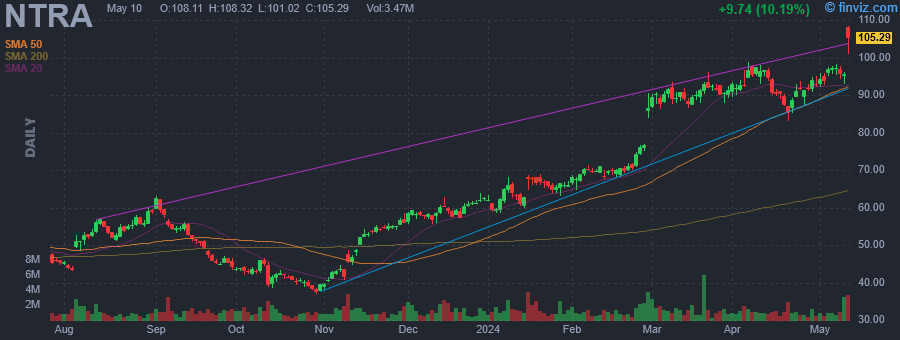 |
| Market Cap | 11.02B | EPS (ttm) | -3.80 |
| P/E | - | EPS this Y | 38.74% |
| Forward P/E | - | EPS next Y | 48.70% |
| PEG | - | EPS past 5Y | -11.28% |
| P/S | 10.18 | EPS next 5Y | - |
| P/B | 14.26 | EPS Q/Q | 52.15% |
| Dividend | - | Sales Q/Q | 43.20% |
| Insider Own | 6.33% | Inst Own | 92.68% |
| Insider Trans | -15.68% | Inst Trans | 1.77% |
| Short Float | 5.09% | Earnings | Feb 28/a |
| Analyst Recom | 1.50 | Target Price | 103.44 |
| Avg Volume | 1.42M | 52W Range | 36.90 - 98.82 |
|
|
|
|
Natera, Inc. is a diagnostics company, which engages in the discovery, development, and commercialization of genetic testing services. It provides Panorama non-invasive prenatal test (NIPT), Vistara, horizon carrier screening (HCS), spectrum pre-implantation genetic screening and spectrum pre-implantation genetic diagnosis, Anora products of conception (POC) and non-invasive paternity testing (PAT). The company was founded by Matthew Rabinowitz and Jonathan Sheena in November 2003 and is headquartered in Austin, TX. |
| Insider Trading |
Relationship |
Date |
Transaction |
Cost |
#Shares |
Value ($) |
#Shares Total |
SEC Form 4 |
| Chapman Steven Leonard | CEO AND PRESIDENT | Apr 23 '24 | Sale | 91.38 | 2,552 | 233,200 | 230,319 | Apr 23 09:35 PM | | Brophy Michael Burkes | CHIEF FINANCIAL OFFICER | Apr 23 '24 | Sale | 91.38 | 1,523 | 139,171 | 73,039 | Apr 23 09:35 PM | | RABINOWITZ DANIEL | SEC. AND CHIEF LEGAL OFFICER | Apr 23 '24 | Sale | 91.38 | 787 | 71,915 | 205,552 | Apr 23 09:35 PM | | Moshkevich Solomon | PRESIDENT, CLINICALDIAGNOSTICS | Apr 23 '24 | Sale | 91.38 | 531 | 48,522 | 117,029 | Apr 23 09:35 PM | | Fesko John | PRESIDENT, CHIEF BUS. OFFICER | Apr 23 '24 | Sale | 91.38 | 522 | 47,700 | 111,677 | Apr 23 09:35 PM |
|
|
|
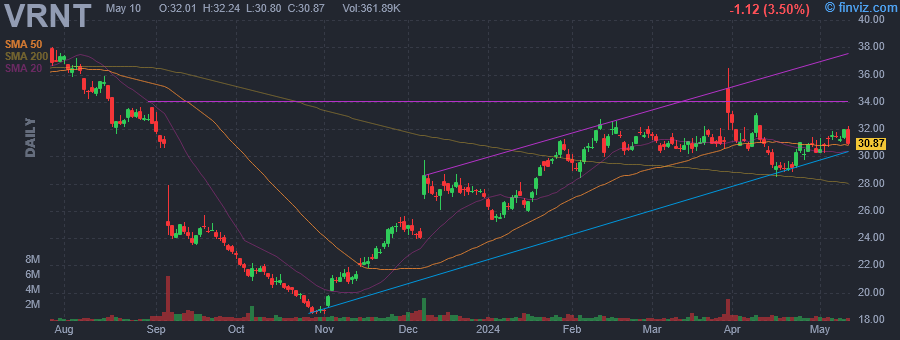 |
| Market Cap | 1.88B | EPS (ttm) | 0.28 |
| P/E | 106.11 | EPS this Y | 5.49% |
| Forward P/E | 9.75 | EPS next Y | 7.52% |
| PEG | 10.66 | EPS past 5Y | -22.59% |
| P/S | 2.07 | EPS next 5Y | 9.95% |
| P/B | 2.28 | EPS Q/Q | 217.92% |
| Dividend | - | Sales Q/Q | 12.22% |
| Insider Own | 2.40% | Inst Own | 96.81% |
| Insider Trans | -16.15% | Inst Trans | 0.27% |
| Short Float | 2.94% | Earnings | Mar 27/a |
| Analyst Recom | 1.86 | Target Price | 36.17 |
| Avg Volume | 557.42K | 52W Range | 18.41 - 40.28 |
|
|
|
|
Verint Systems, Inc. engages in providing actionable intelligence. It operates through the following segments: Customer Engagement Solutions and Cyber Intelligence Solutions. The Customer Engagement segment includes customer-centric organizations optimize customer engagement, increase customer loyalty, and maximize revenue opportunities, while generating operational efficiencies, reducing cost, and mitigating risk. The Cyber Intelligence Solutions segment addresses the security intelligence market. The company was founded by Daniel Bodner in February 1994 and is headquartered in Melville, NY. |
| Insider Trading |
Relationship |
Date |
Transaction |
Cost |
#Shares |
Value ($) |
#Shares Total |
SEC Form 4 |
| BODNER DAN | Chairman & CEO | Apr 23 '24 | Sale | 30.00 | 35,039 | 1,051,170 | 991,748 | Apr 23 09:01 PM | | BODNER DAN | Chairman & CEO | Apr 15 '24 | Sale | 30.09 | 44,335 | 1,334,040 | 898,234 | Apr 16 04:21 PM | | MORIAH ELAN | President | Apr 15 '24 | Sale | 30.09 | 9,880 | 297,289 | 91,877 | Apr 16 04:49 PM | | FANTE PETER | Chief Administrative Officer | Apr 15 '24 | Sale | 30.09 | 6,244 | 187,882 | 50,511 | Apr 16 04:23 PM | | Highlander Grant A | Chief Financial Officer | Apr 15 '24 | Sale | 30.09 | 2,062 | 62,046 | 82,442 | Apr 16 05:34 PM |
|
|
| |
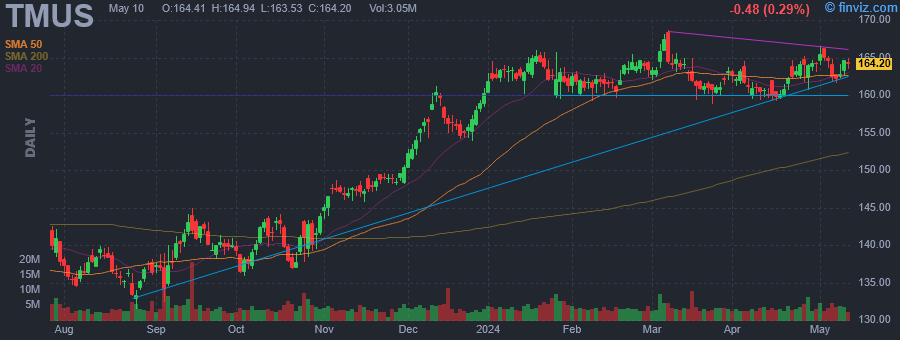 |
| Market Cap | 194.71B | EPS (ttm) | 6.94 |
| P/E | 23.65 | EPS this Y | 29.71% |
| Forward P/E | 14.71 | EPS next Y | 24.04% |
| PEG | 0.93 | EPS past 5Y | 15.59% |
| P/S | 2.48 | EPS next 5Y | 25.48% |
| P/B | 3.03 | EPS Q/Q | 41.09% |
| Dividend | 1.53% | Sales Q/Q | 1.01% |
| Insider Own | 62.79% | Inst Own | 38.27% |
| Insider Trans | -2.01% | Inst Trans | -1.03% |
| Short Float | 5.25% | Earnings | Apr 25/a |
| Analyst Recom | 1.54 | Target Price | 188.59 |
| Avg Volume | 4.47M | 52W Range | 124.92 - 168.64 |
|
|
|
|
T-Mobile US, Inc. engages in the provision of wireless communications services under the T-Mobile and MetroPCS brands. It offers postpaid and prepaid wireless voice, messaging and data services, and wholesale wireless services. The company was founded in 1994 and is headquartered in Bellevue, WA. |
| Insider Trading |
Relationship |
Date |
Transaction |
Cost |
#Shares |
Value ($) |
#Shares Total |
SEC Form 4 |
| DEUTSCHE TELEKOM AG | Director | Apr 23 '24 | Sale | 163.36 | 189,670 | 30,983,611 | 678,676,051 | Apr 23 07:48 PM | | DEUTSCHE TELEKOM AG | Director | Apr 22 '24 | Sale | 162.58 | 189,670 | 30,837,014 | 678,865,721 | Apr 23 07:48 PM | | DEUTSCHE TELEKOM AG | Director | Apr 19 '24 | Sale | 161.87 | 189,670 | 30,702,830 | 679,055,391 | Apr 23 07:48 PM | | DEUTSCHE TELEKOM AG | Director | Apr 18 '24 | Sale | 160.66 | 189,670 | 30,472,591 | 679,245,061 | Apr 18 07:26 PM | | DEUTSCHE TELEKOM AG | Director | Apr 17 '24 | Sale | 159.98 | 170,703 | 27,309,570 | 679,434,731 | Apr 18 07:26 PM |
|
|
|
 |
| Market Cap | 763.76M | EPS (ttm) | -1.52 |
| P/E | - | EPS this Y | 42.31% |
| Forward P/E | - | EPS next Y | 47.56% |
| PEG | - | EPS past 5Y | 0.51% |
| P/S | 5.33 | EPS next 5Y | 10.00% |
| P/B | 2.26 | EPS Q/Q | 74.02% |
| Dividend | - | Sales Q/Q | -26.04% |
| Insider Own | 4.71% | Inst Own | 100.98% |
| Insider Trans | -7.14% | Inst Trans | 5.04% |
| Short Float | 7.18% | Earnings | Feb 29/a |
| Analyst Recom | 1.25 | Target Price | 22.86 |
| Avg Volume | 373.32K | 52W Range | 8.92 - 24.50 |
|
|
|
|
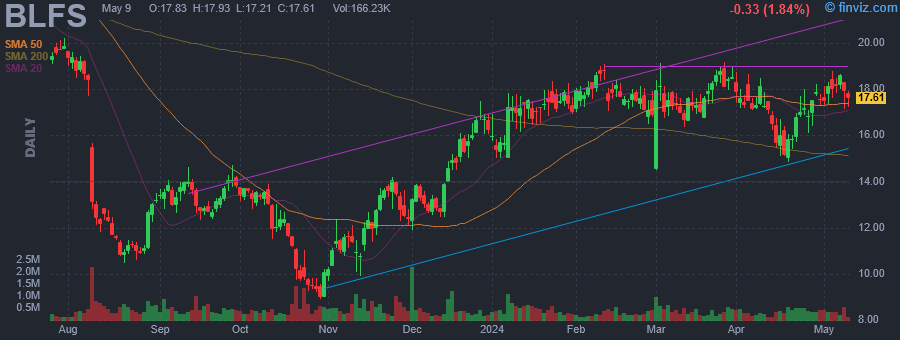
BioLife Solutions, Inc. engages in the development, manufacture and marketing of bio preservation tools for cells and tissues. Its product offerings include proprietary hypothermic storage and cryopreservation freeze media products for cells, tissues, and organs, generic blood stem cell freezing and cell thawing media products and custom product formulation and custom packaging services. The company was founded by Boris Rubinsky in 1987 and is headquartered in Bothell, WA. |
| Insider Trading |
Relationship |
Date |
Transaction |
Cost |
#Shares |
Value ($) |
#Shares Total |
SEC Form 4 |
| Aebersold Sarah | Chief Human Resources Officer | Apr 22 '24 | Sale | 16.50 | 410 | 6,765 | 65,085 | Apr 23 07:15 PM | | Wichterman Troy | Chief Financial Officer | Apr 18 '24 | Sale | 15.31 | 956 | 14,636 | 126,658 | Apr 23 07:14 PM | | Mathew Aby J. | EVP & Chief Scientific Officer | Apr 18 '24 | Sale | 15.31 | 584 | 8,941 | 319,098 | Apr 23 07:14 PM | | Foster Karen A. | Chief Quality and Operations | Apr 18 '24 | Sale | 15.31 | 481 | 7,364 | 158,664 | Apr 23 07:14 PM | | Aebersold Sarah | Chief Human Resources Officer | Apr 18 '24 | Sale | 15.31 | 348 | 5,328 | 65,495 | Apr 23 07:15 PM |
|
|
|
 |
| Market Cap | 32.13B | EPS (ttm) | 3.22 |
| P/E | 61.89 | EPS this Y | 26.99% |
| Forward P/E | 29.15 | EPS next Y | 11.12% |
| PEG | 4.44 | EPS past 5Y | 16.91% |
| P/S | 13.59 | EPS next 5Y | 13.95% |
| P/B | 6.91 | EPS Q/Q | -22.75% |
| Dividend | - | Sales Q/Q | 11.93% |
| Insider Own | 8.92% | Inst Own | 80.00% |
| Insider Trans | -0.55% | Inst Trans | -1.07% |
| Short Float | 1.59% | Earnings | Feb 29/a |
| Analyst Recom | 1.96 | Target Price | 241.87 |
| Avg Volume | 969.37K | 52W Range | 160.21 - 236.90 |
|
|
|
|
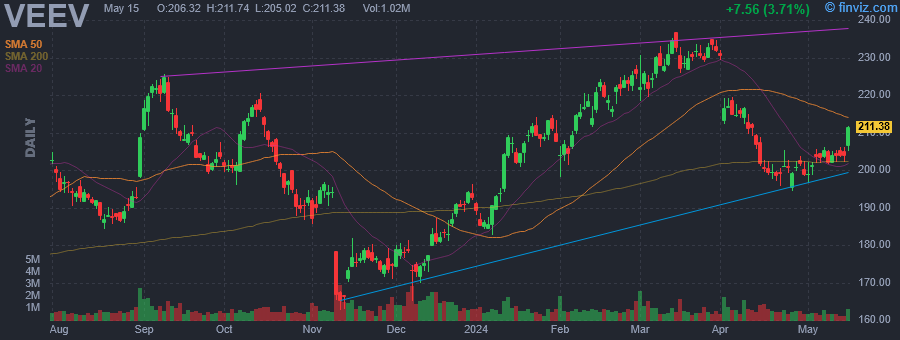
Veeva Systems, Inc. engages in the provision of industry cloud solutions for the global life sciences industry. Its solutions enable pharmaceutical and other life sciences companies to realize the benefits of modern cloud-based architectures and mobile applications for their most critical business functions, without compromising industry-specific functionality or regulatory compliance. The firm's customer relationship management solutions enable its customers to increase the productivity and compliance of their sales and marketing functions. Its regulated content management and collaboration solutions enable its customers to more efficiently manage regulated, content-centric processes across the enterprise. The company's customer master solution enables customers to more effectively manage complex healthcare provider and healthcare organization data. The company was founded by Mark Armenante, Peter P. Gassner, Doug Ostler, Mitch Wallace and Matthew J. Wallach on January 12, 2007, and is headquartered in Pleasanton, CA. |
| Insider Trading |
Relationship |
Date |
Transaction |
Cost |
#Shares |
Value ($) |
#Shares Total |
SEC Form 4 |
| MATEO ALAN | EVP Global Sales | Apr 23 '24 | Sale | 200.86 | 3,391 | 681,116 | 21,983 | Apr 23 07:09 PM | | Faddis Jonathan | SVP, Gen. Counsel, Secretary | Apr 15 '24 | Sale | 207.42 | 3,598 | 746,297 | 10,668 | Apr 16 04:33 PM | | Faddis Jonathan | SVP, Gen. Counsel, Secretary | Apr 01 '24 | Option Exercise | 0.00 | 1,296 | 0 | 19,729 | Apr 02 03:41 PM | | Bowman Brent R | Former Chief Financial Officer | Apr 01 '24 | Option Exercise | 0.00 | 1,296 | 0 | 9,287 | Apr 02 03:43 PM | | DIAMOND KRISTINE | Chief Accounting Officer | Apr 01 '24 | Option Exercise | 0.00 | 220 | 0 | 435 | Apr 02 03:44 PM |
|
|
|
