 |
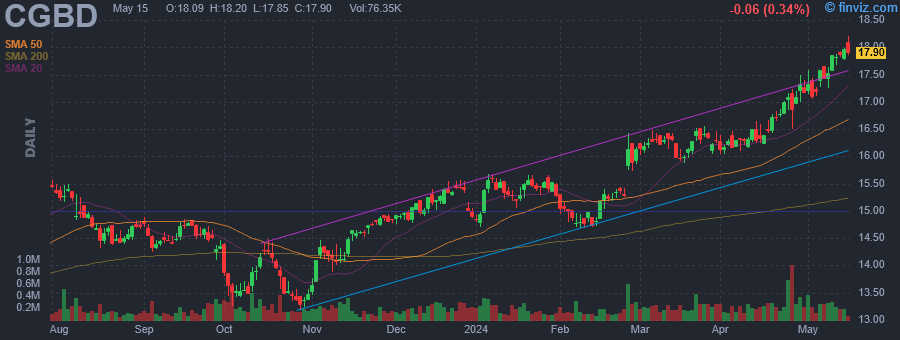
| Market Cap | 855.89M | EPS (ttm) | 1.59 |
| P/E | 10.62 | EPS this Y | 10.30% |
| Forward P/E | 9.15 | EPS next Y | -8.54% |
| PEG | 5.31 | EPS past 5Y | 20.30% |
| P/S | 3.54 | EPS next 5Y | 2.00% |
| P/B | 0.99 | EPS Q/Q | 149.80% |
| Dividend | 8.90% | Sales Q/Q | 12.00% |
| Insider Own | 0.20% | Inst Own | 22.30% |
| Insider Trans | 0.00% | Inst Trans | -6.13% |
| Short Float | 0.76% | Earnings | May 07/a |
| Analyst Recom | 2.60 | Target Price | 16.12 |
| Avg Volume | 217.03K | 52W Range | 12.87 - 17.17 |
|
|
|
Apr-22-24 12:00PM
|
What Makes Carlyle Secured Lending (CGBD) a New Buy Stock
(Zacks) |
|
12:00PM
|
Are You Looking for a Top Momentum Pick? Why Carlyle Secured Lending, Inc. (CGBD) is a Great Choice
(Zacks) |
|
Apr-11-24 04:05PM
|
Carlyle Secured Lending, Inc. Schedules Earnings Release and Quarterly Earnings Call to Discuss its First Quarter Ended March 31, 2024 Financial Results
(GlobeNewswire) |
|
Mar-04-24 06:05AM
|
Carlyle Secured Lending, Inc. Names Justin Plouffe CEO and Member of the Board of Directors
(GlobeNewswire) |
|
Feb-26-24 05:49PM
|
Carlyle Secured Lending, Inc. Announces Fourth Quarter and Full Year 2023 Financial Results, Increases Base Dividend to $0.40 Per Common Share and Declares First Quarter 2024 Dividends of $0.48 Per Common Share
(GlobeNewswire) |
|
05:31PM
|
Carlyle Secured Lending Inc (CGBD) Announces Dividend Increase and Steady Performance in Q4 and ...
(GuruFocus.com) |
|
Jan-23-24 04:39PM
|
Carlyle Secured Lending, Inc. Schedules Fourth Quarter and Full Year 2023 Financial Results and Investor Conference Call
(GlobeNewswire) |
|
Jan-17-24 05:20PM
|
Carlyle Secured Lending, Inc. Schedules Fourth Quarter and Full Year 2023 Financial Results and Investor Conference Call
(GlobeNewswire) |
|
Nov-13-23 03:31PM
|
Carlyle Secured Lending, Inc. Prices Public Offering of 8.20% Notes Due 2028
(GlobeNewswire) |
|
Nov-07-23 05:31PM
|
Carlyle Secured Lending, Inc. Announces Third Quarter 2023 Financial Results, Declares Fourth Quarter 2023 Dividends of $0.44 Per Common Share
(GlobeNewswire) |
|
Carlyle Secured Lending, Inc. is business development company specializing in first lien debt, senior secured loans, second lien senior secured loan unsecured debt, mezzanine debt and investments in equities. It specializes in directly investing. It specializes in middle market. It targets healthcare and pharmaceutical, aerospace and defense, high tech industries, business services, software, beverage food and tobacco, hotel gamming and leisure, banking finance insurance and in real estate sector. The fund seeks to invest across United States of America, Luxembourg, Cayman Islands, Cyprus, and United Kingdom. It invests in companies with EBITDA between $25 million and $100 million. |
| Insider Trading |
Relationship |
Date |
Transaction |
Cost |
#Shares |
Value ($) |
#Shares Total |
SEC Form 4 |
| Popov Alexander | VP and Head of Illiquid Credit | Aug 30 '23 | Buy | 14.78 | 5,000 | 73,900 | 32,977 | Aug 31 04:27 PM | | LeeKong Aren C. | CEO and President | Jun 09 '23 | Buy | 14.74 | 3,394 | 50,028 | 25,156 | Jun 13 04:38 PM | | LeeKong Aren C. | CEO and President | Jun 05 '23 | Buy | 14.19 | 6 | 85 | 21,762 | Jun 06 04:00 PM | | LeeKong Aren C. | CEO and President | Jun 01 '23 | Buy | 13.73 | 1,454 | 19,963 | 21,756 | Jun 02 04:06 PM | | LeeKong Aren C. | CEO and President | May 31 '23 | Buy | 13.65 | 1,454 | 19,847 | 20,302 | Jun 01 04:16 PM |
|
|
 |
 |
| Market Cap | 3.07B | EPS (ttm) | 0.36 |
| P/E | 31.07 | EPS this Y | 45.12% |
| Forward P/E | 16.38 | EPS next Y | 15.13% |
| PEG | - | EPS past 5Y | -21.57% |
| P/S | 3.58 | EPS next 5Y | - |
| P/B | 0.79 | EPS Q/Q | -212.57% |
| Dividend | 2.05% | Sales Q/Q | 274.09% |
| Insider Own | 12.52% | Inst Own | 74.63% |
| Insider Trans | 0.00% | Inst Trans | - |
| Short Float | 1.18% | Earnings | Feb 27/a |
| Analyst Recom | 3.22 | Target Price | 11.06 |
| Avg Volume | 5.74M | 52W Range | 6.53 - 11.19 |
|
|
|
|
Tricon Residential, Inc. is a residential real estate investment company, which engages in renting homes and apartments. It operates through the following business segments: Single-Family Rental, Adjacent Businesses, Private Funds and Advisory and Corporate. The Single-Family Rental Business segment owns and operates single family rental homes. The Private Funds and Advisory segment provide asset management, property management, and development management services. The Corporate segment includes providing support functions in the areas of accounting, treasury, credit management, information technology, legal, and human resources. The company was founded by Geoffrey Matus and David Berman on June 3, 1988 and is headquartered in Toronto, Canada. |
|
|
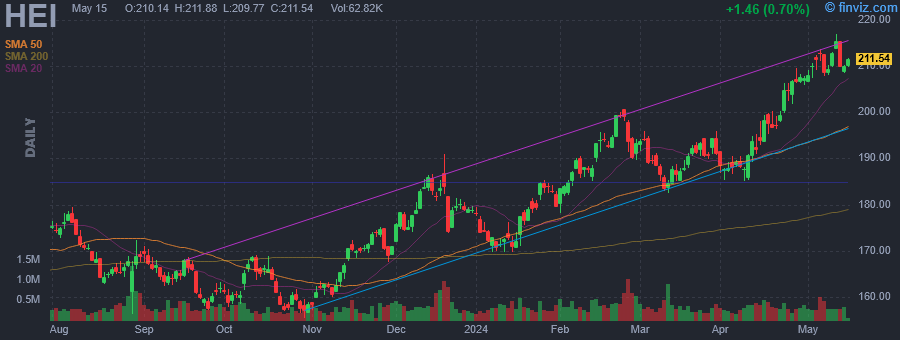 |
| Market Cap | 28.62B | EPS (ttm) | 3.05 |
| P/E | 67.72 | EPS this Y | 20.89% |
| Forward P/E | 48.85 | EPS next Y | 20.35% |
| PEG | 4.00 | EPS past 5Y | 8.91% |
| P/S | 8.82 | EPS next 5Y | 16.95% |
| P/B | 8.76 | EPS Q/Q | 22.14% |
| Dividend | 0.12% | Sales Q/Q | 44.36% |
| Insider Own | 69.52% | Inst Own | 27.75% |
| Insider Trans | -0.03% | Inst Trans | -0.00% |
| Short Float | 3.51% | Earnings | Feb 26/b |
| Analyst Recom | 1.89 | Target Price | 214.99 |
| Avg Volume | 384.94K | 52W Range | 153.63 - 206.38 |
|
|
|
|
HEICO Corp. engages in the manufacturing of electronic equipment for the aviation, defense, space, medical, telecommunications, and electronics industries. It operates through the Flight Support Group and Electronic Technologies Group segments. The Flight Support Group segment designs, manufactures, repairs, overhauls, and distributes jet engine and aircraft component replacement parts. The Electronic Technologies Group segment focuses on designing and manufacturing electronic, data and microwave, and electro-optical products, including infrared simulation and test equipment, laser rangefinder receivers, electrical power supplies, back-up power supplies, power conversion products, underwater locator beacons, emergency locator transmission beacons, flight deck annunciators, panels and indicators, electromagnetic and radio frequency interference shielding and filters, high power capacitor charging power supplies, amplifiers, traveling wave tube amplifiers, photo detectors, amplifier modules, microwave power modules, flash lamp drivers, laser diode drivers, arc lamp power supplies, custom power supply designs, cable assemblies, high voltage power supplies, high voltage interconnection devices and wire, high voltage energy generators, high frequency power delivery systems, and memory products. The company was founded in 1957 and is headquartered in Hollywood, FL. |
| Insider Trading |
Relationship |
Date |
Transaction |
Cost |
#Shares |
Value ($) |
#Shares Total |
SEC Form 4 |
| Schwitter Frank J | Director | Mar 28 '24 | Sale | 193.70 | 400 | 77,480 | 1,255 | Apr 01 04:11 PM | | SCHRIESHEIM ALAN | Director | Mar 22 '24 | Option Exercise | 0.57 | 35,000 | 19,996 | 181,966 | Mar 25 04:29 PM | | SCHRIESHEIM ALAN | Director | Mar 22 '24 | Sale | 192.18 | 26,000 | 4,996,784 | 155,862 | Mar 25 04:29 PM | | SCHRIESHEIM ALAN | Director | Jan 04 '24 | Option Exercise | 0.57 | 44,000 | 25,137 | 147,111 | Jan 05 06:47 PM | | Schwitter Frank J | Director | Jan 02 '24 | Sale | 178.06 | 550 | 97,930 | 1,655 | Jan 04 02:09 PM |
|
|
| |
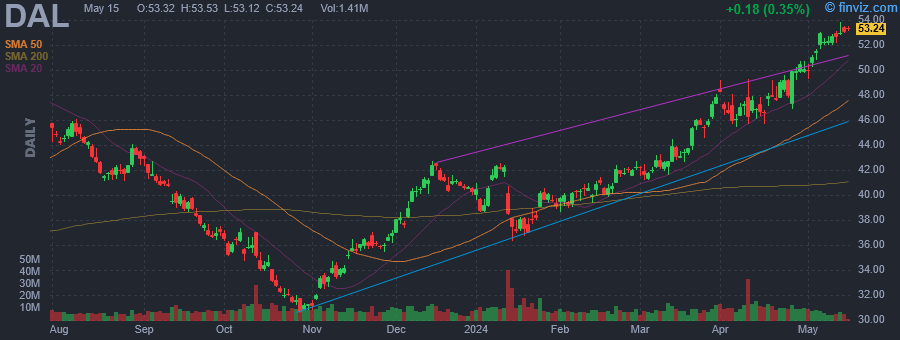 |
| Market Cap | 32.19B | EPS (ttm) | 7.79 |
| P/E | 6.41 | EPS this Y | 5.15% |
| Forward P/E | 6.58 | EPS next Y | 15.28% |
| PEG | 0.66 | EPS past 5Y | 4.80% |
| P/S | 0.55 | EPS next 5Y | 9.63% |
| P/B | 2.89 | EPS Q/Q | 110.10% |
| Dividend | 0.75% | Sales Q/Q | 7.75% |
| Insider Own | 0.41% | Inst Own | 69.58% |
| Insider Trans | -7.44% | Inst Trans | -1.80% |
| Short Float | 2.94% | Earnings | Apr 10/b |
| Analyst Recom | 1.32 | Target Price | 58.62 |
| Avg Volume | 9.89M | 52W Range | 30.60 - 49.81 |
|
|
|
|
Delta Air Lines, Inc. engages in the provision of scheduled air transportation for passengers and cargo. It operates through the Airline and Refinery segments. The Airline segment provides scheduled air transportation for passengers and cargo. The Refinery segment provides jet fuel to the airline segment. The company was founded by Collett Everman Woolman in 1928 and is headquartered in Atlanta, GA. |
| Insider Trading |
Relationship |
Date |
Transaction |
Cost |
#Shares |
Value ($) |
#Shares Total |
SEC Form 4 |
| Sear Steven M | EVP - Global Sales | Apr 24 '24 | Sale | 47.90 | 15,806 | 757,028 | 88,738 | Apr 25 04:30 PM | | BELLEMARE ALAIN | EVP & Pres. - International | Apr 23 '24 | Sale | 48.86 | 24,073 | 1,176,183 | 141,451 | Apr 24 04:30 PM | | HAUENSTEIN GLEN W | President | Apr 22 '24 | Sale | 49.05 | 100,000 | 4,904,600 | 217,584 | Apr 23 04:30 PM | | Smith Joanne D | EVP & Chief People Officer | Feb 27 '24 | Sale | 42.02 | 4,876 | 204,904 | 117,267 | Feb 29 04:01 PM | | Carroll William C | SVP, Fin & Controller | Feb 06 '24 | Sale | 40.15 | 6,192 | 248,609 | 9,806 | Feb 07 04:30 PM |
|
|
|
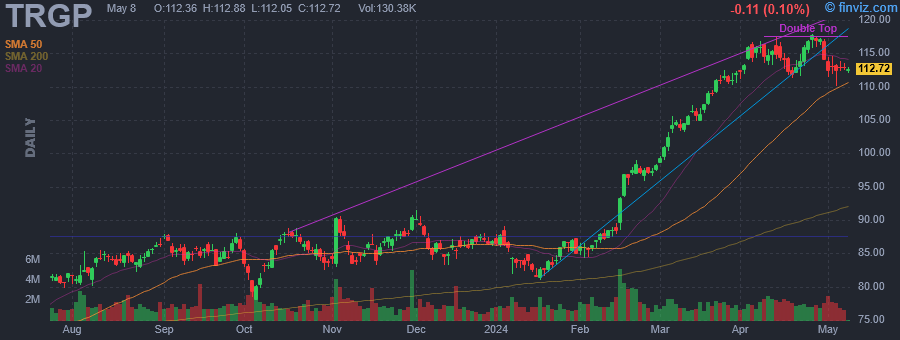 |
| Market Cap | 26.19B | EPS (ttm) | 3.68 |
| P/E | 31.99 | EPS this Y | 48.73% |
| Forward P/E | 17.21 | EPS next Y | 24.42% |
| PEG | 0.70 | EPS past 5Y | - |
| P/S | 1.68 | EPS next 5Y | 45.70% |
| P/B | 9.56 | EPS Q/Q | -11.30% |
| Dividend | 2.55% | Sales Q/Q | 10.76% |
| Insider Own | 1.99% | Inst Own | 93.16% |
| Insider Trans | -3.69% | Inst Trans | 1.41% |
| Short Float | 1.83% | Earnings | May 02/b |
| Analyst Recom | 1.26 | Target Price | 121.76 |
| Avg Volume | 1.80M | 52W Range | 67.36 - 117.61 |
|
|
|
|
Targa Resources Corp. provides midstream natural gas and natural gas liquids services. It also provides gathering, storing, and terminaling crude oil, and storing, terminaling, and selling refined petroleum products. It operates through the Gathering and Processing and Logistics and Transportation segments. The Gathering and Processing segment includes assets used in the gathering of natural gas produced from oil and gas wells and processing this raw natural gas into merchantable natural gas by extracting NGLs and removing impurities, and assets used for crude oil gathering and terminaling. The Logistics and Transportation segment focuses on the activities necessary to convert mixed NGLs into NGL products and provides certain value-added services such as the storing, fractionating, terminaling, transporting and marketing of NGLs and NGL products, including services to LPG exporters, and the storing and terminaling of refined petroleum products and crude oil and certain natural gas supply and marketing activities in support of its other businesses. The company was founded in October 2005 and is headquartered in Houston, TX. |
| Insider Trading |
Relationship |
Date |
Transaction |
Cost |
#Shares |
Value ($) |
#Shares Total |
SEC Form 4 |
| Boushka Julie H. | Senior VP and CAO | Mar 05 '24 | Sale | 100.96 | 10,000 | 1,009,600 | 59,919 | Mar 06 04:30 PM | | Pryor D. Scott | See Remarks | Feb 26 '24 | Sale | 97.00 | 10,000 | 970,007 | 156,098 | Feb 28 04:51 PM | | Muraro Robert | Chief Commercial Officer | Feb 23 '24 | Sale | 97.31 | 10,000 | 973,080 | 219,451 | Feb 26 04:30 PM | | Cooksen Lindsey | Director | Feb 23 '24 | Sale | 97.36 | 1,000 | 97,360 | 11,226 | Feb 26 05:42 PM | | Perkins Joe Bob | Director | Feb 22 '24 | Sale | 97.61 | 45,175 | 4,409,357 | 0 | Feb 23 04:30 PM |
|
|
| |
 |
| Market Cap | 930.23M | EPS (ttm) | -0.67 |
| P/E | - | EPS this Y | 12.63% |
| Forward P/E | - | EPS next Y | 15.90% |
| PEG | - | EPS past 5Y | - |
| P/S | 240.99 | EPS next 5Y | - |
| P/B | 11.67 | EPS Q/Q | -27.32% |
| Dividend | - | Sales Q/Q | 50.06% |
| Insider Own | 74.86% | Inst Own | 20.22% |
| Insider Trans | 0.81% | Inst Trans | -8.48% |
| Short Float | 36.61% | Earnings | May 08/a |
| Analyst Recom | 1.67 | Target Price | 12.00 |
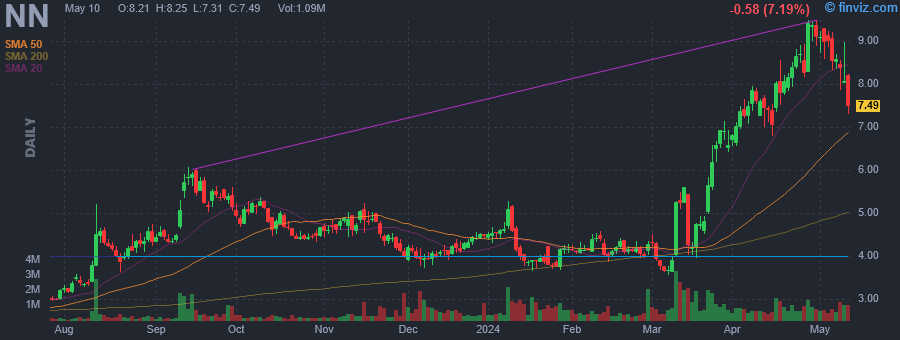
| Avg Volume | 905.64K | 52W Range | 1.92 - 8.91 |
|
|
|
Apr-24-24 04:05PM
|
NextNav Announces Date for First Quarter 2024 Earnings Call
(GlobeNewswire) |
|
Apr-16-24 09:00AM
|
NextNav Lays Out New Vision for Complement and Backup to GPS with Additional Spectrum for Broadband Services
(GlobeNewswire) +13.68% |
|
Apr-12-24 09:40AM
|
NextNav Inc. Announces 2024 Annual Meeting of Stockholders
(GlobeNewswire) |
|
Mar-21-24 01:49PM
|
Hedge Fund and Insider Trading News: David Einhorn, Sanjay Shah, Three Arrows Capital, Nextnav Inc (NN), Jabil Inc (JBL), and More
(Insider Monkey) +17.43% |
|
Mar-13-24 05:31PM
|
NextNav Inc (NN) Reports Mixed Financial Results Amid Strategic Spectrum Expansion
(GuruFocus.com) +6.97% |
|
04:05PM
|
NextNav Inc. Reports Fourth Quarter and Full Year 2023 Results
(GlobeNewswire) |
|
Mar-11-24 08:30AM
|
NextNav To Acquire Additional Lower 900 MHz Band Spectrum Licenses
(GlobeNewswire) +35.22% |
|
Mar-06-24 05:45PM
|
NextNav Announces Date for Fourth Quarter and Full Year 2023 Earnings Call
(GlobeNewswire) |
|
Jan-30-24 12:09AM
|
What Makes Nextnav (NN) a Prospective Investment?
(Insider Monkey) |
|
Jan-29-24 10:27AM
|
Hedge Fund and Insider Trading News: Anthony Scaramucci, David Tepper, Michael Burry, Bluebell Capital Partners, Millennium Management, Odey Asset Management, NextNav Inc. (NN), and More
(Insider Monkey) +10.67% |
|
NextNav, Inc. develops next-generation positioning, navigation, and timing solutions. Through its Pinnacle system, it provides floor-level altitude service to devices with a barometric pressure sensor. The company was founded by Ganesh Pattabiraman and Arun Raghupathy in May 2021 and is headquartered in McLean, VA. |
| Insider Trading |
Relationship |
Date |
Transaction |
Cost |
#Shares |
Value ($) |
#Shares Total |
SEC Form 4 |
| SUBIN NEIL S | Director | Mar 20 '24 | Buy | 4.72 | 50,000 | 236,000 | 2,115,213 | Mar 20 05:29 PM | | SUBIN NEIL S | Director | Mar 19 '24 | Buy | 4.76 | 50,000 | 238,000 | 2,065,213 | Mar 20 05:29 PM | | Lantz Robert | General Counsel | Mar 19 '24 | Sale | 4.75 | 2,032 | 9,652 | 88,401 | Mar 19 05:37 PM | | Shams Sammaad | Chief Accounting Officer | Mar 19 '24 | Sale | 4.69 | 116 | 544 | 74,006 | Mar 19 05:38 PM | | SAMBERG JOSEPH D | 10% Owner | Mar 18 '24 | Buy | 4.52 | 483,000 | 2,181,663 | 9,800,000 | Mar 20 06:10 PM |
|
|
|
 |
| Market Cap | 907.58M | EPS (ttm) | -0.30 |
| P/E | - | EPS this Y | 225.43% |
| Forward P/E | 9.45 | EPS next Y | 3.00% |
| PEG | - | EPS past 5Y | 18.91% |
| P/S | 2.36 | EPS next 5Y | - |
| P/B | 0.99 | EPS Q/Q | -82.94% |
| Dividend | 6.66% | Sales Q/Q | -9.02% |
| Insider Own | 11.83% | Inst Own | 55.12% |
| Insider Trans | -1.22% | Inst Trans | -12.72% |
| Short Float | 3.22% | Earnings | May 08/a |
| Analyst Recom | 1.44 | Target Price | 24.07 |
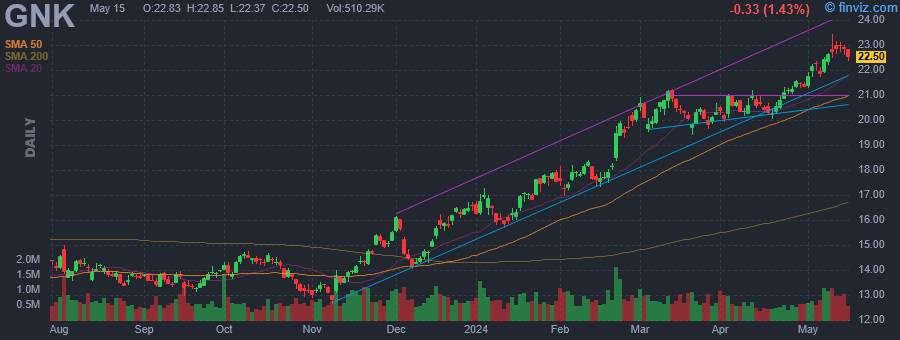
| Avg Volume | 704.06K | 52W Range | 12.39 - 21.31 |
|
|
|
|
Genco Shipping & Trading Ltd. is an international ship owning company, which engages in the transportation of iron ore, coal, grain, steel products, and other drybulk cargoes. The company was founded on September 27, 2004 and is headquartered in New York, NY. |
| Insider Trading |
Relationship |
Date |
Transaction |
Cost |
#Shares |
Value ($) |
#Shares Total |
SEC Form 4 |
| Adamo Joseph | Chief Accounting Officer | Feb 29 '24 | Option Exercise | 8.35 | 3,413 | 28,485 | 19,867 | Mar 01 07:00 PM | | Adamo Joseph | Chief Accounting Officer | Feb 29 '24 | Sale | 20.40 | 1,396 | 28,478 | 17,994 | Mar 01 07:00 PM | | WOBENSMITH JOHN C | CEO, President, and Secretary | Feb 23 '24 | Sale | 19.80 | 35,660 | 706,015 | 466,684 | Feb 23 09:17 PM | | Christensen Jesper | Chief Commercial Officer | Feb 23 '24 | Sale | 19.80 | 12,404 | 245,636 | 42,587 | Feb 23 09:18 PM | | Allen Peter George | Chief Financial Officer | Feb 23 '24 | Sale | 19.80 | 7,036 | 139,283 | 35,518 | Feb 23 09:18 PM |
|
|
| |
 |
| Market Cap | 680.70M | EPS (ttm) | 0.96 |
| P/E | 9.14 | EPS this Y | 119.56% |
| Forward P/E | 3.36 | EPS next Y | 25.57% |
| PEG | 0.98 | EPS past 5Y | - |
| P/S | 1.41 | EPS next 5Y | 9.30% |
| P/B | 0.55 | EPS Q/Q | -94.54% |
| Dividend | - | Sales Q/Q | -13.36% |
| Insider Own | 2.81% | Inst Own | 18.91% |
| Insider Trans | 0.00% | Inst Trans | 51.38% |
| Short Float | 4.78% | Earnings | Feb 22/b |
| Analyst Recom | 1.50 | Target Price | 10.44 |
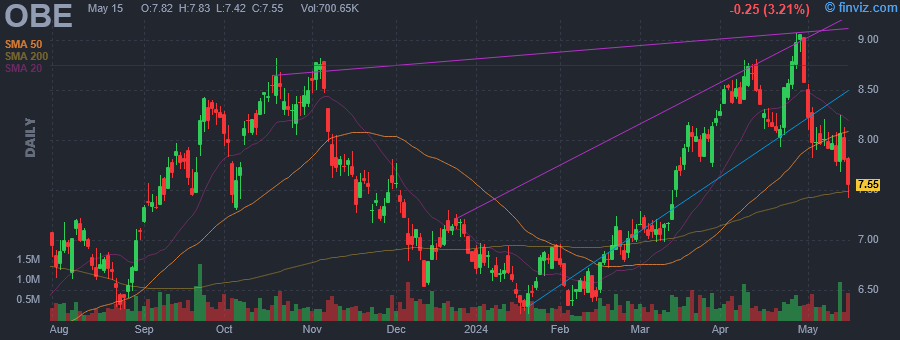
| Avg Volume | 376.84K | 52W Range | 5.33 - 8.82 |
|
|
|
|
Obsidian Energy Ltd. is an exploration and production company. The firm engages in exploring, developing, and holds interests in oil and natural gas properties and related production infrastructure in the Western Canada Sedimentary Basin directly and through investments in securities of subsidiaries holding such interests. Its property portfolio includes Cardium, Viking, and Peace River. The company was founded on December 27, 1979 and is headquartered in Calgary, Canada. |
|
|
 |
| Market Cap | 5.19B | EPS (ttm) | 0.62 |
| P/E | 9.58 | EPS this Y | 142.86% |
| Forward P/E | 4.44 | EPS next Y | 48.79% |
| PEG | 0.31 | EPS past 5Y | 4.84% |
| P/S | 1.18 | EPS next 5Y | 31.00% |
| P/B | 1.25 | EPS Q/Q | -88.05% |
| Dividend | 5.78% | Sales Q/Q | 71.62% |
| Insider Own | 0.00% | Inst Own | 3.71% |
| Insider Trans | - | Inst Trans | 8.09% |
| Short Float | 0.03% | Earnings | Mar 20/b |
| Analyst Recom | 1.11 | Target Price | 7.69 |
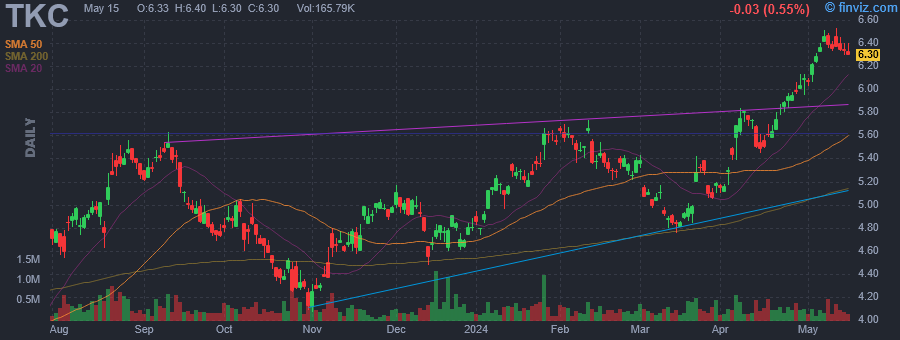
| Avg Volume | 308.95K | 52W Range | 3.52 - 5.97 |
|
|
|
|
TURKCELL Iletisim Hizmetleri AS engages in the provision of communication and technology services. It operates through the following segments: Turkcell Turkey, Turkcell International, Techfin and All Other. The Turkcell Turkey segment includes the operations of information and entertainment services in Turkey and Azerbaijan, and of non-group call center. The Turkcell International segment includes telecommunications operations in several emerging market geographies. The Techfin segment includes the operations of Turkcell Finansman, Turkcell Odeme, Paycell and Turkcell Sigorta. The All Other segment mainly comprises the information and entertainment services in Turkey, non-group call center operations of Turkcell Global Bilgi, Turkcell Enerji, Boyut Enerji and Turkcell Satis's other operations. The company was founded by Mehmet Ermin Karamehmet and Huseyin Murat Vargi on October 5, 1993, and is headquartered in Maltepe, Turkey. |
|
|
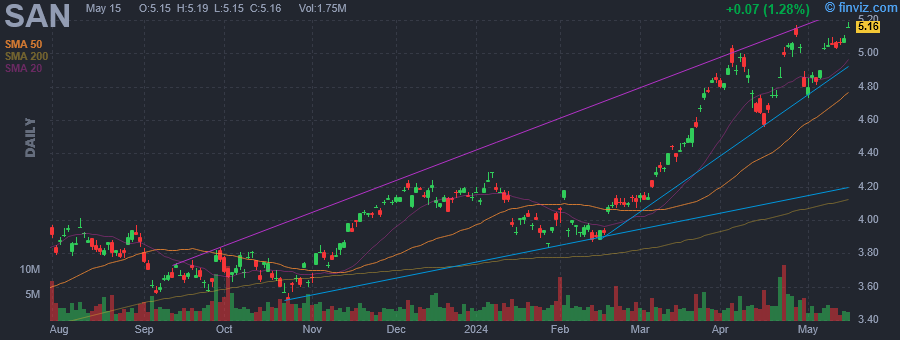 |
| Market Cap | 78.57B | EPS (ttm) | 0.72 |
| P/E | 7.07 | EPS this Y | 7.22% |
| Forward P/E | 6.30 | EPS next Y | 6.09% |
| PEG | 0.42 | EPS past 5Y | 6.87% |
| P/S | 0.57 | EPS next 5Y | 16.97% |
| P/B | 0.77 | EPS Q/Q | 90.62% |
| Dividend | 4.49% | Sales Q/Q | 27.26% |
| Insider Own | 0.00% | Inst Own | 2.51% |
| Insider Trans | - | Inst Trans | -4.85% |
| Short Float | 0.04% | Earnings | Feb 02/b |
| Analyst Recom | 1.88 | Target Price | 5.57 |
| Avg Volume | 3.30M | 52W Range | 3.20 - 5.06 |
|
|
|
|
Banco Santander SA is a banking services company, which engages in the provision of banking services to individuals, companies, and institutions. It operates through the following segments: Europe, North America, South America, and Digital Consumer Bank. The Europe segment comprises business activities carried out in the region. The North America segment includes business activities in Mexico and the United States. The South America segment involves financial activities of the Group through its banks and subsidiary banks in the region. The Digital Consumer Bank segment includes Santander Consumer Finance, which incorporates the entire consumer finance business in Europe, Openbank, and ODS. The company was founded on March 21, 1857 and is headquartered in Madrid, Spain. |
|
|
