 |
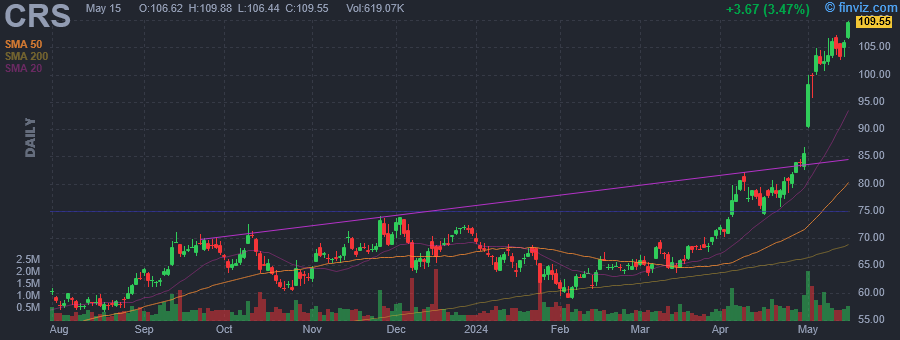
| Market Cap | 4.15B | EPS (ttm) | 2.88 |
| P/E | 29.19 | EPS this Y | 244.52% |
| Forward P/E | 17.55 | EPS next Y | 21.83% |
| PEG | 1.28 | EPS past 5Y | -21.93% |
| P/S | 1.52 | EPS next 5Y | 22.87% |
| P/B | 2.82 | EPS Q/Q | 581.61% |
| Dividend | 0.95% | Sales Q/Q | 7.79% |
| Insider Own | 3.03% | Inst Own | 92.37% |
| Insider Trans | -0.25% | Inst Trans | -3.42% |
| Short Float | 3.02% | Earnings | May 01/b |
| Analyst Recom | 1.40 | Target Price | 91.00 |
| Avg Volume | 485.22K | 52W Range | 44.40 - 82.16 |
|
|
|
|
Carpenter Technology Corp. engages in the manufacturing, fabrication, and distribution of specialty metals. It operates through the Specialty Alloys Operations and Performance Engineered Products segments. The Specialty Alloys Operations segment is composed of its major premium alloy and stainless-steel manufacturing operations. The Performance Engineered Products segment includes the Dynamet titanium, Carpenter Additive, and the Latrobe and Mexico distribution businesses. The company was founded by James Carpenter in 1889 and is headquartered in Philadelphia, PA. |
| Insider Trading |
Relationship |
Date |
Transaction |
Cost |
#Shares |
Value ($) |
#Shares Total |
SEC Form 4 |
| MCLANE CHARLES DOUGLAS JR | Director | Nov 07 '23 | Sale | 66.42 | 3,791 | 251,798 | 6,459 | Nov 08 04:48 PM | | MCLANE CHARLES DOUGLAS JR | Director | Nov 06 '23 | Option Exercise | 23.44 | 15,734 | 368,798 | 15,734 | Nov 08 04:48 PM | | WARD JR STEPHEN M | Director | Oct 15 '23 | Option Exercise | 59.32 | 1,227 | 72,786 | 22,755 | Oct 17 04:12 PM | | INGLIS I MARTIN | Director | Oct 15 '23 | Option Exercise | 59.32 | 1,227 | 72,786 | 4,827 | Oct 17 04:09 PM | | KAROL STEVEN E | Director | Sep 20 '23 | Option Exercise | 59.32 | 1,227 | 72,786 | 181,227 | Sep 21 04:45 PM |
|
|
 |
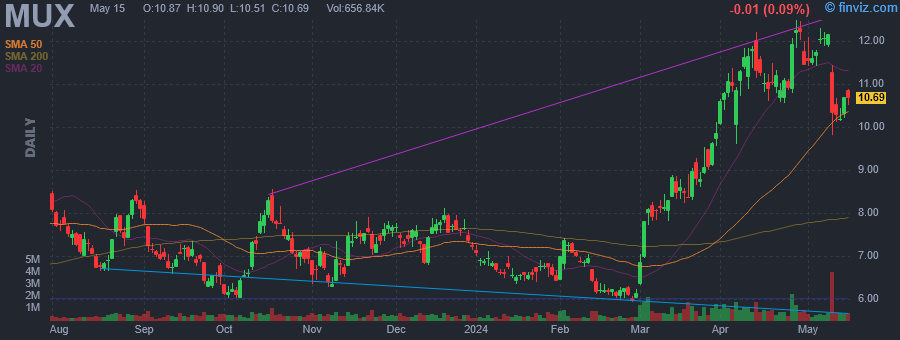 |
| Market Cap | 606.13M | EPS (ttm) | 1.05 |
| P/E | 11.70 | EPS this Y | -126.26% |
| Forward P/E | - | EPS next Y | 0.66% |
| PEG | - | EPS past 5Y | - |
| P/S | 3.65 | EPS next 5Y | - |
| P/B | 1.21 | EPS Q/Q | 455.47% |
| Dividend | - | Sales Q/Q | 107.79% |
| Insider Own | 17.80% | Inst Own | 18.51% |
| Insider Trans | 0.00% | Inst Trans | -2.03% |
| Short Float | 5.05% | Earnings | Mar 01/b |
| Analyst Recom | 1.00 | Target Price | 11.75 |
| Avg Volume | 799.17K | 52W Range | 5.92 - 12.23 |
|
|
|
|
McEwen Mining, Inc. engages in the the production and exploration of precious and base metals, It operates through the following geographical segments: USA, Canada, Mexico, MSC , and Los Azules. The USA segment includes the Gold Bar mine and exploration properties. The Canada segment consists of the Fox Complex, which includes the Black Fox gold mine, the Froome underground mine development and the Grey Fox and Stock advanced-stage projects, the Stock mill, and other gold exploration properties located in Timmins, Ontario, Canada. The Mexico segment comprises of El Gallo Project and the advanced-stage Fenix Project, located in Sinaloa. The MSC segment focuses in the San Jose mine, located in Argentina. The Los Azules segment operates copper exploration project located in San Juan, Argentina. The company was founded on July 24, 1979 and is headquartered in Toronto, Canada. |
| Insider Trading |
Relationship |
Date |
Transaction |
Cost |
#Shares |
Value ($) |
#Shares Total |
SEC Form 4 |
| Ball Ian J | Director | Jun 23 '23 | Buy | 7.16 | 2,656 | 19,012 | 2,656 | Jun 26 04:35 PM |
|
|
|
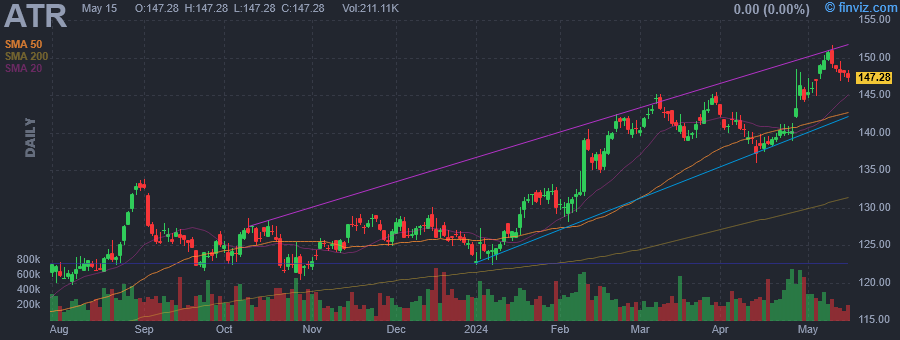 |
| Market Cap | 9.48B | EPS (ttm) | 4.66 |
| P/E | 30.76 | EPS this Y | 9.67% |
| Forward P/E | 24.69 | EPS next Y | 10.76% |
| PEG | 4.39 | EPS past 5Y | 7.22% |
| P/S | 2.68 | EPS next 5Y | 7.00% |
| P/B | 4.09 | EPS Q/Q | 49.89% |
| Dividend | 1.26% | Sales Q/Q | 6.44% |
| Insider Own | 0.70% | Inst Own | 91.66% |
| Insider Trans | -8.51% | Inst Trans | 0.89% |
| Short Float | 0.50% | Earnings | Apr 25/a |
| Analyst Recom | 2.38 | Target Price | 154.40 |
| Avg Volume | 314.57K | 52W Range | 111.62 - 145.35 |
|
|
|
|
AptarGroup, Inc. engages in the design, manufacture, drug delivery, consumer product dispensing, sealing and active packaging solutions, and services for the prescription drug, consumer health care, injectable, active packaging, beauty, personal care, home care, and food and beverages industries. It operates through the following segments: Pharma, Beauty and Home, and Food and Beverage. The company was founded in 1940 and is headquartered in Crystal Lake, IL. |
| Insider Trading |
Relationship |
Date |
Transaction |
Cost |
#Shares |
Value ($) |
#Shares Total |
SEC Form 4 |
| Kampouri Monnas Giovanna | Director | Mar 12 '24 | Sale | 142.45 | 2,000 | 284,906 | 9,648 | Mar 12 02:05 PM | | Touya Gael | Segment President | Mar 11 '24 | Sale | 142.84 | 3,500 | 499,932 | 33,426 | Mar 12 01:55 PM | | Tanda Stephan B. | President and CEO | Mar 04 '24 | Option Exercise | 74.79 | 32,000 | 2,393,280 | 191,024 | Mar 05 02:39 PM | | Tanda Stephan B. | President and CEO | Mar 04 '24 | Sale | 141.67 | 32,000 | 4,533,394 | 159,024 | Mar 05 02:39 PM | | Prieur Marc | Segment President | Dec 07 '23 | Sale | 126.24 | 3,200 | 403,968 | 13,828 | Dec 07 04:19 PM |
|
|
| |
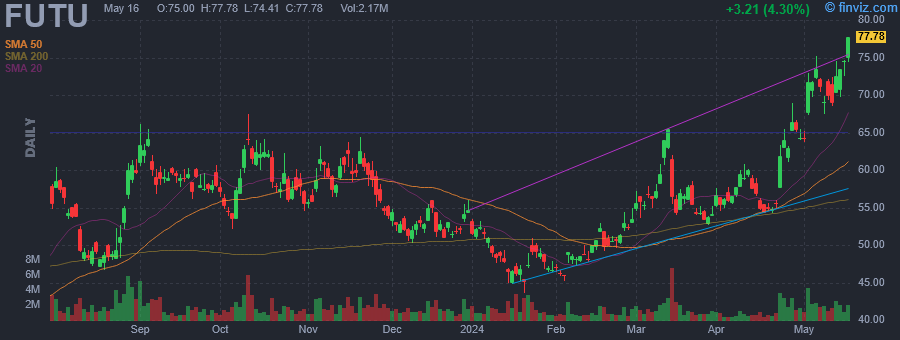 |
| Market Cap | 6.20B | EPS (ttm) | 3.91 |
| P/E | 16.98 | EPS this Y | 11.09% |
| Forward P/E | 13.42 | EPS next Y | 13.73% |
| PEG | 1.22 | EPS past 5Y | 157.52% |
| P/S | 4.85 | EPS next 5Y | 13.91% |
| P/B | 1.97 | EPS Q/Q | -7.09% |
| Dividend | - | Sales Q/Q | 4.16% |
| Insider Own | 3.08% | Inst Own | 26.02% |
| Insider Trans | 0.00% | Inst Trans | 0.37% |
| Short Float | 3.68% | Earnings | Mar 14/b |
| Analyst Recom | 1.42 | Target Price | 69.95 |
| Avg Volume | 1.34M | 52W Range | 35.91 - 67.49 |
|
|
|
|
Futu Holdings Ltd. engages in the provision of digitalized financial services. It offers securities brokerage and wealth management products. The company was founded by Leaf Hua Li in December 2007 and is headquartered in Hong Kong. |
|
|
 |
| Market Cap | 74.91B | EPS (ttm) | 2.78 |
| P/E | 32.78 | EPS this Y | 8.34% |
| Forward P/E | 23.87 | EPS next Y | 8.96% |
| PEG | 3.87 | EPS past 5Y | 0.18% |
| P/S | 3.85 | EPS next 5Y | 8.47% |
| P/B | 122.75 | EPS Q/Q | 14403.33% |
| Dividend | 2.22% | Sales Q/Q | 6.93% |
| Insider Own | 0.12% | Inst Own | 85.07% |
| Insider Trans | -27.52% | Inst Trans | -0.61% |
| Short Float | 1.15% | Earnings | Apr 26/b |
| Analyst Recom | 1.83 | Target Price | 92.66 |
| Avg Volume | 4.43M | 52W Range | 67.62 - 90.37 |
|
|
|
|
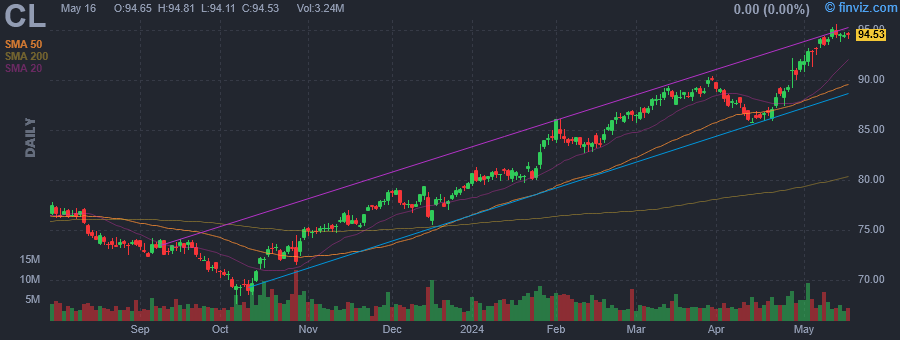
Colgate-Palmolive Co. engages in the manufacturing and distribution of consumer products. It operates through the Oral, Personal, and Home Care and Pet Nutrition segments. The Oral, Personal, and Home Care segment includes toothpaste, toothbrushes, mouthwash, bar and liquid hand soaps, shower gels, shampoos, conditioners, deodorants and antiperspirants, skin health products, dishwashing detergents, fabric conditioners, household cleaners, and other similar items. The Pet Nutrition segment offers specialty pet nutrition products manufactured and marketed by Hill's Pet Nutrition. The company was founded by William Colgate in 1806 and is headquartered in New York, NY. |
| Insider Trading |
Relationship |
Date |
Transaction |
Cost |
#Shares |
Value ($) |
#Shares Total |
SEC Form 4 |
| Wallace Noel R. | Chairman, President & CEO | Feb 20 '24 | Option Exercise | 68.16 | 55,486 | 3,781,926 | 356,829 | Feb 20 05:05 PM | | Wallace Noel R. | Chairman, President & CEO | Feb 20 '24 | Sale | 84.22 | 69,948 | 5,890,887 | 286,881 | Feb 20 05:05 PM | | Daniels Jennifer | CLO and Secretary | Feb 20 '24 | Sale | 84.67 | 3,538 | 299,578 | 59,698 | Feb 20 05:05 PM | | Parameswaran Prabha | Grp Pres, Growth & Strategy | Feb 16 '24 | Option Exercise | 68.16 | 56,836 | 3,873,942 | 75,517 | Feb 20 04:22 PM | | Parameswaran Prabha | Grp Pres, Growth & Strategy | Feb 16 '24 | Sale | 84.02 | 56,836 | 4,775,378 | 18,681 | Feb 20 04:22 PM |
|
|
| |
 |
| Market Cap | 79.35B | EPS (ttm) | 0.72 |
| P/E | 7.14 | EPS this Y | 7.19% |
| Forward P/E | 6.37 | EPS next Y | 6.04% |
| PEG | 0.42 | EPS past 5Y | 6.87% |
| P/S | 0.58 | EPS next 5Y | 16.97% |
| P/B | 0.78 | EPS Q/Q | 90.62% |
| Dividend | 4.45% | Sales Q/Q | 27.26% |
| Insider Own | 0.00% | Inst Own | 2.51% |
| Insider Trans | - | Inst Trans | -4.85% |
| Short Float | 0.04% | Earnings | Feb 02/b |
| Analyst Recom | 1.88 | Target Price | 5.57 |
| Avg Volume | 3.33M | 52W Range | 3.20 - 5.07 |
|
|
|
|
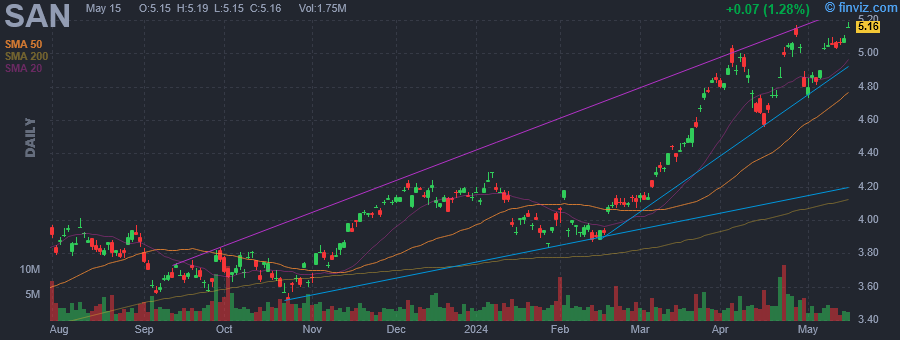
Banco Santander SA is a banking services company, which engages in the provision of banking services to individuals, companies, and institutions. It operates through the following segments: Europe, North America, South America, and Digital Consumer Bank. The Europe segment comprises business activities carried out in the region. The North America segment includes business activities in Mexico and the United States. The South America segment involves financial activities of the Group through its banks and subsidiary banks in the region. The Digital Consumer Bank segment includes Santander Consumer Finance, which incorporates the entire consumer finance business in Europe, Openbank, and ODS. The company was founded on March 21, 1857 and is headquartered in Madrid, Spain. |
|
|
 |
| Market Cap | 2.98B | EPS (ttm) | 4.23 |
| P/E | 28.59 | EPS this Y | 30.38% |
| Forward P/E | 20.94 | EPS next Y | 19.23% |
| PEG | 1.57 | EPS past 5Y | - |
| P/S | 2.55 | EPS next 5Y | 18.20% |
| P/B | 1.81 | EPS Q/Q | 1525.52% |
| Dividend | 1.98% | Sales Q/Q | 13.11% |
| Insider Own | 3.25% | Inst Own | 93.03% |
| Insider Trans | -2.03% | Inst Trans | -6.12% |
| Short Float | 1.68% | Earnings | Apr 25/b |
| Analyst Recom | 1.00 | Target Price | 133.50 |
| Avg Volume | 99.74K | 52W Range | 64.53 - 118.85 |
|
|
|
|
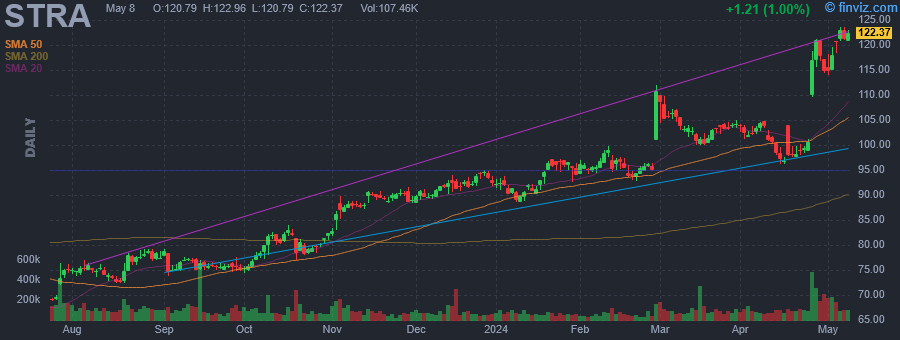
Strategic Education, Inc. engages in the provision of educational services. It provides access to education through campus-based and online post-secondary education offerings, as well as through programs to develop job-ready skills. The firm operates through three segments: U.S. Higher Education, Education Technology Services and Australia/New Zealand. The U.S. Higher Education segment primarily consists of Strayer University and Capella University and focuses on providing flexible and affordable certificate and degree programs to working adults. The Education Technology Services segment focuses on developing and maintaining relationships with employers to build employee education benefits programs. The Australia/New Zealand segment through Torrens University and associated assets, provides certificate and degree programs in Australia and New Zealand. The company was founded in 1892 and is headquartered in Herndon, VA. |
| Insider Trading |
Relationship |
Date |
Transaction |
Cost |
#Shares |
Value ($) |
#Shares Total |
SEC Form 4 |
| GILLIGAN J KEVIN | Vice Chairman | May 04 '29 | Sale | 148.88 | 739 | 110,022 | 6,293 | May 05 04:36 PM | | MCDONNELL RAYMOND KARL | CHIEF EXECUTIVE OFFICER | Feb 27 '24 | Sale | 95.99 | 12,820 | 1,230,592 | 161,359 | Feb 29 04:46 PM | | JACKSON DANIEL WAYNE | CHIEF FINANCIAL OFFICER | Feb 27 '24 | Sale | 95.95 | 3,713 | 356,262 | 71,770 | Feb 29 04:48 PM | | GRUSKY ROBERT R | Director | May 03 '23 | Sale | 83.05 | 175 | 14,534 | 11,214 | May 05 04:35 PM |
|
|
| |
 |
| Market Cap | 10.51B | EPS (ttm) | 0.20 |
| P/E | 167.16 | EPS this Y | 1.55% |
| Forward P/E | 12.32 | EPS next Y | 402.14% |
| PEG | - | EPS past 5Y | - |
| P/S | 2.42 | EPS next 5Y | - |
| P/B | 1.49 | EPS Q/Q | -82.96% |
| Dividend | - | Sales Q/Q | -13.21% |
| Insider Own | 7.45% | Inst Own | 81.03% |
| Insider Trans | -4.36% | Inst Trans | -3.40% |
| Short Float | 4.36% | Earnings | Apr 24/a |
| Analyst Recom | 2.13 | Target Price | 33.38 |
| Avg Volume | 4.78M | 52W Range | 19.91 - 33.61 |
|
|
|
|
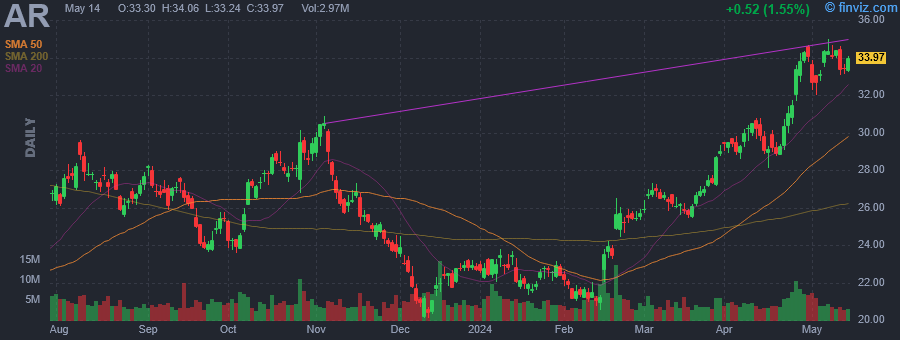
Antero Resources Corp. engages in the development, production, exploration, and acquisition of natural gas. It operates through the following segments: Exploration and Production, Marketing, and Equity Method Investment in Antero Midstream. The Exploration and Production segment deals with the development and production of natural gas, NGLs, and oil. The Marketing segment refers to marketing and utilization of excess firm transportation capacity. The Equity Method Investment in Antero Midstream segment represents midstream services. The company was founded by Paul M. Rady and Glen C. Warren, Jr. in June 2002 and is headquartered in Denver, CO. |
| Insider Trading |
Relationship |
Date |
Transaction |
Cost |
#Shares |
Value ($) |
#Shares Total |
SEC Form 4 |
| Keenan W Howard JR | Director | Mar 14 '24 | Sale | 25.85 | 232,293 | 6,004,774 | 3,000,000 | Mar 14 07:33 PM | | Keenan W Howard JR | Director | Mar 13 '24 | Sale | 26.30 | 560,729 | 14,747,173 | 3,232,293 | Mar 14 07:33 PM | | Pearce Sheri | See Remarks | Mar 13 '24 | Sale | 26.29 | 28,009 | 736,357 | 106,698 | Mar 14 05:52 PM | | Keenan W Howard JR | Director | Mar 12 '24 | Sale | 26.15 | 206,978 | 5,412,475 | 3,793,022 | Mar 14 07:33 PM | | Pearce Sheri | See Remarks | Nov 02 '23 | Sale | 29.92 | 3,460 | 103,523 | 105,596 | Nov 02 04:26 PM |
|
|
|
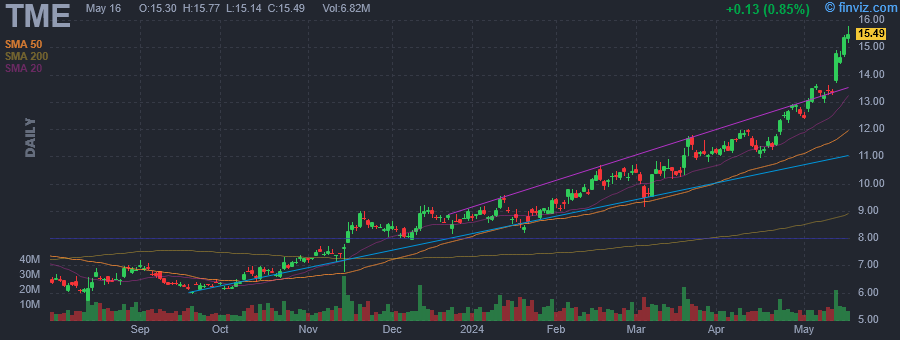 |
| Market Cap | 9.01B | EPS (ttm) | 0.44 |
| P/E | 29.13 | EPS this Y | 27.09% |
| Forward P/E | 19.86 | EPS next Y | 18.87% |
| PEG | 1.96 | EPS past 5Y | 19.83% |
| P/S | 2.30 | EPS next 5Y | 14.89% |
| P/B | 1.14 | EPS Q/Q | 16.16% |
| Dividend | - | Sales Q/Q | -8.61% |
| Insider Own | 1.02% | Inst Own | 61.54% |
| Insider Trans | 0.00% | Inst Trans | -1.64% |
| Short Float | 3.33% | Earnings | May 13/b |
| Analyst Recom | 1.41 | Target Price | 12.91 |
| Avg Volume | 8.19M | 52W Range | 5.70 - 12.70 |
|
|
|
|
Tencent Music Entertainment Group engages in the business of operating online music entertainment platforms to provide music streaming, online karaoke, and live streaming services. Its product brands include QQ Music, Kugou Music, Kuwo Music, and WeSing. The company was founded on June 6, 2012 and is headquartered in Shenzhen, China. |
|
|
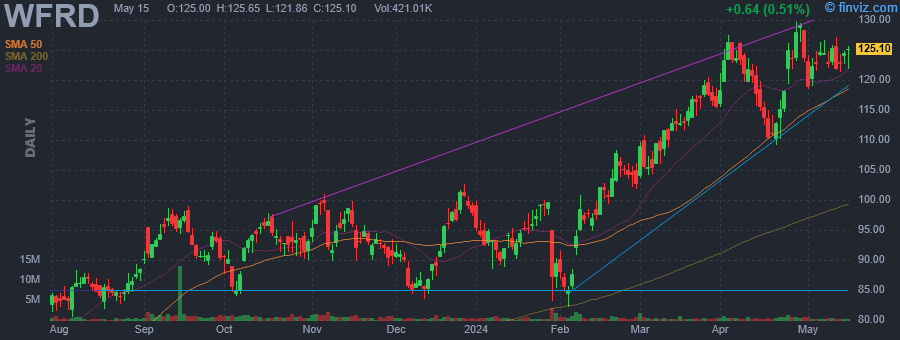 |
| Market Cap | 9.36B | EPS (ttm) | 6.18 |
| P/E | 20.72 | EPS this Y | 26.68% |
| Forward P/E | 14.81 | EPS next Y | 20.54% |
| PEG | 1.20 | EPS past 5Y | - |
| P/S | 1.76 | EPS next 5Y | 17.20% |
| P/B | 8.59 | EPS Q/Q | 54.09% |
| Dividend | - | Sales Q/Q | 14.50% |
| Insider Own | 1.96% | Inst Own | 97.05% |
| Insider Trans | -12.79% | Inst Trans | 1.72% |
| Short Float | 4.01% | Earnings | Apr 23/a |
| Analyst Recom | 1.50 | Target Price | 148.52 |
| Avg Volume | 865.22K | 52W Range | 55.81 - 127.45 |
|
|
|
|
Weatherford International plc engages in providing equipment and services to the oil and natural gas exploration and production industry. It operates through the following segments: Drilling and Evaluation (DRE), Well Construction and Completions (WCC) and Production and Intervention (PRI). The DRE segment offers managed pressure drilling, drilling services, wire line, and drilling fluids. The WCC segment includes tubular running services, cementation products, completions, liner hangers, and well services. The PRI segment covers the intervention services and drilling tools, artificial lift, production automation and software, sub-sea intervention, and pressure pumping services. The company was founded in 1941 and is headquartered in Houston, TX. |
| Insider Trading |
Relationship |
Date |
Transaction |
Cost |
#Shares |
Value ($) |
#Shares Total |
SEC Form 4 |
| SLEDGE CHARLES M | Director | Apr 25 '24 | Sale | 123.47 | 10,000 | 1,234,663 | 32,729 | Apr 26 04:34 PM | | Saligram Girish | President and CEO | Feb 21 '24 | Sale | 103.57 | 60,000 | 6,214,136 | 146,895 | Feb 23 05:05 PM | | Sandhu Depinder | EVP, Global Product Lines | Feb 15 '24 | Sale | 100.96 | 4,717 | 476,209 | 2,536 | Feb 16 04:47 PM | | Mutschler Jacqueline C | Director | Feb 15 '24 | Sale | 99.45 | 3,000 | 298,350 | 28,801 | Feb 16 04:44 PM | | Reed David John | EVP, Chief Commercial Officer | Feb 15 '24 | Sale | 97.50 | 2,700 | 263,250 | 6,805 | Feb 16 04:46 PM |
|
|
|
