|
|
|

|
|||||
|
|
|
William O’Neil, founder of Investor’s Business Daily, was a businessman, a successful growth investor, and a market educator. O’Neil is most known for his best-selling and wildly popular book “How to Make Money in Stocks.” Unlike most of Wall Street, O’Neil did not choose to rely solely on fundamental analysis or solely on technical analysis. Instead, he combined the two most popular market studies in an effort to gain any advantage possible over the market.
Though there are many golden nuggets to extract from O’Neil’s work, his “stock market paradox” quote resonates the most with me:
“The hard-to-believe, great paradox in the stock market is: What seems too high and risky to the majority usually goes higher eventually, and what seems low and cheap, usually goes lower.”
To prove the point, you don’t need to take O’Neil’s word for it. Instead, if you look at the list of stocks that doubled in 2024, you’ll notice that many of them have again doubled in 2025, including Nvidia (NVDA), Palantir (PLTR), and AppLovin (APP). Like with physics, on Wall Street, a body in motion tends to stay in motion.
A “high tight flag” pattern uses O’Neil’s paradox and the fundamental laws of supply and demand to provide a rare but powerful technical pattern. To spot the pattern, look for the following characteristics:
· The Pole: Look for the stock to double or more in eight weeks or less. A swift move in such a short period is evidence of overwhelming accumulation.
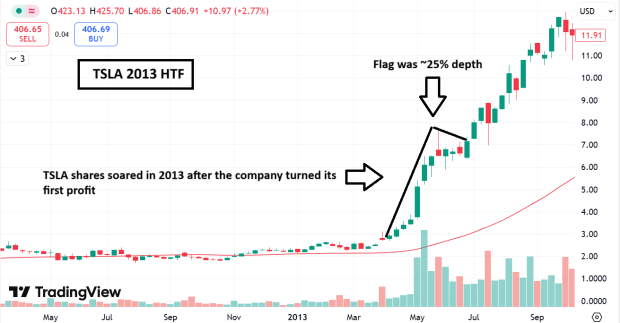
· The Flag: The pole of the HTF requires a pullback between three to five weeks that is no deeper than ~25% off the flag pole high. Ideally, trading volume subsides during this period, signaling a lack of selling pressure.
The psychology of the high-tight flag can be witnessed in both areas of the pattern, with the pole representing intense bullish demand, and the flag representing an unwillingness by sellers to part with their shares, despite substantial profits.
To avoid speculative, lower-quality stocks, the high tight flag should use fundamentals as a filter and be driven by a bullish tailwind, such as a new product, a massive earnings beat, or a contract win.
Tesla (TSLA) 2013: In 2013, Tesla built a high-tight flag pattern after the company reported its first-ever quarterly profit. From there, the stock nearly doubled, gaining ground in 11 of the next 13 weeks.
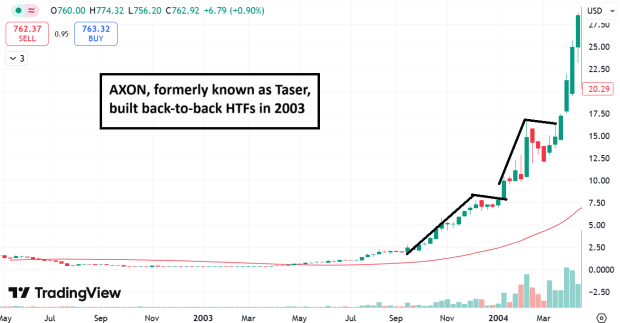
Axon (AXON) 2003: Known then as Taser, Axon Enterprises gained momentum in 2003 with several police contracts for its Taser stun gun, which allowed police to subdue targets nonlethally. In one of the more breathtaking moves on Wall Street, the stock built back-to-back high tight flags and ran from a split-adjusted $1 to $60 in under two years.
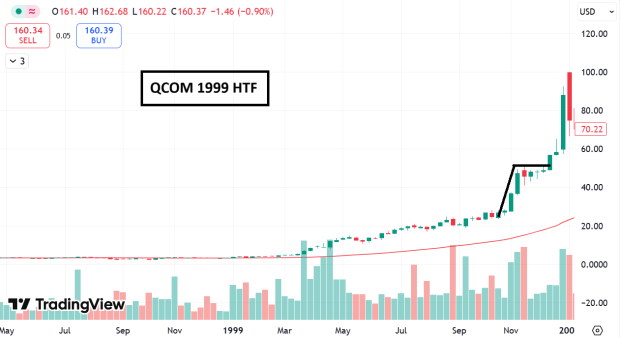
Qualcomm (QCOM) 1999: In 1999, QCOM enjoyed a plethora of fundamental catalysts, including investor belief in the company’s mobile communication technology, a lucrative IP licensing business, and a legal settlement that resolved patent disputes. QCOM built a textbook HTF, and shares would go on to double in just four weeks before topping.
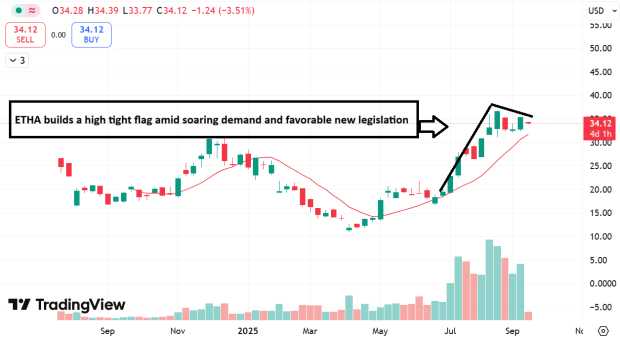
iShares Ethereum ETF (ETHA)
Stablecoins are a cryptocurrency that aims to maintain a stable value relative to a specified asset, like the US Dollar. This unique crypto genre offers benefits such as faster and lower-cost transactions, 24/7 availability, and frictionless global access. Earlier this year, Washington passed the GENIUS Act, the first regulatory framework for stablecoins. Tether operates the largest stablecoin, USDT, and Circle Group (CRCL) operates the second-largest stablecoin, USDC. Over the past month, these two stablecoin operators have minted a mind-blowing $12.75 billion in stablecoins. Though stablecoin operators are beneficiaries, Ethereum, the world’s second-largest cryptocurrency, is perhaps the largest beneficiary because these stablecoins run off Ethereum.
Ethereum ETF ETHA recently built a “flag pole” by running from $18 to $37 in eight weeks. After consolidating for four weeks, Ethereum is poised to emerge from a classic high-tight flag pattern.
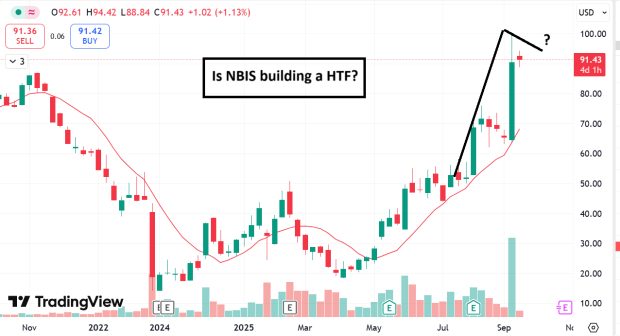
Nebius Group (NBIS)
Nebius Group is a leading AI infrastructure company that went public late last year. Recently, NBIS shares doubled after landing a massive $17 billion AI data center contract with Microsoft (MSFT). Wall Street considers the MSFT contract a significant catalyst, considering the company’s market cap was only $15 billion before the announcement.
You can read much more about NBIS in my recent commentary, “Why Nebius’s Microsoft Deal Changes Everything.”
Bottom Line
The high tight flag is one of the rarest and powerful technical chart patterns. By studying historical HTF examples, investors can catch the next life-changing price advances.
Want the latest recommendations from Zacks Investment Research? Today, you can download 7 Best Stocks for the Next 30 Days. Click to get this free report
This article originally published on Zacks Investment Research (zacks.com).
| 22 min | |
| 2 hours | |
| 2 hours | |
| 6 hours | |
| Jul-10 | |
| Jul-10 | |
| Jul-10 | |
| Jul-10 | |
| Jul-10 | |
| Jul-10 | |
| Jul-10 |
Tesla Faces Possible Robotaxi Ban In New Jersey, But It Gains Market Share In China
TSLA
Investor's Business Daily
|
| Jul-10 | |
| Jul-10 | |
| Jul-10 | |
| Jul-10 |
Join thousands of traders who make more informed decisions with our premium features. Real-time quotes, advanced visualizations, alerts, and much more.
Learn more about Finviz Elite