|
|
|

|
|||||
|
|
|
For most investors and Wall Street observers, it can be easy for the days to jumble together. Though markets constantly fluctuate, new economic data emerges, and different stocks move, it is challenging to recall most market days five years into the future. However, Tuesday, like the depths of the 2020 COVID-19 crisis or the 2008 Global Financial Crisis, will be a day that most investors remember for years to come. Yesterday, the Nasdaq Composite scored its second-largest gain in history after investors celebrated the Trump Administration’s 90-day tariff pause. Trump paused the tariffs for most countries (outside of the original 10%) to open up for negotiations.
Contrary to popular belief, the largest single-day rallies occur in bear markets like 2008. When the market gets stretched to the downside it often snaps back, and vicious short-covering rallies can occur.
One primary concern among Wall Street investors about tariffs is that they will lead to higher consumer prices. That said, Tuesday’s Consumer Price Index (CPI) helped to quell some of those inflation concerns. CPI dropped 2.4% for March, marking the first month-over-month CPI drop in five years. With inflation less of a problem, the Chicago Mercantile Exchange (CME) FedWatch Tool gives an 87.6% chance of an interest rate cut in June.
The tick indicator measures the difference between the number of up-ticking stocks and down-ticking stocks. A negative tick indicates more stocks are falling, and vice versa. On Tuesday, we saw an extreme negative tick reading of -1772, signaling a potential washout/capitulation.
Tariff uncertainty and wild market swings are leading to bearish market sentiment. The Investors Intelligence (II) survey monitors the opinions of investment newsletter editors. Tuesday, II notched its most bearish reading since December 2008.

The Volatility Index (VIX) measures investor expectations for volatility over the next 30 days. When VIX spikes, it suggests that investors are fearful and seek protection. Tuesday, the fear gauge saw its largest plunge in history. Looking at the past 18 major declines, the S&P 500 Index was higher 1-year later in 16 instances, with slightly better than normal returns. Investors can track the VIX via theiPath S&P 500 VIX ETF (VXX).

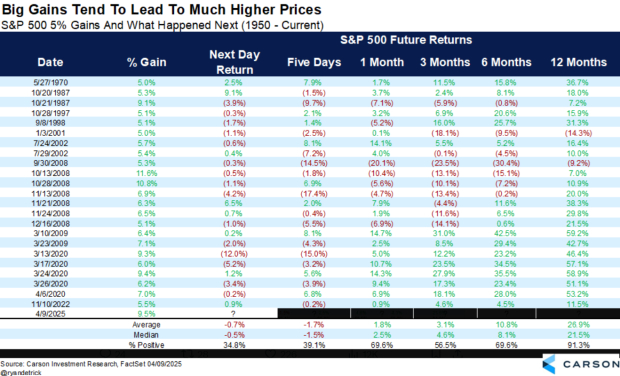
Historically, massive rallies like the one investors witnessed yesterday have led to higher prices. On average, the market is higher one year later 91.3% of the time. However, the singifcant caveat is that time frame matters. Stocks tend to fall on average five days later, and returns are historically mixed three months later.
While many beaten-down stocks like Apple (AAPL), Tesla (TSLA), and Nvidia (NVDA) registered large bounces yesterday, the immediate path ahead is murky at best. Wall Street has not witnessed the Trump Administration’s tariff policy and negotiating strategy for at least a century. Investors do not like uncertainty, and currently, there is plenty. That said, the longer-term picture is clearer. If you are actively trading the market, it’s best to do so with a smaller size, as volatility is likely to remain elevated. For long-term investors, the picture is much clearer and remains bullish (so long as the investor can withstand the short-term volatility. Either way, investors should not plunge into the market until Wall Street gets more clarity on the tariff front.
Want the latest recommendations from Zacks Investment Research? Today, you can download 7 Best Stocks for the Next 30 Days. Click to get this free report
This article originally published on Zacks Investment Research (zacks.com).
| 16 min | |
| 2 hours |
The Quarter-Trillion-Dollar Onslaught of AI Bonds Is Testing Investors' Limits
NVDA
The Wall Street Journal
|
| 6 hours | |
| 7 hours | |
| 7 hours | |
| 10 hours | |
| 11 hours | |
| 13 hours | |
| 18 hours | |
| 20 hours | |
| Jul-11 | |
| Jul-10 | |
| Jul-10 | |
| Jul-10 | |
| Jul-10 |
Join thousands of traders who make more informed decisions with our premium features. Real-time quotes, advanced visualizations, alerts, and much more.
Learn more about Finviz Elite