|
|
|

|
|||||
|
|
|
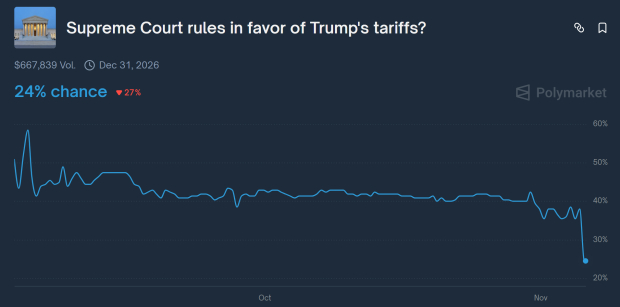
In classic form, the 2025 market is climbing the proverbial “Wall of Worry.” Currently, the US government is experiencing its longest government shutdown in history, with no end in sight. Conversely, after a nasty correction in April, stocks appear to have finally priced in President Trump’s unique and bold “Liberation Tariffs.” However, the US Supreme Court is currently hearing arguments on the Trump tariffs, and betting markets are not confident they will remain. In fact, Polymarket only expects a ¼ chance that the Supreme Court rules the tariffs legal.
Though the market has been remarkably resilient thus far in 2025, subtle, troubling cracks are beginning to emerge beneath the surface, suggesting that the market may finally be due for a substantial pullback.
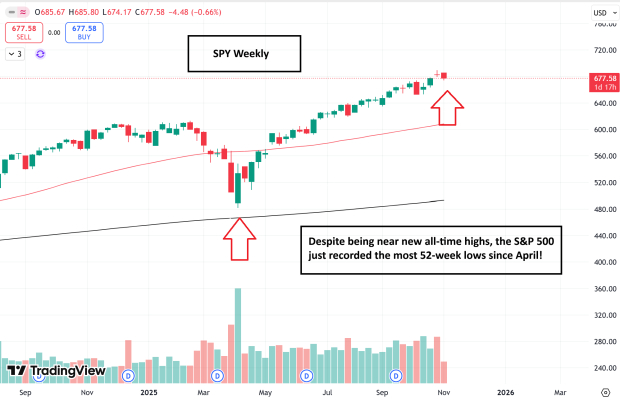
For market watchers, it should be no surprise that mega-cap “Mag 7” stocks such as Microsoft (MSFT), Nvidia (NVDA), Amazon (AMZN), Alphabet (GOOGL), and Apple (AAPL) have carried the market. After all, the AI hype has put the wind at the back of these tech juggernauts for some time. However, what’s changed in the past few days is the extreme bifurcation between these stocks and the rest. In fact, last Thursday, though the market was within shouting distance of record highs, the S&P 500 Index recorded the highest percentage of stocks at 52-week lows. The deteriorating breadth is a prime example of how the major indices can mask the action in individual stocks “beneath the surface.”
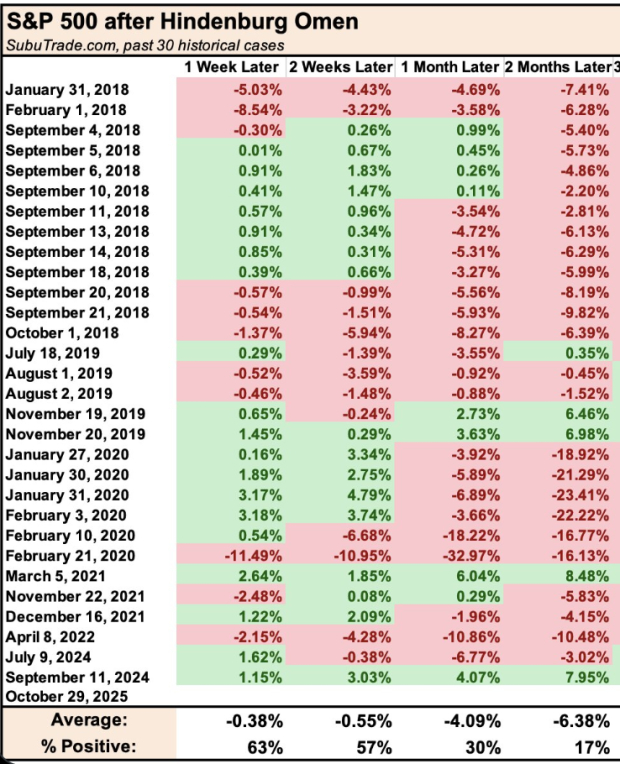
The “Hindenburg Omen” is a breadth signal used by market analysts to predict pullbacks or market crashes. Unlike traditional breadth indicators that only look for poor market participation, the Hindenburg Omen is unique in that it measures breadth abnormality- when numerous stocks are hitting both 52-week highs and 52-week lows. In other words, the Hindenburg Omen recognizes extreme market fragmentation. To trigger, the market must meet the following criteria:
1. New highs must be >2.2% and new lows must be >2.2% of the index.
2. Breadth must be negative (more stocks falling than rising).
3. The market must be in an uptrend (higher than it was 50 sessions ago)
4. New highs cannot be double the number of new lows.
Last week, the S&P 500 Index triggered a Hindenburg Omen. Though each market is unique and history doesn’t always repeat itself, market bears finally have something to get excited about. The past 30 times an S&P 500 Hindenburg Omen triggered, the market was higher two months later just 17% of the time!
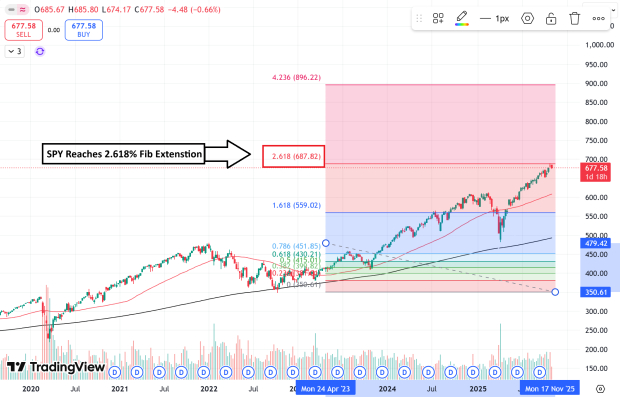
The Fibonacci Extension is an indicator market technicians use to predict where a market may pause and reverse. Based on a mathematical sequence often seen in nature and art, technical analysts utilize Fibs to see how far a market may extend, particularly from a meaningful correction. Regardless of whether the mathematical sequence itself is meaningful or if Fibs are simply a self-fulfilling prophecy, markets often respect these levels. Recently, the S&P 500 Index reached the 261.8% Fib extension from the 2022 bear market – a level where it may need to take a breather. Investors need to understand that long-term, multi-year Fib extension targets like the one the market is currently experiencing, tend to be more meaningful than short-term Fib targets.
Bottom Line
While the 2025 bull market continues to push higher, subtle cracks in market breadth are appearing beneath the surface. Namely, the “Hindenburg Omen” suggests that caution may be warranted.
Want the latest recommendations from Zacks Investment Research? Today, you can download 7 Best Stocks for the Next 30 Days. Click to get this free report
This article originally published on Zacks Investment Research (zacks.com).
| 10 min | |
| 11 min | |
| 11 min | |
| 12 min | |
| 21 min | |
| 26 min | |
| 37 min | |
| 47 min | |
| 51 min | |
| 53 min | |
| 1 hour | |
| 1 hour | |
| 1 hour | |
| 1 hour | |
| 1 hour |
Join thousands of traders who make more informed decisions with our premium features. Real-time quotes, advanced visualizations, alerts, and much more.
Learn more about Finviz Elite