 |
| Market Cap | 1.20B | EPS (ttm) | 2.24 |
| P/E | 10.04 | EPS this Y | -27.71% |
| Forward P/E | 10.92 | EPS next Y | 3.94% |
| PEG | - | EPS past 5Y | 5.31% |
| P/S | 1.93 | EPS next 5Y | - |
| P/B | 0.79 | EPS Q/Q | -29.91% |
| Dividend | 2.37% | Sales Q/Q | 4.79% |
| Insider Own | 8.83% | Inst Own | 54.49% |
| Insider Trans | -0.32% | Inst Trans | 9.24% |
| Short Float | 1.40% | Earnings | Apr 26/b |
| Analyst Recom | 2.00 | Target Price | 28.30 |
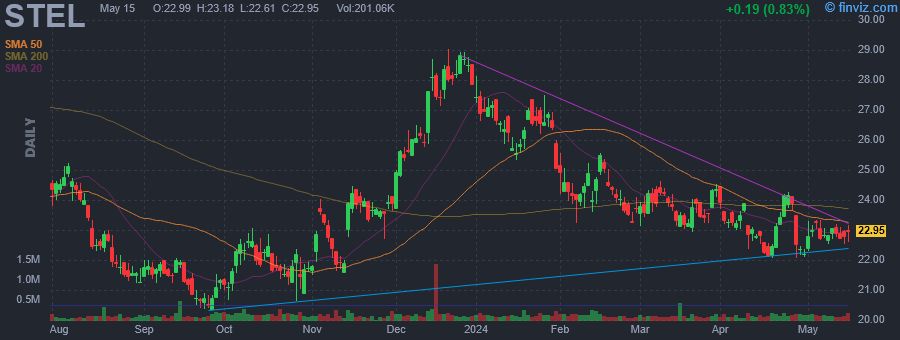
| Avg Volume | 140.79K | 52W Range | 20.24 - 29.04 |
|
|
|
|
Stellar Bancorp, Inc. operates a holding company that provides commercial banking services such as personal and commercial banking, real estate loans, and investment services, as well as offers deposits, debit and credit cards, cash management, treasury, and online banking services primarily to small and medium-sized businesses, professionals, and individual customers. The company was founded in 2007 and is headquartered in Houston, TX. |
| Insider Trading |
Relationship |
Date |
Transaction |
Cost |
#Shares |
Value ($) |
#Shares Total |
SEC Form 4 |
| Vitulli, III Ramon A. | President | Mar 19 '24 | Option Exercise | 14.11 | 13,262 | 187,127 | 125,308 | Mar 21 05:18 PM | | Akin Okan I. | Senior Executive VP, CRO | Dec 04 '23 | Option Exercise | 14.11 | 11,200 | 158,032 | 84,485 | Dec 06 05:09 PM | | Akin Okan I. | Senior Executive VP, CRO | Dec 04 '23 | Sale | 25.40 | 11,200 | 284,436 | 73,285 | Dec 06 05:09 PM | | Egge Paul P | Senior Executive VP, CFO | Nov 06 '23 | Sale | 23.27 | 4,000 | 93,098 | 53,465 | Nov 08 04:59 PM | | Akin Okan I. | Senior Executive VP, CRO | Aug 30 '23 | Option Exercise | 14.11 | 12,735 | 179,691 | 74,747 | Sep 01 04:25 PM |
|
|
 |
 |
| Market Cap | 2.98B | EPS (ttm) | 2.15 |
| P/E | 32.80 | EPS this Y | 4.02% |
| Forward P/E | 21.29 | EPS next Y | 11.09% |
| PEG | 8.63 | EPS past 5Y | -9.80% |
| P/S | 2.02 | EPS next 5Y | 3.80% |
| P/B | 2.81 | EPS Q/Q | -8.16% |
| Dividend | 2.39% | Sales Q/Q | 4.24% |
| Insider Own | 16.32% | Inst Own | 76.47% |
| Insider Trans | 0.00% | Inst Trans | -1.17% |
| Short Float | 1.66% | Earnings | Apr 26/b |
| Analyst Recom | 1.50 | Target Price | 74.00 |
| Avg Volume | 240.13K | 52W Range | 52.90 - 78.70 |
|
|
|
|
Sensient Technologies Corp. engages in the manufacture of colors, flavors, and fragrances. It operates through the following segments: Flavors and Fragrances Group, Color Group, and Asia Pacific Group. The Flavors and Fragrances segment includes beverage flavors, bionutrients, savory flavors, sweet flavors, natural ingredients, and fragrance compounds and ingredients. The Color segment consists of natural and synthetic color solutions for the food and beverage, cosmetic, pharmaceutical, and industrial markets. The Asia Pacific segment markets product lines in the Pacific Rim under the Sensient name. The company was founded in 1882 and is headquartered in Milwaukee, WI. |
| Insider Trading |
Relationship |
Date |
Transaction |
Cost |
#Shares |
Value ($) |
#Shares Total |
SEC Form 4 |
| Manning Paul | Chairman, President & CEO | Feb 08 '24 | Option Exercise | 0.00 | 36,005 | 0 | 243,357 | Feb 09 06:01 PM | | Manning John J | SVP, GC & Secretary | Feb 08 '24 | Option Exercise | 0.00 | 5,021 | 0 | 29,932 | Feb 09 05:59 PM | | Jones Amy Schmidt | VP, HR and Senior Counsel | Feb 08 '24 | Option Exercise | 0.00 | 4,464 | 0 | 22,117 | Feb 09 05:57 PM | | Hoang Thierry | VP, Asia Pacific Group | Feb 08 '24 | Option Exercise | 0.00 | 1,623 | 0 | 10,436 | Feb 09 05:55 PM | | Geraghty Michael C | President, Color Group | Feb 08 '24 | Option Exercise | 0.00 | 6,441 | 0 | 43,735 | Feb 09 05:53 PM |
|
|
|
 |
| Market Cap | 667.62M | EPS (ttm) | 0.47 |
| P/E | 98.26 | EPS this Y | 587.88% |
| Forward P/E | 9.46 | EPS next Y | 7.93% |
| PEG | 12.28 | EPS past 5Y | -34.17% |
| P/S | 2.07 | EPS next 5Y | 8.00% |
| P/B | 0.99 | EPS Q/Q | -12.31% |
| Dividend | 5.19% | Sales Q/Q | 17.47% |
| Insider Own | 9.75% | Inst Own | 63.34% |
| Insider Trans | 0.14% | Inst Trans | 1.21% |
| Short Float | 1.80% | Earnings | Apr 26/b |
| Analyst Recom | 3.00 | Target Price | 52.50 |
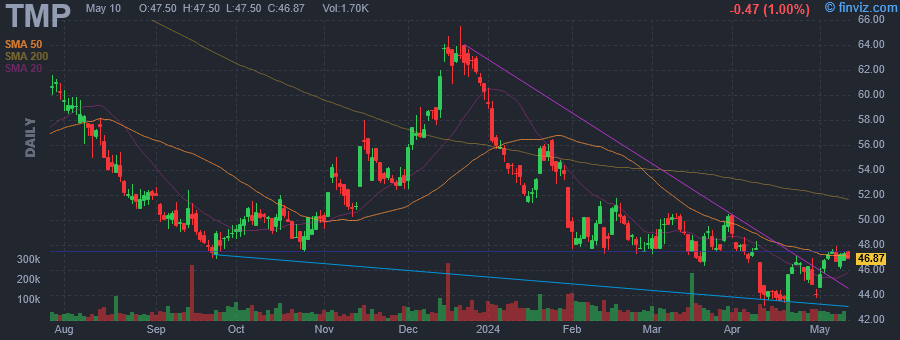
| Avg Volume | 65.15K | 52W Range | 43.09 - 65.54 |
|
|
|
|
Tompkins Financial Corp. engages in the provision of financial services. It operates through the following segments: Banking, Insurance, and Wealth Management. The Banking segment consists of its banking subsidiaries, including Tompkins Trust Co., The Bank of Castile, Mahopac Bank, and VIST Bank. The Insurance segment offers property and casualty insurance services, and employee benefits consulting. The Wealth Management segment consists of a comprehensive suite of financial services to customers, including trust and estate services, investment management, and insurance. The company was founded in 1995 and is headquartered in Ithaca, NY. |
| Insider Trading |
Relationship |
Date |
Transaction |
Cost |
#Shares |
Value ($) |
#Shares Total |
SEC Form 4 |
| Rahilly Ita M | Director | Feb 20 '24 | Buy | 50.46 | 1,982 | 100,000 | 8,454 | Feb 21 08:36 AM | | SPAIN MICHAEL H | Director | Jan 30 '24 | Option Exercise | 0.00 | 1,444 | 0 | 136,344 | Jan 31 11:47 AM | | WEBER ALFRED J | Director | Jan 30 '24 | Option Exercise | 0.00 | 646 | 0 | 13,667 | Jan 31 04:35 PM | | BATTAGLIA PAUL J. | Director | Jan 30 '24 | Option Exercise | 0.00 | 1,354 | 0 | 7,308 | Jan 31 05:00 PM | | Johnson Patricia A | Director | Jan 30 '24 | Option Exercise | 0.00 | 346 | 0 | 3,140 | Jan 31 12:51 PM |
|
|
| |
 |
| Market Cap | 5.35B | EPS (ttm) | 6.10 |
| P/E | 17.33 | EPS this Y | -23.64% |
| Forward P/E | 15.38 | EPS next Y | 15.31% |
| PEG | 2.37 | EPS past 5Y | 19.89% |
| P/S | 1.08 | EPS next 5Y | 7.30% |
| P/B | 68.67 | EPS Q/Q | -18.28% |
| Dividend | 0.24% | Sales Q/Q | 1.44% |
| Insider Own | 2.72% | Inst Own | 96.88% |
| Insider Trans | -5.61% | Inst Trans | -0.24% |
| Short Float | 2.40% | Earnings | Apr 26/b |
| Analyst Recom | 2.00 | Target Price | 124.00 |
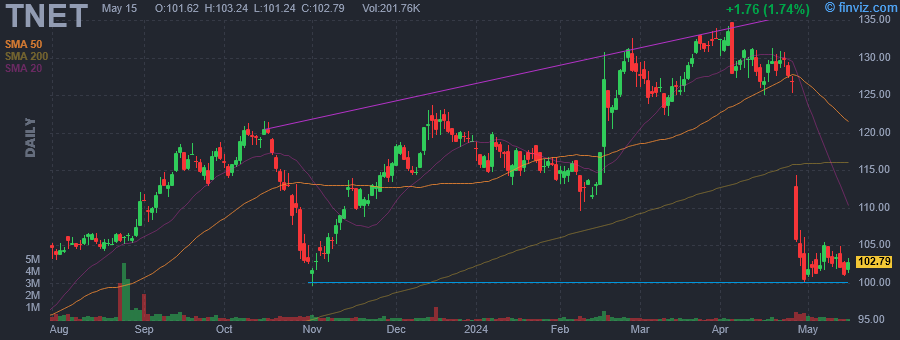
| Avg Volume | 226.17K | 52W Range | 79.00 - 134.67 |
|
|
|
|
TriNet Group, Inc. engages in the provision of comprehensive human resources solutions for small and medium-size businesses. The firm also offers access to human capital expertise, benefits, risk mitigation, compliance, payroll, and research and development tax credit services. The company was founded by Martin Babinec in 1988 and is headquartered in Dublin, CA. |
| Insider Trading |
Relationship |
Date |
Transaction |
Cost |
#Shares |
Value ($) |
#Shares Total |
SEC Form 4 |
| Goldfield Burton M. | Director | Feb 22 '24 | Sale | 124.63 | 16,200 | 2,018,956 | 364,479 | Feb 26 06:26 PM | | WELLINGTON SAMANTHA | EVP, CLO and SECRETARY | Feb 22 '24 | Sale | 124.88 | 14,271 | 1,782,231 | 48,562 | Feb 26 06:27 PM | | LOWELL WAYNE B | Director | Feb 21 '24 | Sale | 122.22 | 10,000 | 1,222,230 | 84,766 | Feb 23 04:34 PM | | TUMINELLI KELLY L | EVP & CHIEF FINANCIAL OFFICER | Feb 21 '24 | Sale | 122.67 | 4,396 | 539,235 | 65,999 | Feb 23 06:08 PM | | Chamberlain Paul Edward | Director | Feb 21 '24 | Sale | 121.74 | 1,750 | 213,036 | 36,716 | Feb 23 06:11 PM |
|
|
|
 |
| Market Cap | 25.50B | EPS (ttm) | 8.42 |
| P/E | 13.53 | EPS this Y | 13.16% |
| Forward P/E | 13.16 | EPS next Y | 0.88% |
| PEG | 19.34 | EPS past 5Y | 1.31% |
| P/S | 3.82 | EPS next 5Y | 0.70% |
| P/B | 2.60 | EPS Q/Q | 36.44% |
| Dividend | 4.33% | Sales Q/Q | 13.83% |
| Insider Own | 2.24% | Inst Own | 75.67% |
| Insider Trans | -1.75% | Inst Trans | 1.56% |
| Short Float | 4.91% | Earnings | Apr 26/b |
| Analyst Recom | 3.60 | Target Price | 112.67 |
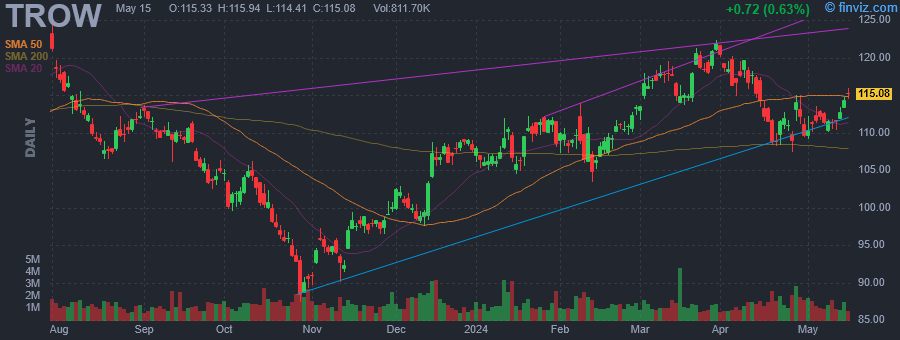
| Avg Volume | 1.39M | 52W Range | 87.43 - 132.76 |
|
|
|
|
T. Rowe Price Group, Inc. engages in the provision of investment management services. The company was founded by Thomas Rowe Price Jr. in 1937 and is headquartered in Baltimore, MD. |
| Insider Trading |
Relationship |
Date |
Transaction |
Cost |
#Shares |
Value ($) |
#Shares Total |
SEC Form 4 |
| HRABOWSKI FREEMAN A III | Director | Mar 08 '24 | Option Exercise | 77.64 | 8,740 | 678,560 | 29,813 | Mar 11 02:53 PM | | HRABOWSKI FREEMAN A III | Director | Mar 08 '24 | Sale | 118.32 | 8,740 | 1,034,147 | 21,073 | Mar 11 02:53 PM | | Hiebler Jessica M | Principal Accounting Officer | Feb 09 '24 | Option Exercise | 77.18 | 1,138 | 87,836 | 15,251 | Feb 12 11:32 AM | | Hiebler Jessica M | Principal Accounting Officer | Feb 09 '24 | Sale | 107.13 | 1,138 | 121,913 | 14,113 | Feb 12 11:32 AM | | Jackson Stephon A. | Vice President | Jan 31 '24 | Option Exercise | 75.85 | 15,502 | 1,175,853 | 96,814 | Feb 01 11:18 AM |
|
|
| |
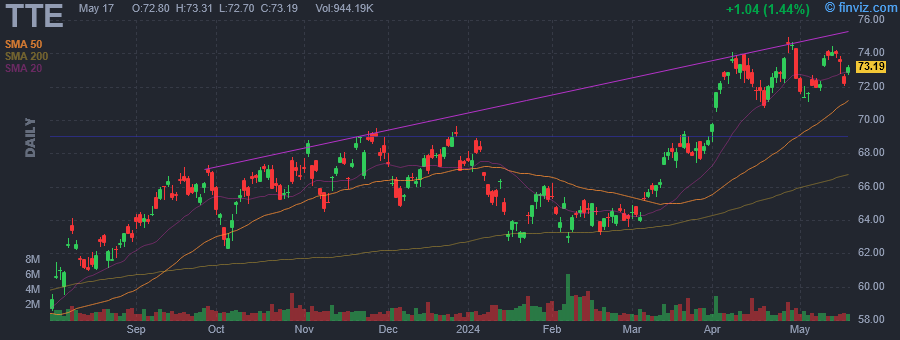 |
| Market Cap | 173.45B | EPS (ttm) | 8.97 |
| P/E | 8.32 | EPS this Y | -2.43% |
| Forward P/E | 8.09 | EPS next Y | 0.53% |
| PEG | - | EPS past 5Y | 15.04% |
| P/S | 0.82 | EPS next 5Y | -7.10% |
| P/B | 1.55 | EPS Q/Q | 7.96% |
| Dividend | 4.52% | Sales Q/Q | -10.90% |
| Insider Own | 0.00% | Inst Own | 6.65% |
| Insider Trans | - | Inst Trans | -5.44% |
| Short Float | 0.25% | Earnings | Apr 26/b |
| Analyst Recom | 1.96 | Target Price | 78.71 |
| Avg Volume | 1.70M | 52W Range | 54.94 - 74.06 |
|
|
|
|
TotalEnergies SE engages in the exploration and production of fuels, natural gas and low carbon electricity. It operates through the following business segments: Exploration & Production; Integrated Gas, Renewables & Power; Refining & Chemicals and Marketing & Services. The Exploration & Production segment encompasses oil and natural gas exploration and production activities. The Integrated Gas, Renewables & Power segment comprises integrated gas and low carbon electricity businesses. It also includes the upstream and midstream LNG activities. The Refining & Chemicals segment engages in the activities of refining, petrochemicals and specialty chemicals. This segment also includes the activities of oil supply, trading and marine shipping. The Marketing & Services segment includes the global activities of supply and marketing in the field of petroleum products. The company was founded on March 28, 1924 and is headquartered in Courbevoie, France. |
| Insider Trading |
Relationship |
Date |
Transaction |
Cost |
#Shares |
Value ($) |
#Shares Total |
SEC Form 4 |
| TotalEnergies SE | Director | Mar 28 '24 | Buy | 22.86 | 196,964 | 4,502,833 | 295,235 | Apr 01 04:45 PM | | TotalEnergies SE | Director | Mar 05 '24 | Option Exercise | 0.01 | 35,077,905 | 350,779 | 123,033,361 | Mar 07 04:16 PM |
|
|
|
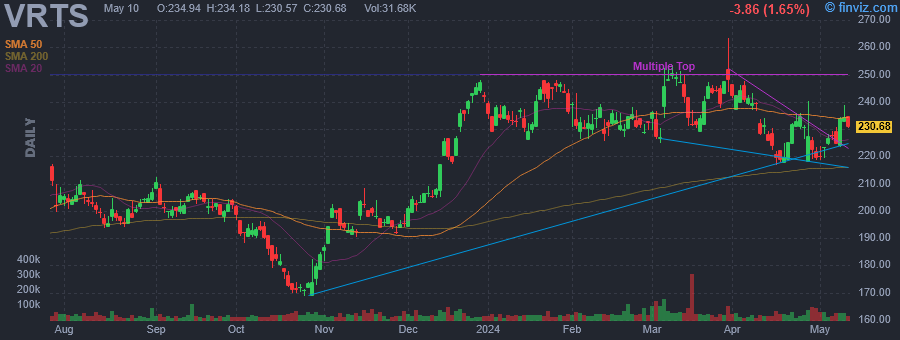 |
| Market Cap | 1.61B | EPS (ttm) | 16.60 |
| P/E | 13.71 | EPS this Y | 23.69% |
| Forward P/E | 7.73 | EPS next Y | 8.94% |
| PEG | 0.40 | EPS past 5Y | 17.58% |
| P/S | 1.85 | EPS next 5Y | 34.20% |
| P/B | 1.87 | EPS Q/Q | -21.34% |
| Dividend | 3.47% | Sales Q/Q | 11.74% |
| Insider Own | 6.62% | Inst Own | 81.99% |
| Insider Trans | -2.13% | Inst Trans | -6.17% |
| Short Float | 1.27% | Earnings | Apr 26/b |
| Analyst Recom | 3.00 | Target Price | 248.00 |
| Avg Volume | 55.35K | 52W Range | 165.00 - 263.39 |
|
|
|
|
Virtus Investment Partners, Inc. is an asset management company, which engages in the provision of investment management and related services to individuals and institutions. It offers financial solutions and products such as mutual funds, managed accounts, institutional, closed-end funds, Virtus variable insurance trust funds, and other portfolio. The company was founded on November 1, 1995, and is headquartered in Hartford, CT. |
| Insider Trading |
Relationship |
Date |
Transaction |
Cost |
#Shares |
Value ($) |
#Shares Total |
SEC Form 4 |
| ZARRILLI STEPHEN T | Director | Mar 06 '24 | Sale | 248.40 | 2,150 | 534,055 | 3,549 | Mar 07 04:49 PM | | Angerthal Michael A | EVP, CFO & Treasurer | Feb 05 '24 | Sale | 232.51 | 8,049 | 1,871,471 | 69,897 | Feb 05 06:43 PM |
|
|
| |
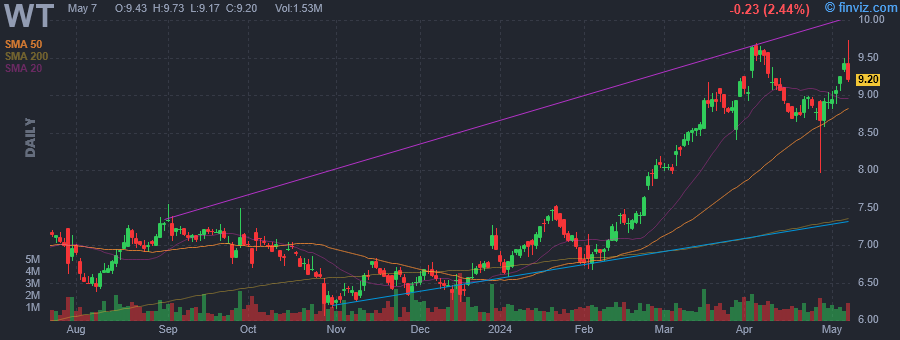 |
| Market Cap | 1.31B | EPS (ttm) | 0.55 |
| P/E | 15.73 | EPS this Y | 97.60% |
| Forward P/E | 14.84 | EPS next Y | 12.77% |
| PEG | 7.79 | EPS past 5Y | 19.30% |
| P/S | 3.76 | EPS next 5Y | 2.02% |
| P/B | 3.07 | EPS Q/Q | 178.10% |
| Dividend | 1.39% | Sales Q/Q | 23.90% |
| Insider Own | 0.80% | Inst Own | 76.20% |
| Insider Trans | 33.34% | Inst Trans | -0.50% |
| Short Float | 8.67% | Earnings | Apr 26/b |
| Analyst Recom | 2.20 | Target Price | 10.59 |
| Avg Volume | 1.19M | 52W Range | 6.05 - 9.69 |
|
|
|
|
WisdomTree, Inc., through its subsidiaries, operates as an exchange-traded funds (ETFs) sponsor and asset manager. It offers ETFs in equities, currency, fixed income, and alternatives asset classes. The company also licenses its indexes to third parties for proprietary products, as well as offers a platform to promote the use of WisdomTree ETFs in 401(k) plans. It develops index using its fundamentally weighted index methodology. In addition, the company provides investment advisory services. The company was founded in 1985 and is based in New York, New York. |
| Insider Trading |
Relationship |
Date |
Transaction |
Cost |
#Shares |
Value ($) |
#Shares Total |
SEC Form 4 |
| Steinberg Jonathan L | Chief Executive Officer | Feb 13 '24 | Buy | 7.20 | 303,781 | 2,186,768 | 9,172,838 | Feb 14 09:18 AM | | Frankenthaler Marci | Chief Legal Officer | Jan 29 '24 | Option Exercise | 0.00 | 22,716 | 0 | 250,824 | Jan 31 04:43 PM | | Ziemba Peter M | Chief Administrative Officer | Jan 29 '24 | Option Exercise | 0.00 | 31,866 | 0 | 1,059,874 | Jan 31 04:51 PM | | Steinberg Jonathan L | Chief Executive Officer | Jan 29 '24 | Option Exercise | 0.00 | 260,618 | 0 | 9,002,103 | Jan 31 04:47 PM | | Marinof Alexis | Head of Europe | Jan 29 '24 | Option Exercise | 0.00 | 33,072 | 0 | 288,469 | Jan 31 04:45 PM |
|
|
|
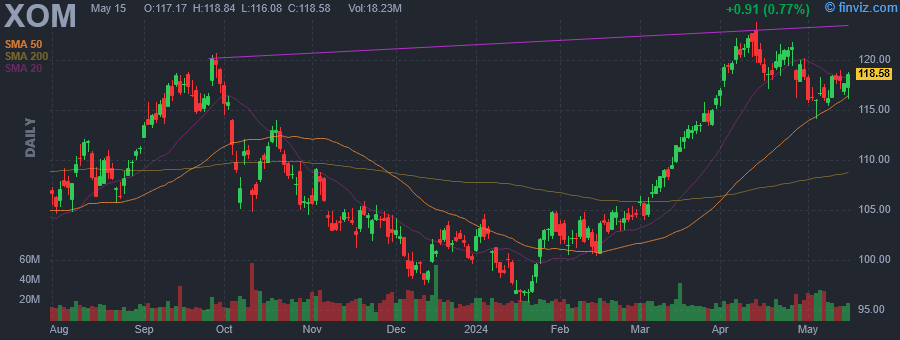 |
| Market Cap | 468.05B | EPS (ttm) | 8.15 |
| P/E | 14.47 | EPS this Y | -2.28% |
| Forward P/E | 12.13 | EPS next Y | 4.53% |
| PEG | - | EPS past 5Y | 12.74% |
| P/S | 1.41 | EPS next 5Y | -2.00% |
| P/B | 2.83 | EPS Q/Q | -26.07% |
| Dividend | 3.25% | Sales Q/Q | -3.11% |
| Insider Own | 0.16% | Inst Own | 62.65% |
| Insider Trans | -22.51% | Inst Trans | 0.70% |
| Short Float | 2.69% | Earnings | Apr 26/b |
| Analyst Recom | 2.04 | Target Price | 129.43 |
| Avg Volume | 17.72M | 52W Range | 95.77 - 123.75 |
|
|
|
Today 09:00AM
|
Exxon and Chevron Output Booms in Worlds Hottest Oil Patches
(Bloomberg) |
|
09:00AM
|
Chevron and Exxon Earnings Are in... Are they Good Buys?
(InvestorPlace) |
|
08:49AM
|
12 Most Profitable Dividend Stocks To Invest In
(Insider Monkey) |
|
03:03AM
|
Exxon Mobil Corp (XOM) Q1 2024 Earnings Call Transcript Highlights: Strategic Insights and ...
(GuruFocus.com) |
|
Apr-26-24 10:53PM
|
Q1 2024 Exxon Mobil Corp Earnings Call
(Thomson Reuters StreetEvents) |
|
05:37PM
|
Exxon and Chevron Earnings Fall Back to Earth
(The Wall Street Journal) |
|
04:29PM
|
Exxons profits are falling, but CEO Darren Woods compensation rose last yearheres how the oil giant rewards its top exec
(Fortune) |
|
04:12PM
|
These Stocks Moved the Most Today: Alphabet, Microsoft, Intel, Snap, Exxon, Roku, Skechers, ResMed, and More
(Barrons.com) |
|
04:08PM
|
What Exxon, Chevron Q1 earnings mean for the energy sector
(Yahoo Finance Video) |
|
04:02PM
|
Exxon, Chevron Earnings Fall As Supermajors Spar Over South America's Oil Jewel
(Investor's Business Daily) |
|
Exxon Mobil Corp. engages in the exploration, development, and distribution of oil, gas, and petroleum products. It operates through the following segments: Upstream, Downstream and Chemical. The Upstream segment produces crude oil and natural gas. The Downstream segment manufactures and trades petroleum products. The Chemical segment offers petrochemicals. The company was founded by John D. Rockefeller in 1882 and is headquartered in Spring, TX. |
| Insider Trading |
Relationship |
Date |
Transaction |
Cost |
#Shares |
Value ($) |
#Shares Total |
SEC Form 4 |
| Talley Darrin L | Vice President | Mar 19 '24 | Sale | 113.33 | 2,400 | 271,980 | 27,789 | Mar 19 04:37 PM | | Talley Darrin L | Vice President | Feb 22 '24 | Sale | 105.00 | 2,400 | 252,000 | 30,189 | Feb 23 10:39 AM | | Fox Leonard M. | Vice President and Controller | Dec 18 '23 | Sale | 102.65 | 12,000 | 1,231,800 | 220,678 | Dec 19 11:13 AM | | UBBEN JEFFREY W | Director | Nov 28 '23 | Sale | 104.06 | 2,077,000 | 216,127,428 | 0 | Nov 30 09:45 PM | | UBBEN JEFFREY W | Director | Nov 06 '23 | Buy | 105.97 | 250,000 | 26,491,420 | 2,077,000 | Nov 08 04:30 PM |
|
|
|
