NEW: Premarket Now Starts at 4AM!

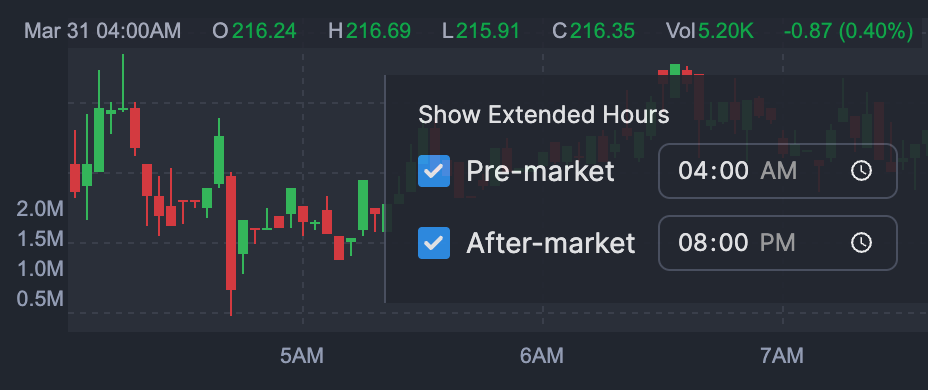
We’re excited to announce the extension of premarket and aftermarket hours! Our members now have access to quotes daily from 4:00 AM to 8:00 PM ET — offering greater flexibility and deeper insights into market trends beyond regular trading hours.

Upgrade to FINVIZ*Elite to access premarket quotes »

Last Close
May 09 04:00PM ET
12.01
Dollar change
-0.21
Percentage change
-1.72
%
IndexRUT P/E97.80 EPS (ttm)0.12 Insider Own12.25% Shs Outstand94.95M Perf Week-7.62%
Market Cap1.14B Forward P/E7.43 EPS next Y1.62 Insider Trans-0.01% Shs Float83.32M Perf Month-11.95%
Income12.00M PEG8.62 EPS next Q-0.02 Inst Own91.29% Short Float15.39% Perf Quarter-33.43%
Sales7.99B P/S0.14 EPS this Y-0.76% Inst Trans-1.99% Short Ratio2.88 Perf Half Y-50.94%
Book/sh30.64 P/B0.39 EPS next Y18.83% ROA0.26% Short Interest12.82M Perf Year-49.13%
Cash/sh4.27 P/C2.82 EPS next 5Y11.34% ROE0.62% 52W Range11.00 - 33.94 Perf YTD-44.81%
Dividend Est.- P/FCF11.29 EPS past 5Y-51.11% ROI0.23% 52W High-64.61% Beta1.40
Dividend TTM- Quick Ratio0.55 Sales past 5Y0.36% Gross Margin26.54% 52W Low9.18% ATR (14)0.81
Dividend Ex-DateOct 12, 2023 Current Ratio1.70 EPS Y/Y TTM103.63% Oper. Margin2.50% RSI (14)44.20 Volatility5.01% 5.81%
Employees47306 Debt/Eq0.96 Sales Y/Y TTM-2.20% Profit Margin0.15% Recom2.90 Target Price17.47
Option/ShortYes / Yes LT Debt/Eq0.78 EPS Q/Q112.41% Payout0.00% Rel Volume0.55 Prev Close12.22
Sales Surprise-3.39% EPS Surprise19.68% Sales Q/Q-5.70% EarningsMay 05 BMO Avg Volume4.45M Price12.01
SMA200.49% SMA50-14.60% SMA200-44.50% Trades Volume2,437,967 Change-1.72%
Date Action Analyst Rating Change Price Target Change
Mar-03-25Reiterated Evercore ISI Outperform $30 → $22
Jan-24-25Reiterated Needham Buy $25 → $24
Dec-05-24Reiterated Telsey Advisory Group Market Perform $30 → $24
Nov-22-24Initiated Needham Buy $27
Oct-07-24Initiated Gordon Haskett Accumulate $27
Aug-29-24Upgrade Barclays Equal Weight → Overweight $34
Aug-29-24Reiterated Telsey Advisory Group Market Perform $27 → $30
Aug-23-24Resumed Piper Sandler Neutral $30
Jul-18-24Downgrade Morgan Stanley Equal-Weight → Underweight $24 → $18
May-31-24Reiterated Telsey Advisory Group Market Perform $26 → $27
May-09-25 08:47AM
May-05-25 12:32AM
May-01-25 06:45AM
04:15AM
Apr-29-25 05:02AM
01:13PM Loading…
Apr-27-25 01:13PM
Apr-25-25 04:40PM
Apr-21-25 01:11PM
Apr-16-25 11:08AM
06:36AM
Apr-15-25 07:03AM
Apr-11-25 09:01AM
Apr-10-25 10:07AM
07:09AM
Apr-04-25 11:30AM
11:31AM Loading…
Apr-03-25 11:31AM
Apr-02-25 05:57AM
Apr-01-25 08:59AM
Mar-31-25 11:40AM
Mar-27-25 04:15PM
09:02AM
08:19AM
Mar-26-25 11:18AM
11:18AM
06:45AM
Mar-22-25 10:20AM
Mar-21-25 09:34AM
Mar-20-25 06:42PM
06:42PM
05:13PM
04:53PM Loading…
04:53PM
04:53PM
04:53PM
04:53PM
04:27PM
11:43AM
Mar-19-25 08:01AM
Mar-14-25 10:25AM
05:41AM
Mar-10-25 03:03AM
Mar-09-25 11:03AM
Mar-07-25 11:05AM
10:50AM
07:41AM
Mar-06-25 02:20PM
02:04AM
Mar-05-25 02:43PM
01:02PM
12:55PM
11:50AM
11:21AM
11:10AM
11:09AM
09:30AM
07:56AM
07:55AM
07:40AM
07:26AM
07:26AM
07:00AM
06:55AM
06:45AM
06:45AM
Mar-04-25 04:45PM
08:02AM
Mar-03-25 09:13AM
Mar-02-25 09:29AM
Feb-28-25 09:15AM
Feb-26-25 03:17PM
Feb-18-25 08:13AM
Feb-05-25 06:45AM
Feb-04-25 02:54PM
07:10AM
04:30AM
Jan-31-25 11:33AM
Jan-29-25 08:00AM
07:05AM
Jan-28-25 09:50AM
Jan-27-25 04:01AM
Jan-17-25 07:00AM
04:04AM
Jan-14-25 06:45AM
Jan-13-25 01:55PM
04:03AM
Jan-03-25 11:30AM
Dec-30-24 11:26AM
11:00AM
Dec-27-24 07:10PM
Dec-23-24 04:09AM
Dec-20-24 07:39AM
Dec-19-24 04:01AM
Dec-06-24 06:07AM
Dec-05-24 05:04AM
02:00AM
Dec-04-24 10:03PM
04:22PM
04:05PM
01:20PM
01:16PM
01:03PM
Foot Locker, Inc. engages in the retail of athletic shoes and apparel. The firm uses omni-channel capabilities to bridge the digital world and physical stores, including order-in-store, buy online and pickup-in-store, and buy online and ship-from-store, as well as e-commerce. It operates through the following geographical segments: North America, Europe, Middle East, and Africa (EMEA), and Asia Pacific. The North America segment includes Foot Locker, Champs Sports, Kids Foot Locker, and WSS banners operating in the U.S. and Canada, including related e-commerce businesses. The EMEA segment consists of Foot Locker and Kids Foot Locker banners operating in Europe, including related e-commerce businesses. The Asia Pacific segment is composed of the Foot Locker banner and related e-commerce business operating in Australia, New Zealand, and Asia, as well as Atmos, which operates primarily in Asia. The company was founded on April 7, 1989 and is headquartered in New York, NY.
Insider Trading Relationship Date Transaction Cost #Shares Value ($) #Shares Total SEC Form 4
PAYNE ULICE JRDirectorDec 27 '24Sale22.511,10024,75718,301Dec 30 04:04 PM
Ulice Payne Jr.DirectorDec 27 '24Proposed Sale22.411,10024,651Dec 27 11:19 AM
Vesa Equity Investment S.a r.l10% OwnerAug 27 '24Sale32.99337,77811,144,20810,055,814Aug 28 09:03 AM
Vesa Equity Investment S.a r.l10% OwnerAug 26 '24Sale33.22539,18017,912,36810,393,592Aug 27 09:53 AM
Vesa Equity Investment S.a r.l10% OwnerAug 23 '24Sale32.93213,5207,032,08910,932,772Aug 26 07:08 AM
Vesa Equity Investment S.a r.l10% OwnerAug 22 '24Sale32.93246,8868,129,66011,146,292Aug 23 09:08 AM
Vesa Equity Investment S.a r.l10% OwnerAug 21 '24Sale33.069,175303,28111,393,178Aug 22 09:09 AM
Vesa Equity Investment S.a r.l10% OwnerAug 20 '24Sale32.901,50049,35111,402,353Aug 22 09:09 AM
Vesa Equity Investment S.a r.l10% OwnerAug 16 '24Sale32.9762,9102,073,93511,405,661Aug 20 04:05 PM
Vesa Equity Investment S.a r.l10% OwnerAug 19 '24Sale32.921,80859,52711,403,853Aug 20 04:05 PM
Last Close
May 09 04:00PM ET
392.17
Dollar change
+3.93
Percentage change
1.01
%
ULTA Ulta Beauty Inc daily Stock Chart
IndexS&P 500 P/E15.46 EPS (ttm)25.37 Insider Own0.31% Shs Outstand45.97M Perf Week-0.92%
Market Cap17.77B Forward P/E15.46 EPS next Y25.36 Insider Trans0.38% Shs Float45.17M Perf Month7.98%
Income1.20B PEG3.70 EPS next Q5.75 Inst Own96.09% Short Float5.88% Perf Quarter4.64%
Sales11.30B P/S1.57 EPS this Y-9.86% Inst Trans0.47% Short Ratio2.52 Perf Half Y2.42%
Book/sh54.14 P/B7.24 EPS next Y11.03% ROA18.53% Short Interest2.66M Perf Year-0.38%
Cash/sh15.52 P/C25.27 EPS next 5Y4.18% ROE50.39% 52W Range309.01 - 460.00 Perf YTD-9.83%
Dividend Est.- P/FCF18.51 EPS past 5Y15.84% ROI29.13% 52W High-14.75% Beta1.04
Dividend TTM- Quick Ratio0.58 Sales past 5Y10.46% Gross Margin38.84% 52W Low26.91% ATR (14)12.44
Dividend Ex-DateMar 16, 2012 Current Ratio1.69 EPS Y/Y TTM-2.70% Oper. Margin13.98% RSI (14)58.08 Volatility2.10% 3.05%
Employees58000 Debt/Eq0.77 Sales Y/Y TTM0.79% Profit Margin10.63% Recom2.23 Target Price417.13
Option/ShortYes / Yes LT Debt/Eq0.66 EPS Q/Q4.70% Payout0.00% Rel Volume0.45 Prev Close388.24
Sales Surprise0.62% EPS Surprise18.58% Sales Q/Q-1.88% EarningsMay 29 AMC Avg Volume1.05M Price392.17
SMA203.20% SMA507.54% SMA2003.46% Trades Volume475,966 Change1.01%
Date Action Analyst Rating Change Price Target Change
Apr-14-25Downgrade Argus Buy → Hold
Apr-01-25Upgrade Goldman Neutral → Buy $423
Mar-14-25Reiterated Telsey Advisory Group Outperform $500 → $460
Jan-21-25Upgrade Morgan Stanley Equal-Weight → Overweight $430 → $500
Jan-07-25Upgrade B. Riley Securities Sell → Neutral
Dec-06-24Reiterated Telsey Advisory Group Outperform $450 → $500
Nov-21-24Downgrade William Blair Outperform → Mkt Perform
Sep-23-24Downgrade TD Cowen Buy → Hold
Sep-10-24Initiated B. Riley Securities Sell $300
Sep-03-24Reiterated Loop Capital Buy $520 → $450
May-08-25 09:00AM
May-07-25 05:49PM
08:00AM
May-06-25 05:45PM
May-02-25 10:54AM
05:45PM Loading…
Apr-30-25 05:45PM
10:44AM
12:01AM
Apr-29-25 05:50PM
03:28PM
Apr-28-25 04:37PM
12:50PM
09:07AM
12:01AM
Apr-25-25 09:00AM
12:01AM Loading…
12:01AM
Apr-24-25 03:20PM
11:00AM
Apr-23-25 05:50PM
12:41PM
Apr-21-25 11:22AM
05:00AM
Apr-18-25 03:24PM
11:30AM
01:00AM
Apr-17-25 10:49AM
07:55AM
02:05AM
02:05AM
Apr-15-25 04:10AM
10:06AM Loading…
Apr-14-25 10:06AM
07:15AM
Apr-11-25 05:50PM
11:34AM
Apr-09-25 12:47PM
Apr-08-25 11:35AM
08:21AM
Apr-07-25 08:11AM
Apr-05-25 07:42AM
Apr-03-25 12:46PM
11:47AM
06:19AM
Apr-02-25 06:48PM
10:27AM
12:01AM
Apr-01-25 11:50PM
11:27AM
09:47AM
04:28AM
Mar-31-25 06:08AM
Mar-30-25 07:30AM
Mar-28-25 11:16AM
Mar-27-25 05:31PM
04:05PM
09:49AM
Mar-25-25 01:00AM
Mar-24-25 10:49AM
Mar-22-25 04:43PM
04:15AM
Mar-20-25 04:12AM
03:02AM
Mar-19-25 06:00AM
Mar-18-25 10:08AM
10:07AM
Mar-17-25 10:20AM
09:17AM
Mar-15-25 09:16AM
Mar-14-25 06:25PM
04:41PM
04:33PM
04:31PM
03:28PM
02:36PM
01:04PM
01:04PM
12:30PM
12:12PM
11:55AM
11:48AM
11:29AM
11:17AM
10:33AM
09:48AM
09:41AM
09:35AM
09:23AM
08:57AM
08:02AM
06:17AM
03:10AM
12:00AM
Mar-13-25 10:37PM
06:13PM
06:00PM
05:20PM
05:19PM
05:15PM
04:46PM
04:38PM
04:28PM
Ulta Beauty, Inc. engages in the retail of beauty products. The company has one reportable segment, which includes retail stores, salon services, and e-commerce. Its products include makeup, skin care, tools and brushes, fragrance, and bath and body. The company was founded on January 9, 1990 and is headquartered in Bolingbrook, IL.
Insider Trading Relationship Date Transaction Cost #Shares Value ($) #Shares Total SEC Form 4
Caro Jodi JGC, Chief Risk & Compl. Ofc.Apr 01 '25Option Exercise174.45902157,3548,534Apr 02 05:32 PM
Caro Jodi JGC, Chief Risk & Compl. Ofc.Apr 01 '25Sale369.16902332,9847,632Apr 02 05:32 PM
Caro Jodi JOfficerApr 01 '25Proposed Sale369.16902332,984Apr 01 04:08 PM
Steelman KeciaPresident and CEOMar 20 '25Buy346.891,440499,52816,992Mar 24 05:33 PM
Halligan Catherine AnnDirectorJul 02 '24Sale390.0810039,0082,017Jul 03 04:54 PM
Caro Jodi JGC, Chief Risk & Compl. Ofc.Jun 25 '24Sale388.68650252,6396,801Jun 27 05:00 PM
MRKONIC GEORGE R JRDirectorJun 04 '24Sale389.34397154,5682,000Jun 05 04:45 PM