 |
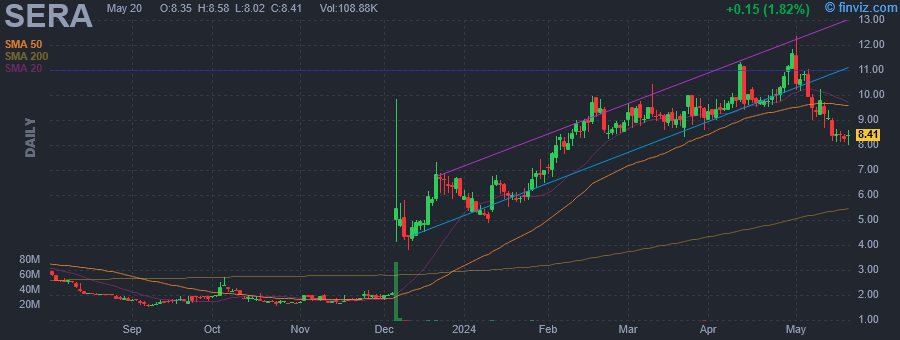
| Market Cap | 390.41M | EPS (ttm) | -1.16 |
| P/E | - | EPS this Y | 13.06% |
| Forward P/E | - | EPS next Y | 3.55% |
| PEG | - | EPS past 5Y | -21.21% |
| P/S | 1259.37 | EPS next 5Y | - |
| P/B | 5.26 | EPS Q/Q | 19.70% |
| Dividend | - | Sales Q/Q | -36.92% |
| Insider Own | 45.23% | Inst Own | 33.83% |
| Insider Trans | -1.62% | Inst Trans | 0.26% |
| Short Float | 1.28% | Earnings | May 08/a |
| Analyst Recom | 1.67 | Target Price | 2.75 |
| Avg Volume | 211.16K | 52W Range | 1.52 - 11.32 |
|
|
|
|
Sera Prognostics, Inc. engages in the provision of personalized diagnostics to predict and manage pregnancy complications. It focuses on developing blood tests to predict the risks of preterm birth, preeclampsia and other pregnancy complications. The company was founded by Steven W. Graves, Dennis Farrar and M. Sean Esplin in 2008 and is headquartered in Salt Lake City, UT. |
| Insider Trading |
Relationship |
Date |
Transaction |
Cost |
#Shares |
Value ($) |
#Shares Total |
SEC Form 4 |
| Boniface John J. | Chief Scientific Officer | Mar 28 '24 | Option Exercise | 0.91 | 24,474 | 22,271 | 164,245 | Mar 28 05:56 PM | | Boniface John J. | Chief Scientific Officer | Mar 28 '24 | Sale | 9.04 | 24,474 | 221,245 | 139,771 | Mar 28 05:56 PM | | Boniface John J. | Chief Scientific Officer | Mar 27 '24 | Option Exercise | 0.91 | 48,909 | 44,507 | 188,680 | Mar 28 05:56 PM | | Boniface John J. | Chief Scientific Officer | Mar 27 '24 | Sale | 9.62 | 52,662 | 506,608 | 139,771 | Mar 28 05:56 PM | | Lindgardt Zhenya | Chief Executive Officer | Mar 26 '24 | Sale | 9.37 | 38,899 | 364,484 | 908,104 | Mar 26 08:00 PM |
|
|
 |
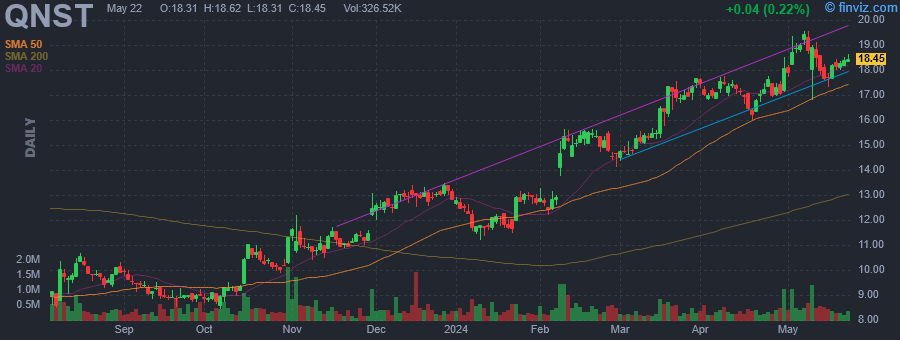 |
| Market Cap | 1.01B | EPS (ttm) | -1.45 |
| P/E | - | EPS this Y | 7.11% |
| Forward P/E | 35.02 | EPS next Y | 278.80% |
| PEG | - | EPS past 5Y | - |
| P/S | 1.84 | EPS next 5Y | 25.00% |
| P/B | 4.71 | EPS Q/Q | -41.99% |
| Dividend | - | Sales Q/Q | -8.48% |
| Insider Own | 9.67% | Inst Own | 93.96% |
| Insider Trans | -1.69% | Inst Trans | -2.04% |
| Short Float | 4.62% | Earnings | May 08/a |
| Analyst Recom | 1.57 | Target Price | 17.29 |
| Avg Volume | 373.65K | 52W Range | 6.79 - 17.76 |
|
|
|
|
QuinStreet, Inc. engages in performance marketplaces and technologies for the financial services and home services industries. QuinStreet is a pioneer in delivering online marketplace solutions to match searchers with brands in digital media, and is committed to providing consumers with the information and tools they need to research, find and select the products and brands that meet their needs. The company was founded by Douglas Valenti on April 16, 1999 and is headquartered in Foster City, CA. |
| Insider Trading |
Relationship |
Date |
Transaction |
Cost |
#Shares |
Value ($) |
#Shares Total |
SEC Form 4 |
| Wong Gregory | CFO | Feb 20 '24 | Sale | 15.03 | 8,407 | 126,357 | 295,204 | Feb 21 07:28 PM | | Wong Gregory | CFO | Dec 18 '23 | Sale | 12.94 | 7,145 | 92,456 | 309,116 | Dec 19 01:43 PM | | Wong Gregory | CFO | Dec 15 '23 | Sale | 12.85 | 25,865 | 332,365 | 316,261 | Dec 19 01:43 PM | | SHEEHAN ANDREW T | Director | Nov 15 '23 | Option Exercise | 3.40 | 50,000 | 170,000 | 114,848 | Nov 16 05:36 PM | | SHEEHAN ANDREW T | Director | Nov 15 '23 | Sale | 11.44 | 50,000 | 572,000 | 64,848 | Nov 16 05:36 PM |
|
|
|
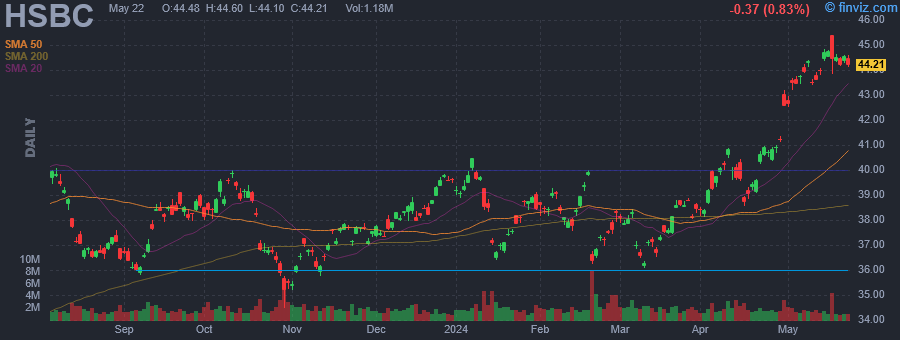 |
| Market Cap | 165.31B | EPS (ttm) | 5.68 |
| P/E | 7.71 | EPS this Y | 7.60% |
| Forward P/E | 7.22 | EPS next Y | -1.07% |
| PEG | 0.35 | EPS past 5Y | 12.69% |
| P/S | 1.22 | EPS next 5Y | 21.90% |
| P/B | 1.01 | EPS Q/Q | -103.43% |
| Dividend | 8.88% | Sales Q/Q | 18.27% |
| Insider Own | 0.00% | Inst Own | 1.55% |
| Insider Trans | - | Inst Trans | 1.65% |
| Short Float | 0.22% | Earnings | Apr 30/b |
| Analyst Recom | 1.33 | Target Price | 48.51 |
| Avg Volume | 2.21M | 52W Range | 35.30 - 42.47 |
|
|
|
|
HSBC Holdings Plc engages in the provision of banking and financial services. It operates through the following business segments: Retail Banking and Wealth Management, Commercial Banking, Global Banking and Markets, Global Private Banking, and Corporate Centre. The Retail Banking and Wealth Management segment consists of retail banking, wealth management, asset management, and insurance. The Commercial Banking segment offers banking products and services. The Global Banking and Markets segment includes transaction banking, financing, advisory, capital markets, and risk management services. The Global Private Banking offers transaction banking, financing, advisory, capital markets and risk management services to high-net-worth individuals and families. The Corporate Centre segment involves in central treasury, including balance sheet management, other legacy businesses, interests in associates and joint ventures, central stewardship costs and the UK bank levy. The company was founded on January 1, 1959 and is headquartered in London, the United Kingdom. |
|
| |
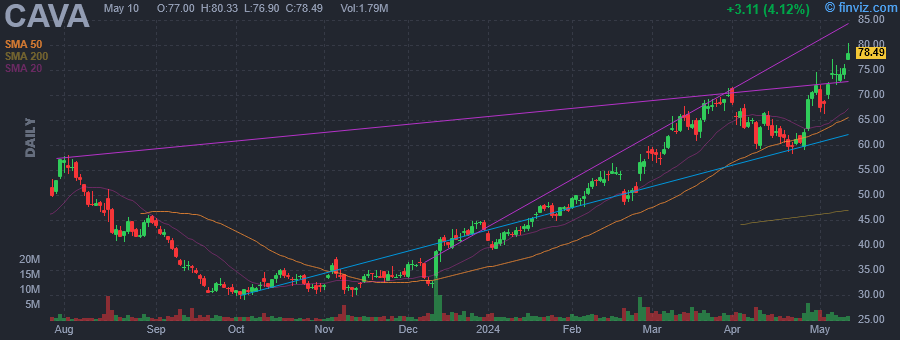 |
| Market Cap | 8.17B | EPS (ttm) | 0.12 |
| P/E | 615.05 | EPS this Y | 13.34% |
| Forward P/E | 223.15 | EPS next Y | 35.37% |
| PEG | 19.16 | EPS past 5Y | - |
| P/S | 11.21 | EPS next 5Y | 32.10% |
| P/B | 14.31 | EPS Q/Q | 110.85% |
| Dividend | - | Sales Q/Q | 36.35% |
| Insider Own | 23.03% | Inst Own | 66.19% |
| Insider Trans | -21.21% | Inst Trans | - |
| Short Float | 13.07% | Earnings | Feb 27/b |
| Analyst Recom | 1.81 | Target Price | 65.49 |
| Avg Volume | 2.44M | 52W Range | 29.05 - 71.60 |
|
|
|
|
Cava Group, Inc. is a holding company, which engages in the operation of restaurants. It operates through the following segments: CAVA, Zoes Kitchen, and Other. The CAVA segment represents the financial results of all CAVA restaurants. The Zoes Kitchen segment focuses on the financial results of all Zoes Kitchen locations. The company was founded by Brett Schulman, Ike Grigoropoulus, Dimitri Moshovitis, and Theodore Xenohristos in 2010 and is headquartered in Washington, DC. |
| Insider Trading |
Relationship |
Date |
Transaction |
Cost |
#Shares |
Value ($) |
#Shares Total |
SEC Form 4 |
| Xenohristos Theodoros | Director | Mar 26 '24 | Sale | 68.29 | 47,239 | 3,225,851 | 526,521 | Mar 28 04:01 PM | | Artal International S.C.A. | Director | Mar 21 '24 | Sale | 66.25 | 2,000,000 | 132,500,000 | 26,507,990 | Mar 25 04:15 PM | | SHAICH RONALD M | Former 10% Owner | Mar 04 '24 | Sale | 57.20 | 1,500,000 | 85,800,000 | 4,457,634 | Mar 06 04:00 PM | | Xenohristos Theodoros | Director | Feb 29 '24 | Sale | 58.51 | 4,500 | 263,295 | 0 | Mar 04 04:01 PM | | Artal International S.C.A. | Director | Feb 27 '24 | Sale | 53.60 | 3,500,000 | 187,600,000 | 28,507,990 | Feb 29 04:16 PM |
|
|
|
 |
| Market Cap | 6.34B | EPS (ttm) | 5.31 |
| P/E | 9.96 | EPS this Y | 6.06% |
| Forward P/E | 6.89 | EPS next Y | 33.42% |
| PEG | 1.88 | EPS past 5Y | 10.09% |
| P/S | 1.20 | EPS next 5Y | 5.30% |
| P/B | 1.99 | EPS Q/Q | -6.96% |
| Dividend | 6.80% | Sales Q/Q | 6.35% |
| Insider Own | 0.79% | Inst Own | 81.55% |
| Insider Trans | 0.00% | Inst Trans | 2.11% |
| Short Float | 2.96% | Earnings | Apr 30/b |
| Analyst Recom | 1.64 | Target Price | 54.08 |
| Avg Volume | 1.03M | 52W Range | 33.67 - 51.65 |
|
|
|
|
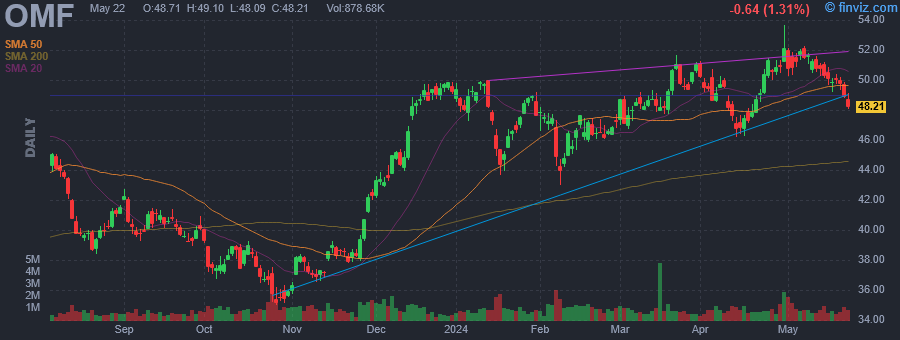
OneMain Holdings, Inc. is a consumer finance company, which engages in the origination, underwriting, and servicing of personal loans, primarily to non-prime customers. It operates through the Consumer and Insurance segment. The Consumer and Insurance segment offers services to secured and unsecured personal loans, voluntary credit, and non-credit insurance, and related products through its combined branch network, digital platform, and centralized operations. The company was founded on August 5, 2013, and is headquartered in Evansville, IN. |
|
| |
 |
| Market Cap | 2.47B | EPS (ttm) | -17.00 |
| P/E | - | EPS this Y | 370.08% |
| Forward P/E | 24.77 | EPS next Y | 134.61% |
| PEG | - | EPS past 5Y | - |
| P/S | 2.84 | EPS next 5Y | 11.50% |
| P/B | - | EPS Q/Q | -1149.41% |
| Dividend | - | Sales Q/Q | 15.18% |
| Insider Own | 1.33% | Inst Own | 130.74% |
| Insider Trans | -1.72% | Inst Trans | -1.40% |
| Short Float | 16.50% | Earnings | Mar 28/a |
| Analyst Recom | 1.46 | Target Price | 39.50 |
| Avg Volume | 2.23M | 52W Range | 13.13 - 37.08 |
|
|
|
|
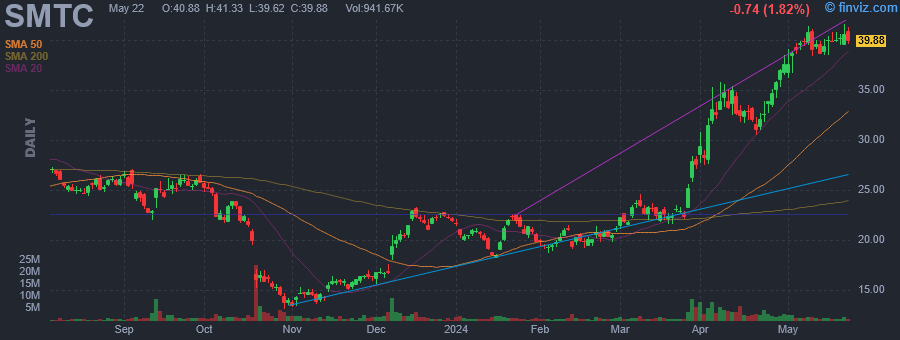
Semtech Corp. engages in the manufacture and supply of analog and mixed signal semiconductor products for high-end consumer, enterprise computing, communications, and industrial equipment. The firm operates through the following business segments: Protection, Signal Integrity, and Wireless & Sensing. It offers signal integrity, protection, wireless and sensing, and power and high-reliability products. The company was founded in 1960 and is headquartered in Camarillo, CA. |
| Insider Trading |
Relationship |
Date |
Transaction |
Cost |
#Shares |
Value ($) |
#Shares Total |
SEC Form 4 |
| Lin Mark | EVP and CFO | Apr 08 '24 | Buy | 33.23 | 1,000 | 33,232 | 1,000 | Apr 08 04:46 PM | | Pickle Paul H | President and CEO | Apr 01 '24 | Option Exercise | 0.00 | 10,305 | 0 | 23,350 | Apr 02 06:37 PM | | Rayabhari Madhusudhan | SVP and GM | Mar 09 '24 | Option Exercise | 0.00 | 2,348 | 0 | 32,663 | Mar 11 04:56 PM | | Rodensky Michael W | SVP | Mar 09 '24 | Option Exercise | 0.00 | 2,582 | 0 | 10,752 | Mar 11 05:00 PM | | Silberstein Asaf | EVP and COO | Mar 09 '24 | Option Exercise | 0.00 | 3,287 | 0 | 82,197 | Mar 11 05:04 PM |
|
|
|
 |
| Market Cap | 11.13B | EPS (ttm) | 5.83 |
| P/E | 19.08 | EPS this Y | -10.51% |
| Forward P/E | 15.45 | EPS next Y | 15.29% |
| PEG | 2.94 | EPS past 5Y | 40.40% |
| P/S | 0.54 | EPS next 5Y | 6.49% |
| P/B | 6.92 | EPS Q/Q | 144.28% |
| Dividend | - | Sales Q/Q | 7.80% |
| Insider Own | 3.03% | Inst Own | 95.21% |
| Insider Trans | -2.11% | Inst Trans | 2.74% |
| Short Float | 3.93% | Earnings | Apr 30/b |
| Analyst Recom | 1.45 | Target Price | 113.56 |
| Avg Volume | 1.20M | 52W Range | 51.04 - 107.80 |
|
|
|
|
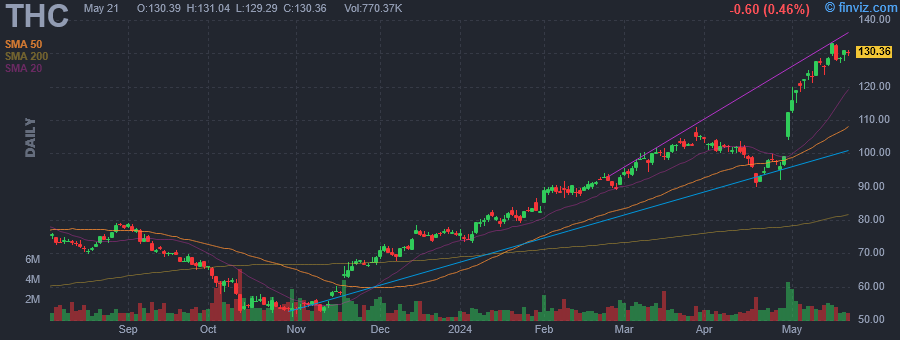
Tenet Healthcare Corp. engages in the provision of healthcare services. It operates through the Hospital Operations and Other, and Ambulatory Care segments. The Hospital Operations and Other segment is composed of acute care hospitals, ancillary outpatient facilities, urgent care centers, micro hospitals and physician practices. The Ambulatory Care segment includes the operations of the USPI joint venture and the company's nine Aspen facilities in the United Kingdom. The company was founded in 1969 and is headquartered in Dallas, TX. |
| Insider Trading |
Relationship |
Date |
Transaction |
Cost |
#Shares |
Value ($) |
#Shares Total |
SEC Form 4 |
| MARK RICHARD J | Director | Mar 12 '24 | Sale | 98.98 | 14,000 | 1,385,720 | 33,303 | Mar 14 08:00 PM | | Arbour Paola M | EVP, Chief Information Officer | Mar 06 '24 | Sale | 96.96 | 18,168 | 1,761,569 | 29,803 | Mar 08 08:00 PM | | Arnst Thomas W | EVP, Chief Admin. Officer & GC | Mar 01 '24 | Sale | 94.84 | 17,000 | 1,612,234 | 8,148 | Mar 05 08:00 PM | | Lynch Christopher S. | Director | Feb 15 '24 | Sale | 89.60 | 7,978 | 714,829 | 25,620 | Feb 16 08:15 PM | | FISHER RICHARD W | Director | Feb 14 '24 | Sale | 88.21 | 2,100 | 185,241 | 20,127 | Feb 15 08:00 PM |
|
|
| |
 |
| Market Cap | 68.53M | EPS (ttm) | -1.45 |
| P/E | - | EPS this Y | -6.02% |
| Forward P/E | - | EPS next Y | - |
| PEG | - | EPS past 5Y | -25.01% |
| P/S | - | EPS next 5Y | - |
| P/B | 118.46 | EPS Q/Q | 2.67% |
| Dividend | - | Sales Q/Q | - |
| Insider Own | 24.79% | Inst Own | 3.85% |
| Insider Trans | 13.83% | Inst Trans | 114.80% |
| Short Float | 5.07% | Earnings | Nov 07/b |
| Analyst Recom | 1.00 | Target Price | 14.00 |
| Avg Volume | 337.64K | 52W Range | 0.82 - 3.48 |
|
|
|
|
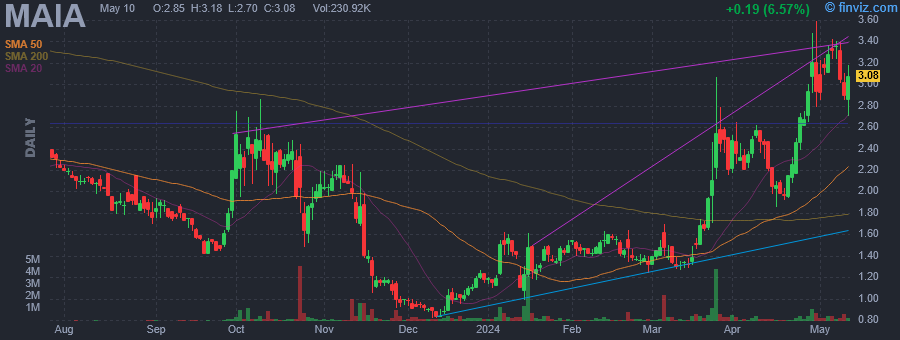
MAIA Biotechnology, Inc. is a clinical stage biotechnology company that is engaged in the discovery, development and commercialization of therapies targeting cancer. Its product, THIO, is an investigational dual mechanism of action drug candidate incorporating telomere targeting and immunogenicity. The company was founded on August 3, 2018 and is headquartered in Chicago, IL. |
| Insider Trading |
Relationship |
Date |
Transaction |
Cost |
#Shares |
Value ($) |
#Shares Total |
SEC Form 4 |
| Smith Stan | Director | Apr 25 '24 | Buy | 2.03 | 147,492 | 299,409 | 1,005,060 | Apr 26 05:30 PM | | Louie Ngar Yee | Director | Apr 25 '24 | Buy | 2.03 | 19,665 | 39,920 | 1,167,189 | Apr 26 05:33 PM | | Smith Stan | Director | Mar 14 '24 | Buy | 1.17 | 170,940 | 200,000 | 857,568 | Mar 15 07:11 PM | | Louie Ngar Yee | Director | Mar 14 '24 | Buy | 1.17 | 170,940 | 200,000 | 1,147,524 | Mar 15 07:09 PM | | Luput Cristian | Director | Mar 14 '24 | Buy | 1.17 | 69,282 | 81,060 | 367,350 | Mar 15 07:08 PM |
|
|
|
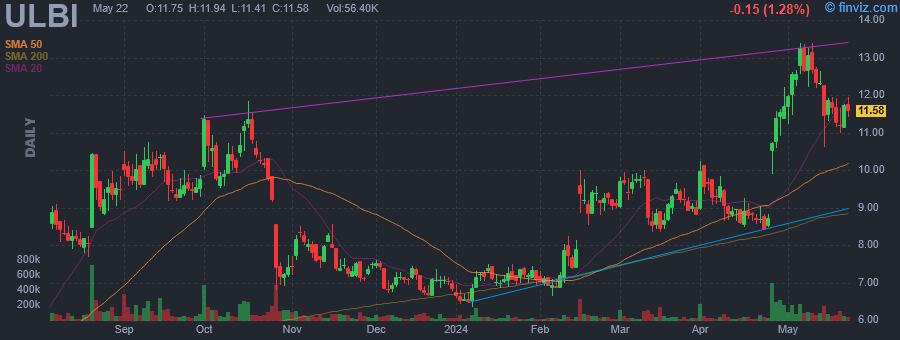 |
| Market Cap | 191.97M | EPS (ttm) | 0.64 |
| P/E | 18.30 | EPS this Y | 38.64% |
| Forward P/E | - | EPS next Y | - |
| PEG | 1.05 | EPS past 5Y | -21.88% |
| P/S | 1.14 | EPS next 5Y | 17.50% |
| P/B | 1.49 | EPS Q/Q | 917.76% |
| Dividend | - | Sales Q/Q | 31.37% |
| Insider Own | 41.94% | Inst Own | 30.84% |
| Insider Trans | 0.82% | Inst Trans | -2.26% |
| Short Float | 0.69% | Earnings | Apr 25/b |
| Analyst Recom | 1.00 | Target Price | 12.00 |
| Avg Volume | 74.86K | 52W Range | 3.92 - 11.85 |
|
|
|
|
Ultralife Corp. engages in the manufacture and sale of products for power solutions. It operates through the Battery & Energy Products and Communications System segments. The Battery & Energy Products segment includes Lithium 9-volt, cylindrical, thin cell and various other non-rechargeable batteries, in addition to rechargeable batteries, uninterruptable power supplies, charging systems, and accessories such as cables. The Communications System segment comprises radio frequency amplifiers, power supplies, cable and connector assemblies, amplified speakers, equipment mounts, case equipment, integrated communication systems for fixed or vehicle applications, and communications and electronics systems design. The company was founded by Arthur M. Liberman in December 1990 and is headquartered in Newark, NY. |
| Insider Trading |
Relationship |
Date |
Transaction |
Cost |
#Shares |
Value ($) |
#Shares Total |
SEC Form 4 |
| FAIN PHILIP A | CFO and Treasurer | Apr 17 '24 | Option Exercise | 5.71 | 7,179 | 40,974 | 137,809 | Apr 19 03:26 PM | | Manna Michael Edward | President and CEO | Mar 13 '24 | Buy | 8.60 | 1,000 | 8,600 | 18,374 | Mar 13 02:51 PM | | Manna Michael Edward | President and CEO | Dec 27 '23 | Option Exercise | 5.31 | 5,059 | 26,842 | 17,374 | Dec 29 12:54 PM | | WHITMORE BRADFORD T | Director | Dec 08 '23 | Buy | 7.19 | 7,000 | 50,339 | 1,226,842 | Dec 08 04:14 PM | | WHITMORE BRADFORD T | Director | Dec 06 '23 | Buy | 6.83 | 8,877 | 60,604 | 1,219,842 | Dec 08 04:14 PM |
|
|
|
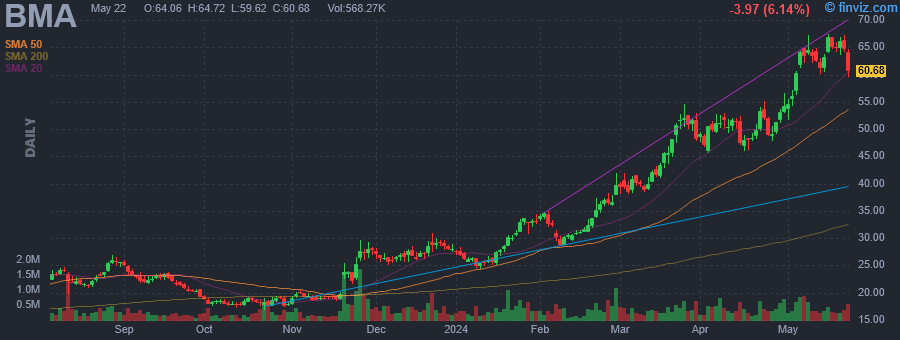 |
| Market Cap | 3.46B | EPS (ttm) | 22.12 |
| P/E | 2.49 | EPS this Y | -17.76% |
| Forward P/E | 4.84 | EPS next Y | 27.05% |
| PEG | 0.10 | EPS past 5Y | 29.81% |
| P/S | 0.30 | EPS next 5Y | 24.74% |
| P/B | 1.37 | EPS Q/Q | 810.71% |
| Dividend | 5.62% | Sales Q/Q | 200.01% |
| Insider Own | 0.02% | Inst Own | 5.78% |
| Insider Trans | 0.00% | Inst Trans | -10.10% |
| Short Float | 1.19% | Earnings | Feb 29/b |
| Analyst Recom | 3.20 | Target Price | 62.01 |
| Avg Volume | 381.60K | 52W Range | 14.71 - 55.11 |
|
|
|
|
Banco Macro SA engages in the provision of financial and banking services. It serves the low and mid-income individuals, and small and mid-sized companies. The firm offers savings, checking accounts, time deposits, fund management, loans, mortgages, and direct banking transactions. The company was founded on November 21, 1966 and is headquartered in Buenos Aires, Argentina. |
|
|
